
The Near Protocol (NEAR) price regained its footing on November 28 and is approaching its yearly high.
The increase took NEAR above the pivotal 0.618 Fib retracement resistance level. When will the price reach a new yearly high?
NEAR Approaches Yearly High
The weekly time frame technical analysis shows that the NEAR price had increased since October, when it broke out from a long-term descending resistance trend line. Before the breakout, the trend line had been in place for 440 days.
The upward movement since the breakout has been swift, with the price experiencing only one bearish weekly candlestick (red icon). Also, the altcoin reclaimed a pivotal horizontal resistance area during the upward movement.
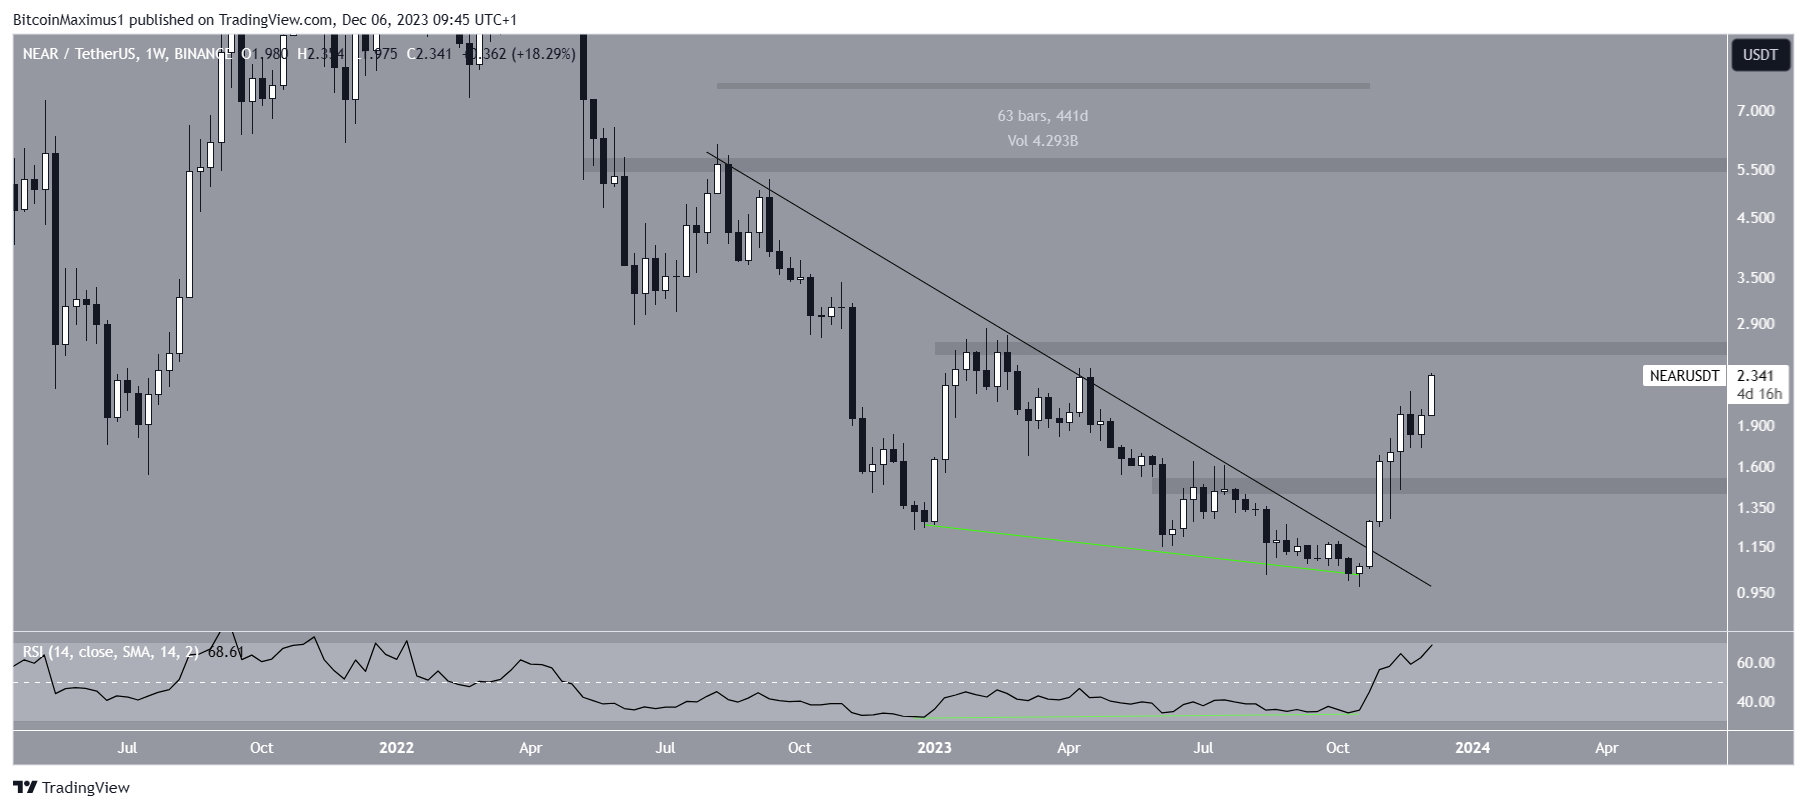
The Relative Strength Index (RSI) is a momentum indicator traders use to evaluate whether a market is overbought or oversold and whether to accumulate or sell an asset.
Readings above 50 and an upward trend suggest that bulls still have an advantage, while readings below 50 indicate the opposite.
The RSI is increasing and is above 50. Furthermore, it generated a bullish divergence (green) before the breakout. This is a bullish sign that often precedes bullish trend reversals.
Read More: 9 Best Crypto Demo Accounts For Trading
NEAR Price Prediction: What’s the Next Move?
Similarly to the weekly time frame, the daily time frame chart gives a bullish outlook. This is because of the price action and the RSI readings.
The price action shows that despite an initial rejection (red icon), NEAR broke out from the 0.618 Fib retracement resistance level on December 4. This is a sign that the upward movement is not corrective.
The daily RSI is bullish since it has broken out from its bearish divergence trend line (green). Additionally, it is increasing and is above 50.
Cryptocurrency trader ZaykCharts is extremely bullish about future price prospects. He tweeted that:
$NEAR Descending Channel Breakout is Done as Expected
Expecting Massive Bullish Wave
Osbrah is of the same mind, though he uses a shorter-term chart to conclude.
If the NEAR upward movement continues, the price can increase by another 15% and reach the horizontal resistance at $2.70.
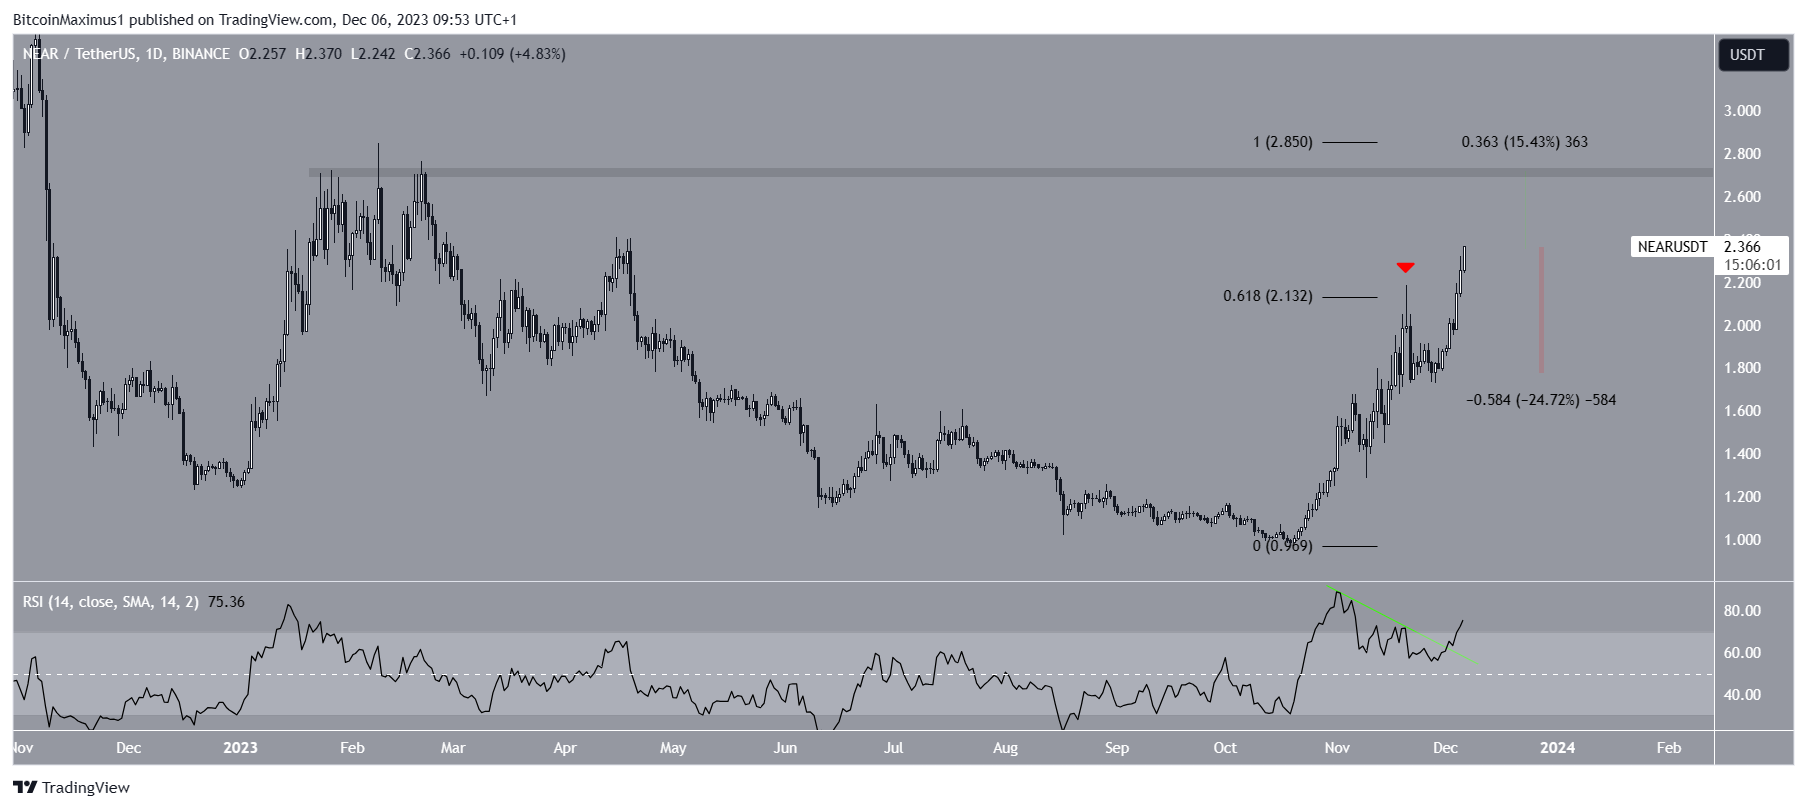
Despite this bullish NEAR price prediction, a decrease below the 0.618 Fib level at $2.13 will mean the upward movement is complete. A 25% retracement to $1.80 will then be expected.
For BeInCrypto’s latest crypto market analysis, click here.
