

Maker (MKR) has been one of the top-performing cryptocurrencies in the market this year. It reached a new yearly high of $1,450 on September 26.
The upward movement also caused a breakout above the $1,250 horizontal resistance area, which had been in place for over a year.
Maker Closes Above $1,250 Resistance
The MKR price has increased at a rapid pace since June. The rally stalled in July when the price was rejected by the $1,250 resistance area (red icon), creating a long upper wick.
The wick is considered a sign of selling pressure, indicating that buyers could not sustain the increase above the resistance area. Rather, sellers took over and pushed the price down.
However, the MKR price finally broke out above the area this week, reaching a new yearly high of $1,450. This was the highest price since May 2022.
The $1,250 area was crucial since it had provided resistance for more than a year. Therefore, a breakout above it could signify a bullish trend reversal.
The area is likely to provide support if the price returns to it. The next closest resistance is at $1,650.
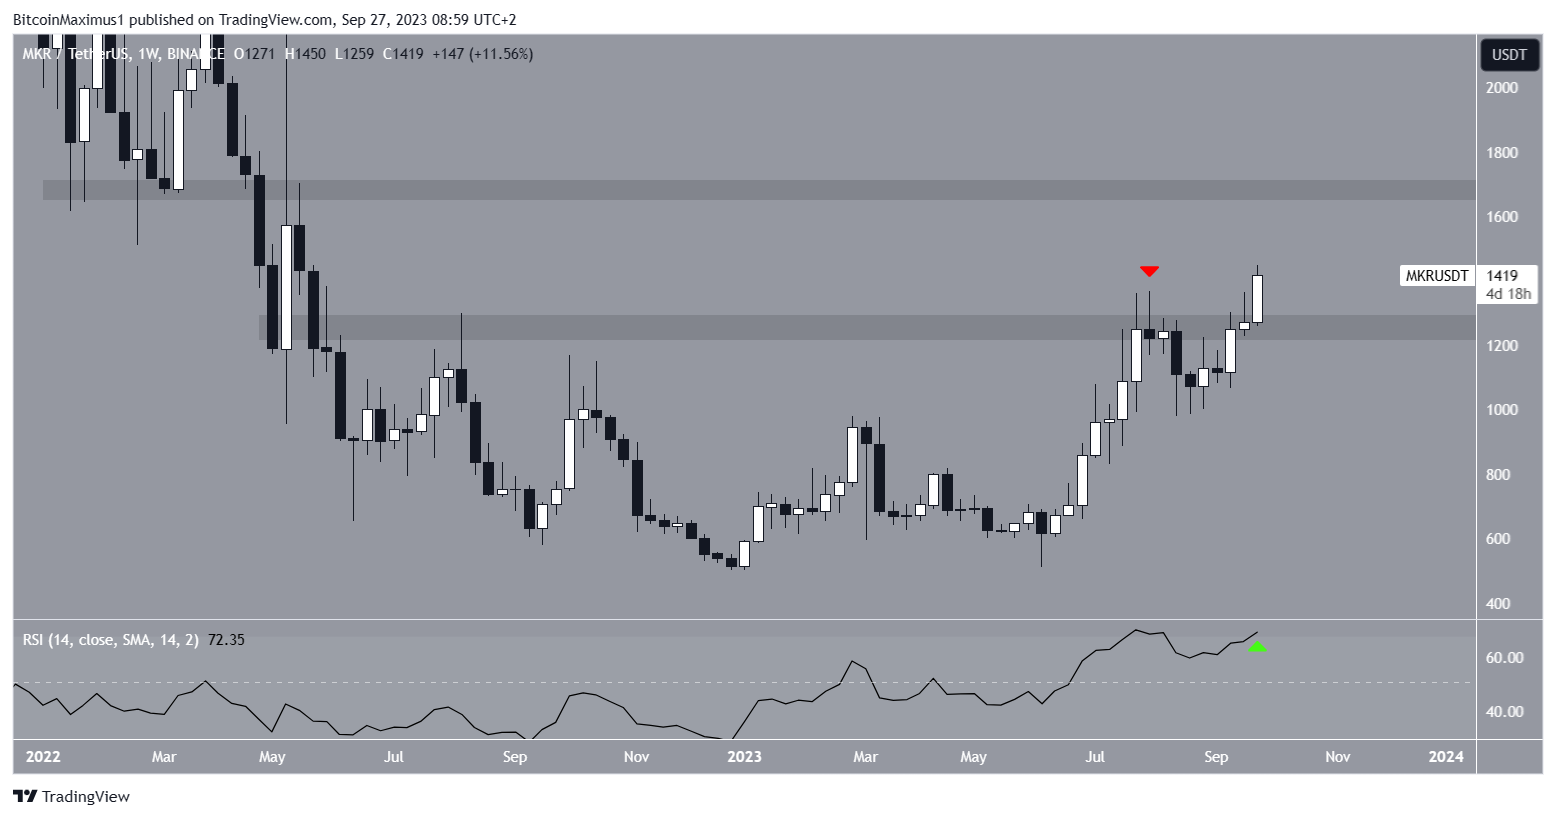
The weekly RSI provides a bullish outlook. Traders frequently employ the RSI as a momentum indicator to gauge whether a market is overbought or oversold, aiding in the decision-making process for buying or selling an asset.
If the RSI reading is above 50 and the trend is upward, bulls still have an advantage, but if the reading is below 50, the opposite is true.
The RSI is increasing and is above 50, both signs of a bullish MKR price analysis. While the indicator is nearing overbought territory, it has not generated any bearish divergence yet.
A bearish divergence occurs when a price increase is combined with a momentum decrease. It often leads to bearish trend reversals.
MKR Price Prediction: Another Yearly High Before Local Top
According to the Fibonacci retracement levels theory, following a significant price change in one direction, the price is expected to partially return to a previous price level before continuing in the same direction. This theory can also be used to identify the peak of future upward movements.
Using a Fib retracement on the most recent portion of the decrease, the next resistance is at $1,615. Combining this with the readings from the weekly timeframe, we have a strong resistance area between $1,615-$1,650, 15% above the current price.
A sudden loss of momentum could cause a retest of the minor $1,350 horizontal support area, 5% below the current price. This would not invalidate the bullish MKR price forecast but could be a temporary setback before the price moves to new highs.
The daily RSI is above 50 and increasing, supporting the continuing increase.
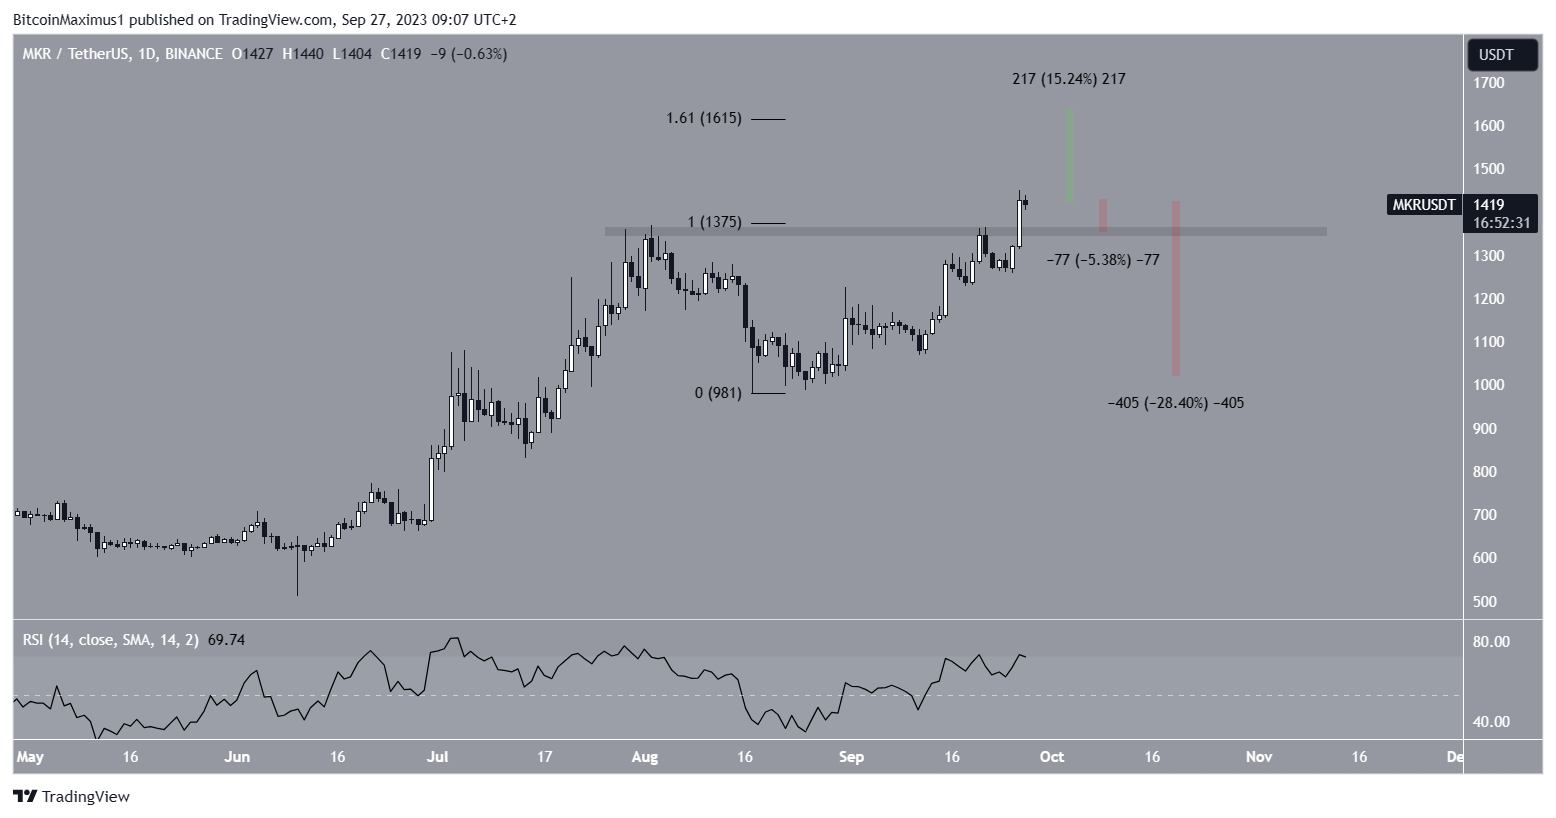
Despite this bullish MKR price prediction, a close below the $1,350 horizontal area in the daily timeframe will mean that the local top is in.
In that case, the price could fall by nearly 30% and reach the $1,000 support.
Read More: 9 Best Crypto Demo Accounts For Trading
For BeInCrypto’s latest crypto market analysis, click here.
Disclaimer
In line with the Trust Project guidelines, this price analysis article is for informational purposes only and should not be considered financial or investment advice. BeInCrypto is committed to accurate, unbiased reporting, but market conditions are subject to change without notice. Always conduct your own research and consult with a professional before making any financial decisions. Please note that our Terms and Conditions, Privacy Policy, and Disclaimers have been updated.
