


The Polygon (MATIC) price broke out from a 780-day descending resistance trend line but trades inside horizontal resistance.
MATIC has nearly reached its December 2023 high at $1.10. Will it break out and accelerate its increase?
Polygon Breaks Out from Long-Term Resistance
The weekly time frame technical analysis shows the MATIC price broke out from a 780-day descending resistance trend line two weeks ago. Before, the trend line had existed since the all-time high. Today, MATIC reached a high of $1.08, slightly below the December 2023 high.
It is worth mentioning that despite the breakout from the long-term trend line, MATIC still trades inside a long-term horizontal resistance area.
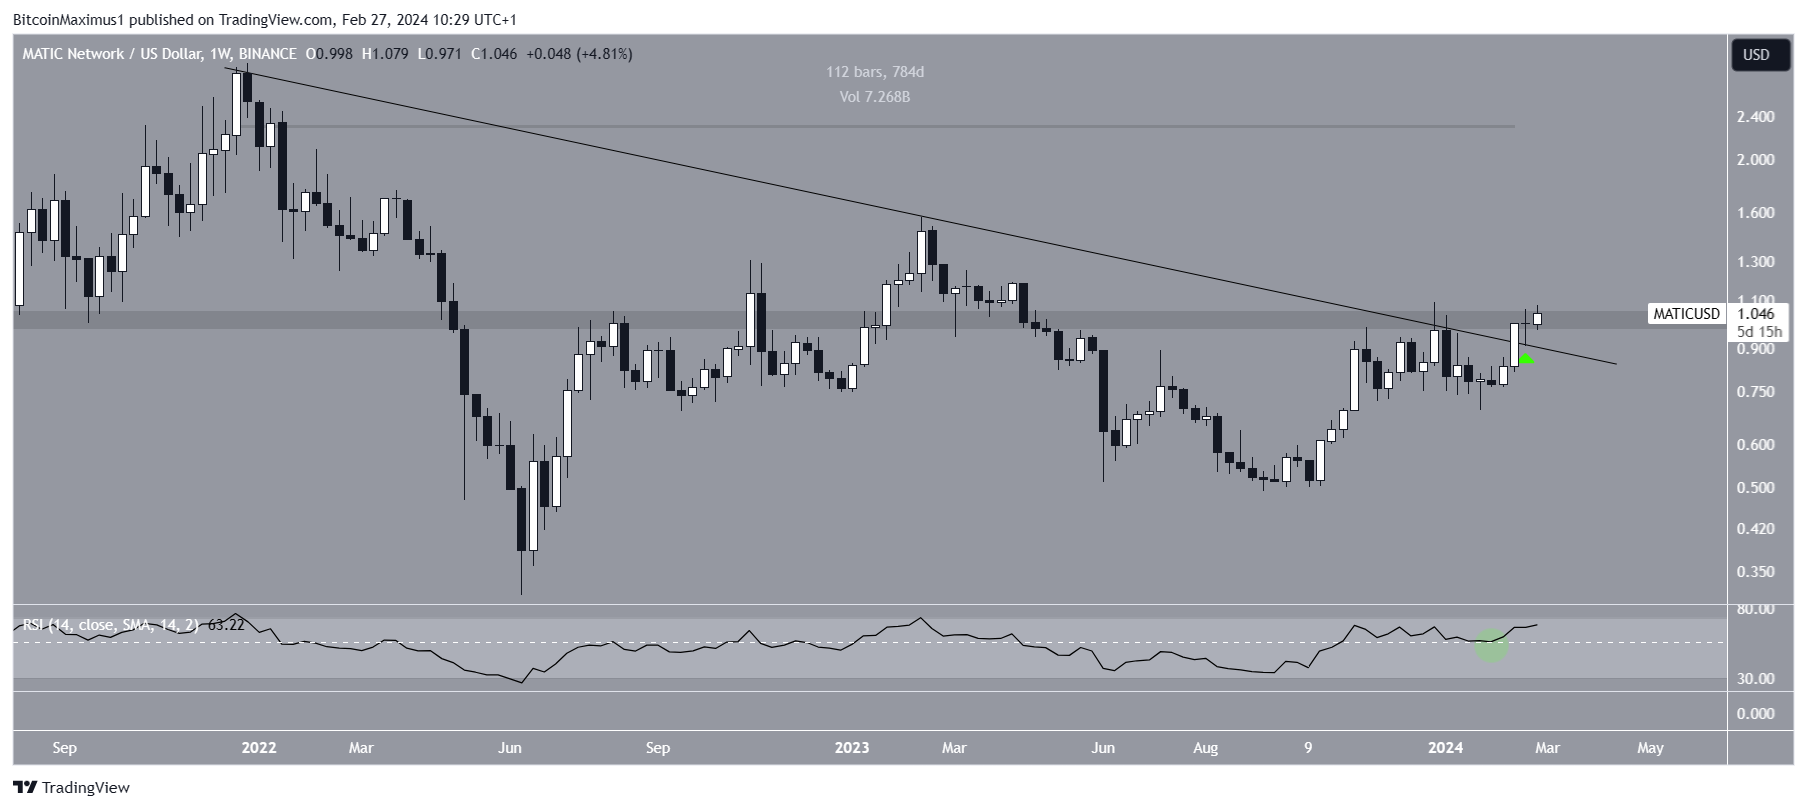
The weekly Relative Strength Index (RSI) supports the breakout. When evaluating market conditions, traders use the RSI as a momentum indicator to determine whether a market is overbought or oversold and whether to accumulate or sell an asset.
If the RSI reading is above 50 and the trend is upward, bulls still have an advantage, but if the reading is below 50, the opposite is true. The indicator bounced at 50 (green circle) during the breakout, indicating a bullish trend.
Read More: Polygon (MATIC) Price Predictions
MATIC Price Prediction: Is $1.50 the Next Stop?
Like the weekly time frame, the daily one also gives a bullish reading because of the price action and wave count.
The price action shows that MATIC broke out from the $0.95 horizontal area and validated it as support (green icon) on February 21. The wave count validates the upward movement. Technical analysts utilize the Elliott Wave theory to ascertain the trend’s direction by studying recurring long-term price patterns and investor psychology.
Read More: 14 Best Polygon (MATIC) Wallets in 2024
The most likely count suggests that the MATIC price is in wave three in a five-wave upward movement. Giving waves one and three the same length leads to a high of $1.54, nearly 50% above the current price. However, the daily RSI shows weakness in the form of a bearish divergence.
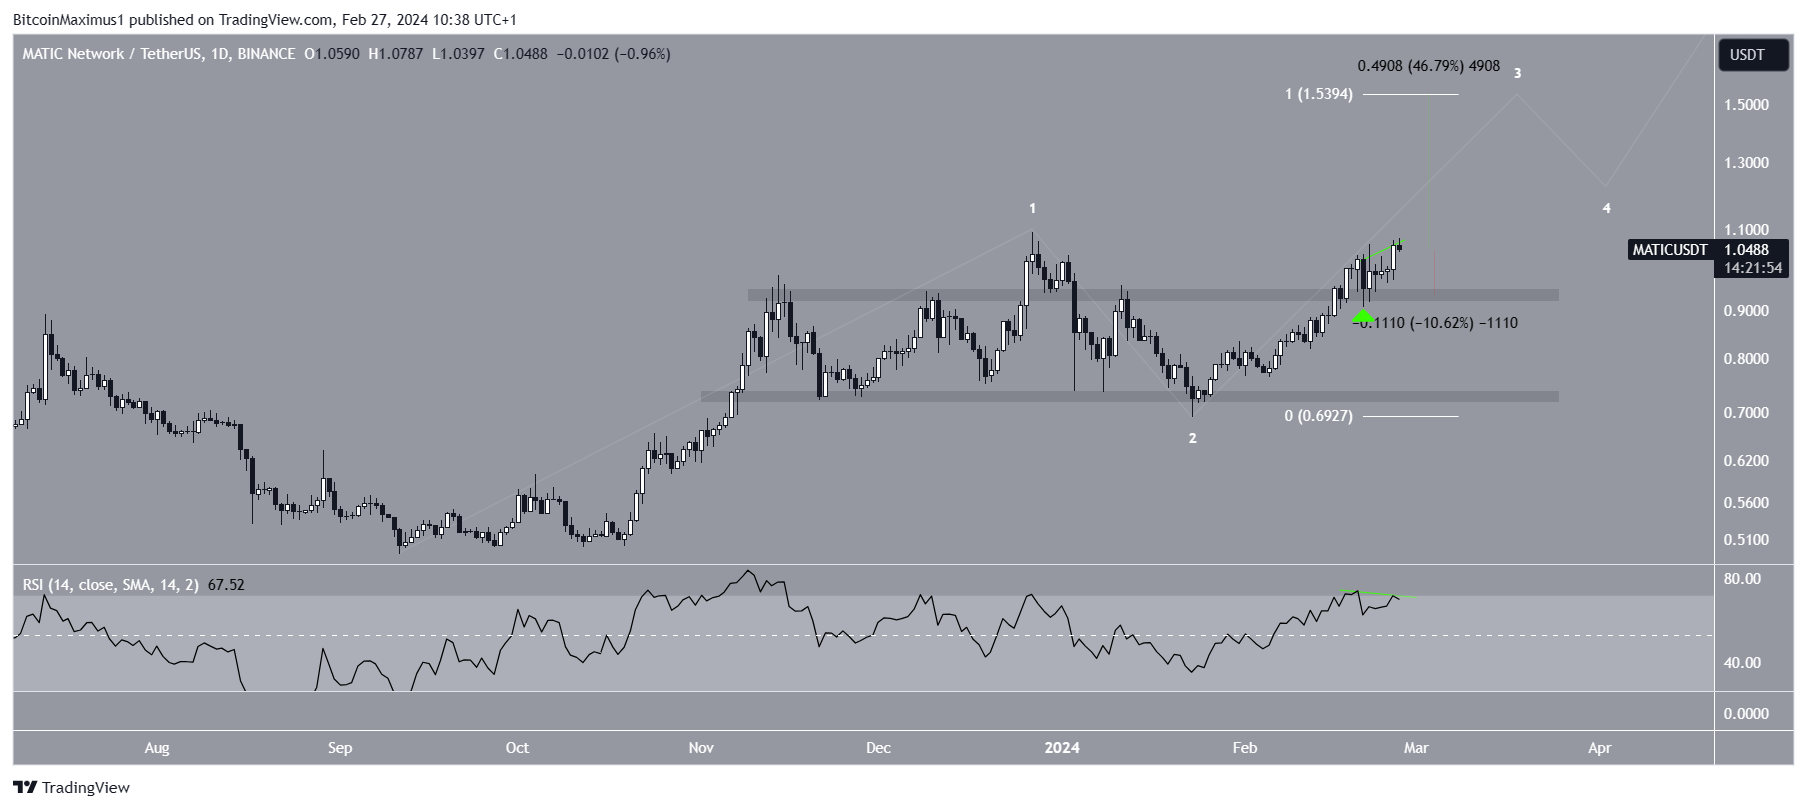
Despite this bullish MATIC price prediction, the MATIC price can fall 10% to the $0.95 horizontal support area if the bearish divergence plays out. However, this will not invalidate the bullish count but rather be a temporary decrease before the upward movement resumes.
For BeInCrypto‘s latest crypto market analysis, click here.


