


The Polygon (MATIC) price broke out from a descending resistance trend line that had existed for more than 780 days.
Is this the start of a new bullish cycle, or will MATIC fail to sustain the increase? Keep reading below to find out.
Polygon Finally Breaks Out
The weekly time frame technical analysis shows that the MATIC price broke out from a 780-day descending resistance trend line last week. The weekly close was the highest since April 2023.
While MATIC has fallen slightly since the breakout, it still retested the resistance trend line as support this week, a common movement after such breakouts.
Despite breaking out from such a long-term diagonal resistance, the MATIC price has not yet broken out from the main horizontal resistance area, which has existed as both support and resistance since July 2021.
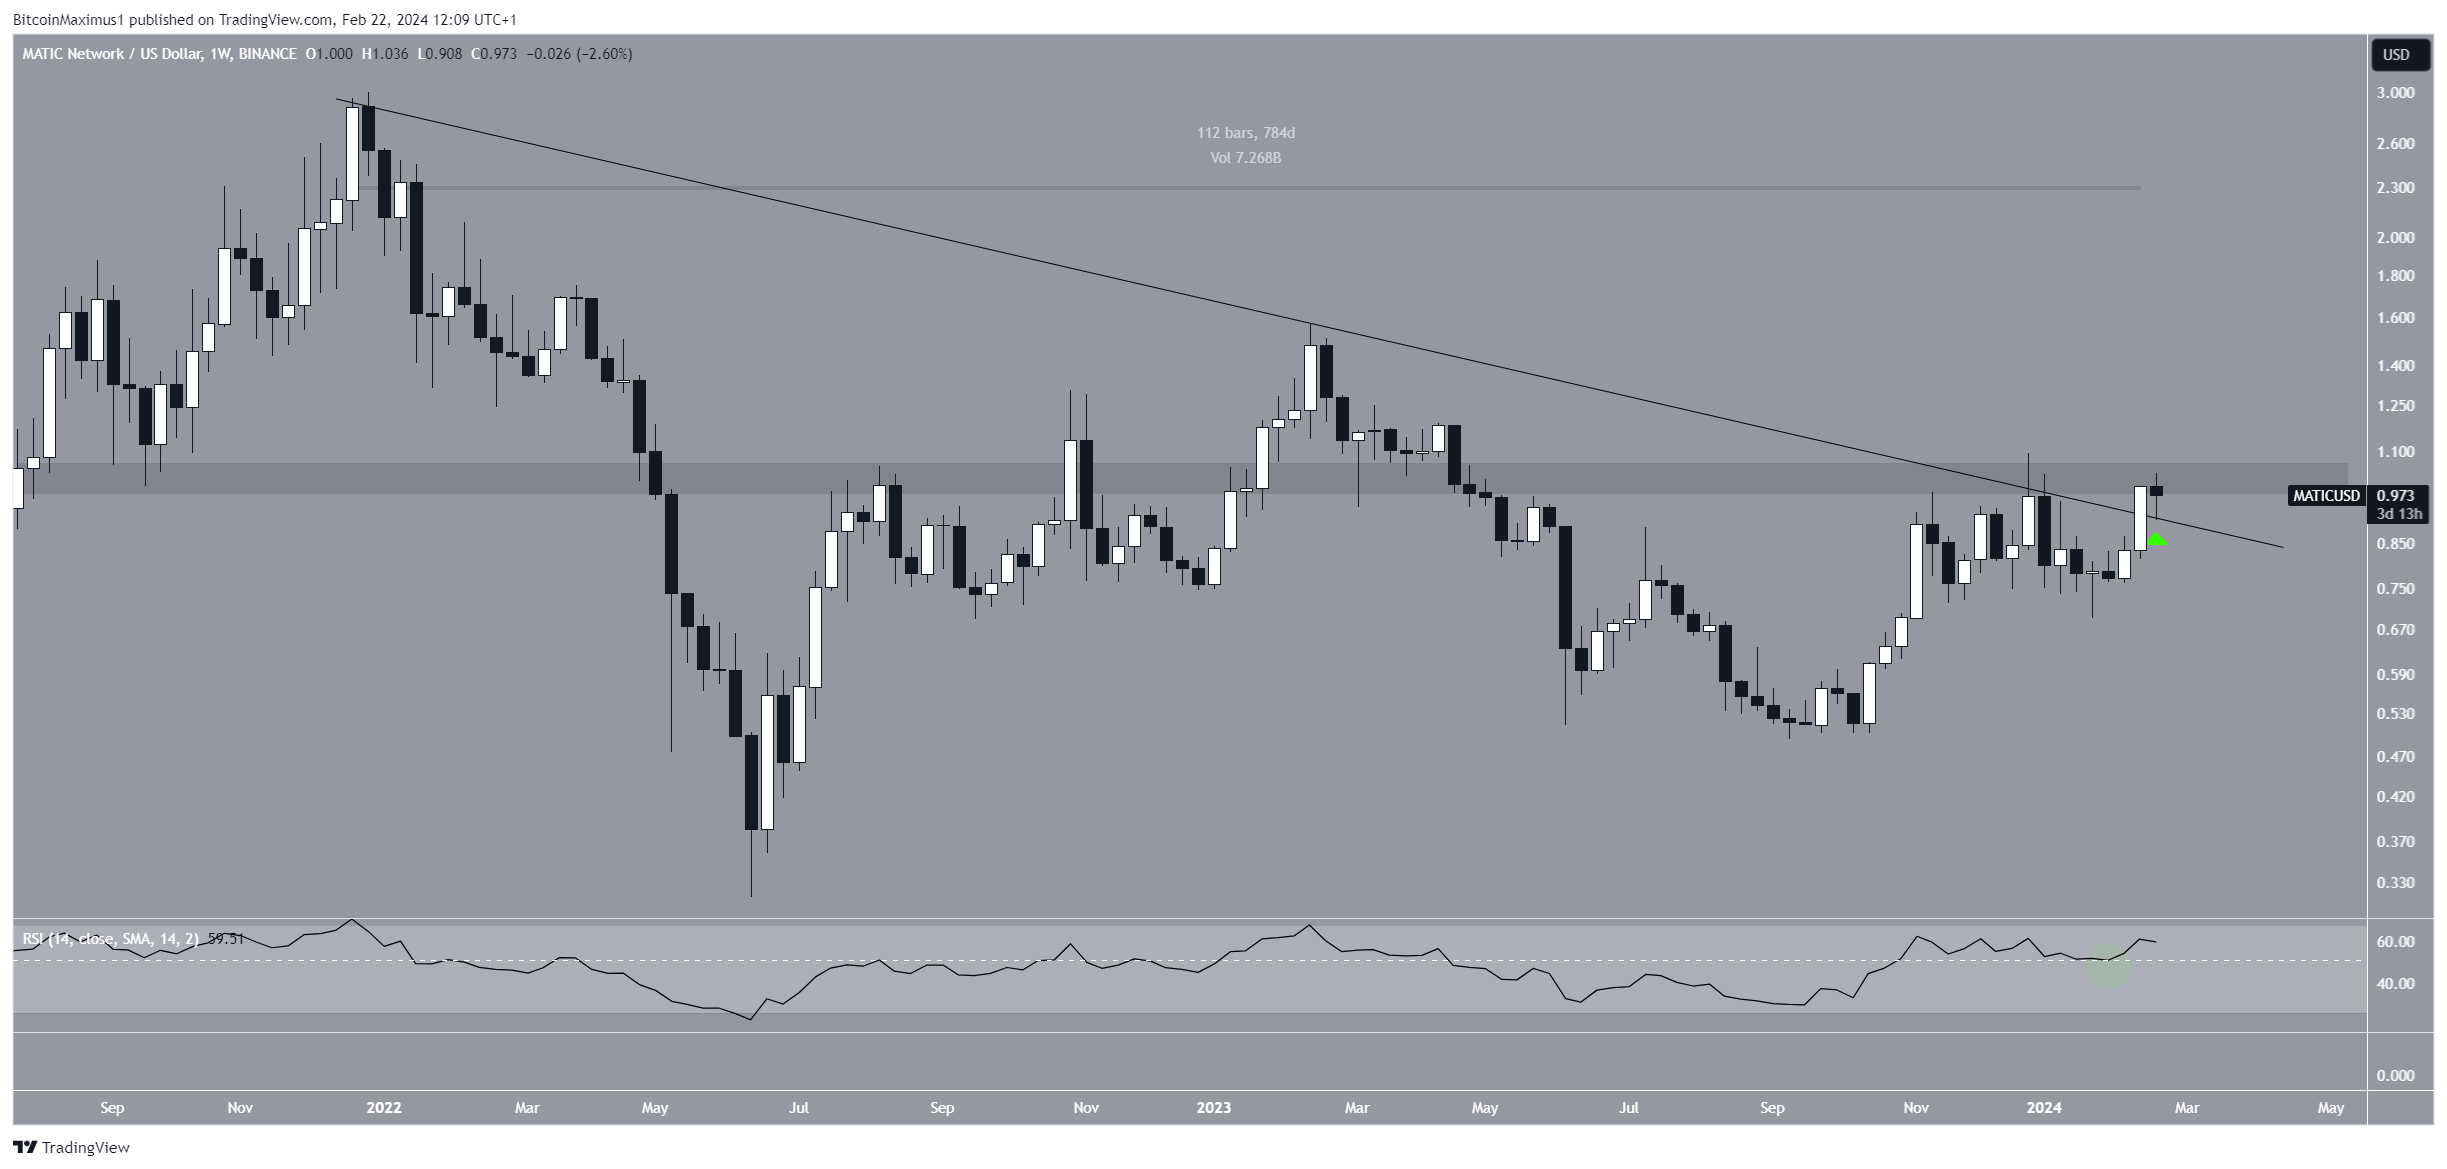
Nevertheless, the weekly Relative Strength Index (RSI) gives a bullish reading. When evaluating market conditions, traders use the RSI as a momentum indicator to determine whether a market is overbought or oversold and whether to accumulate or sell an asset.
If the RSI reading is above 50 and the trend is upward, bulls still have an advantage, but if the reading is below 50, the opposite is true. The indicator is above 50 and increasing, both signs of a bullish trend.
Read More: Polygon (MATIC) Price Predictions
MATIC Price Prediction: Is $1.50 Reachable?
The daily time frame technical analysis supports the bullish findings from the weekly one because of the price action, wave count, and RSI readings.
The price action shows that MATIC broke out from the top of its range at $0.95 and validated it as support (green icon). This movement was combined with a hidden bullish divergence in the daily RSI (green trend line), often leading to trend continuation.
Read More: 14 Best Polygon (MATIC) Wallets in 2024
The wave count predicts a continued increase well above $1. Technical analysts use the Elliott Wave theory to determine the direction of a trend, which involves studying recurring long-term price patterns and investor psychology.
The most likely count suggests the MATIC price is in wave three of a five-wave upward movement. Giving wave three the same length as wave one will lead to a high of $1.55, 60% above the current price.
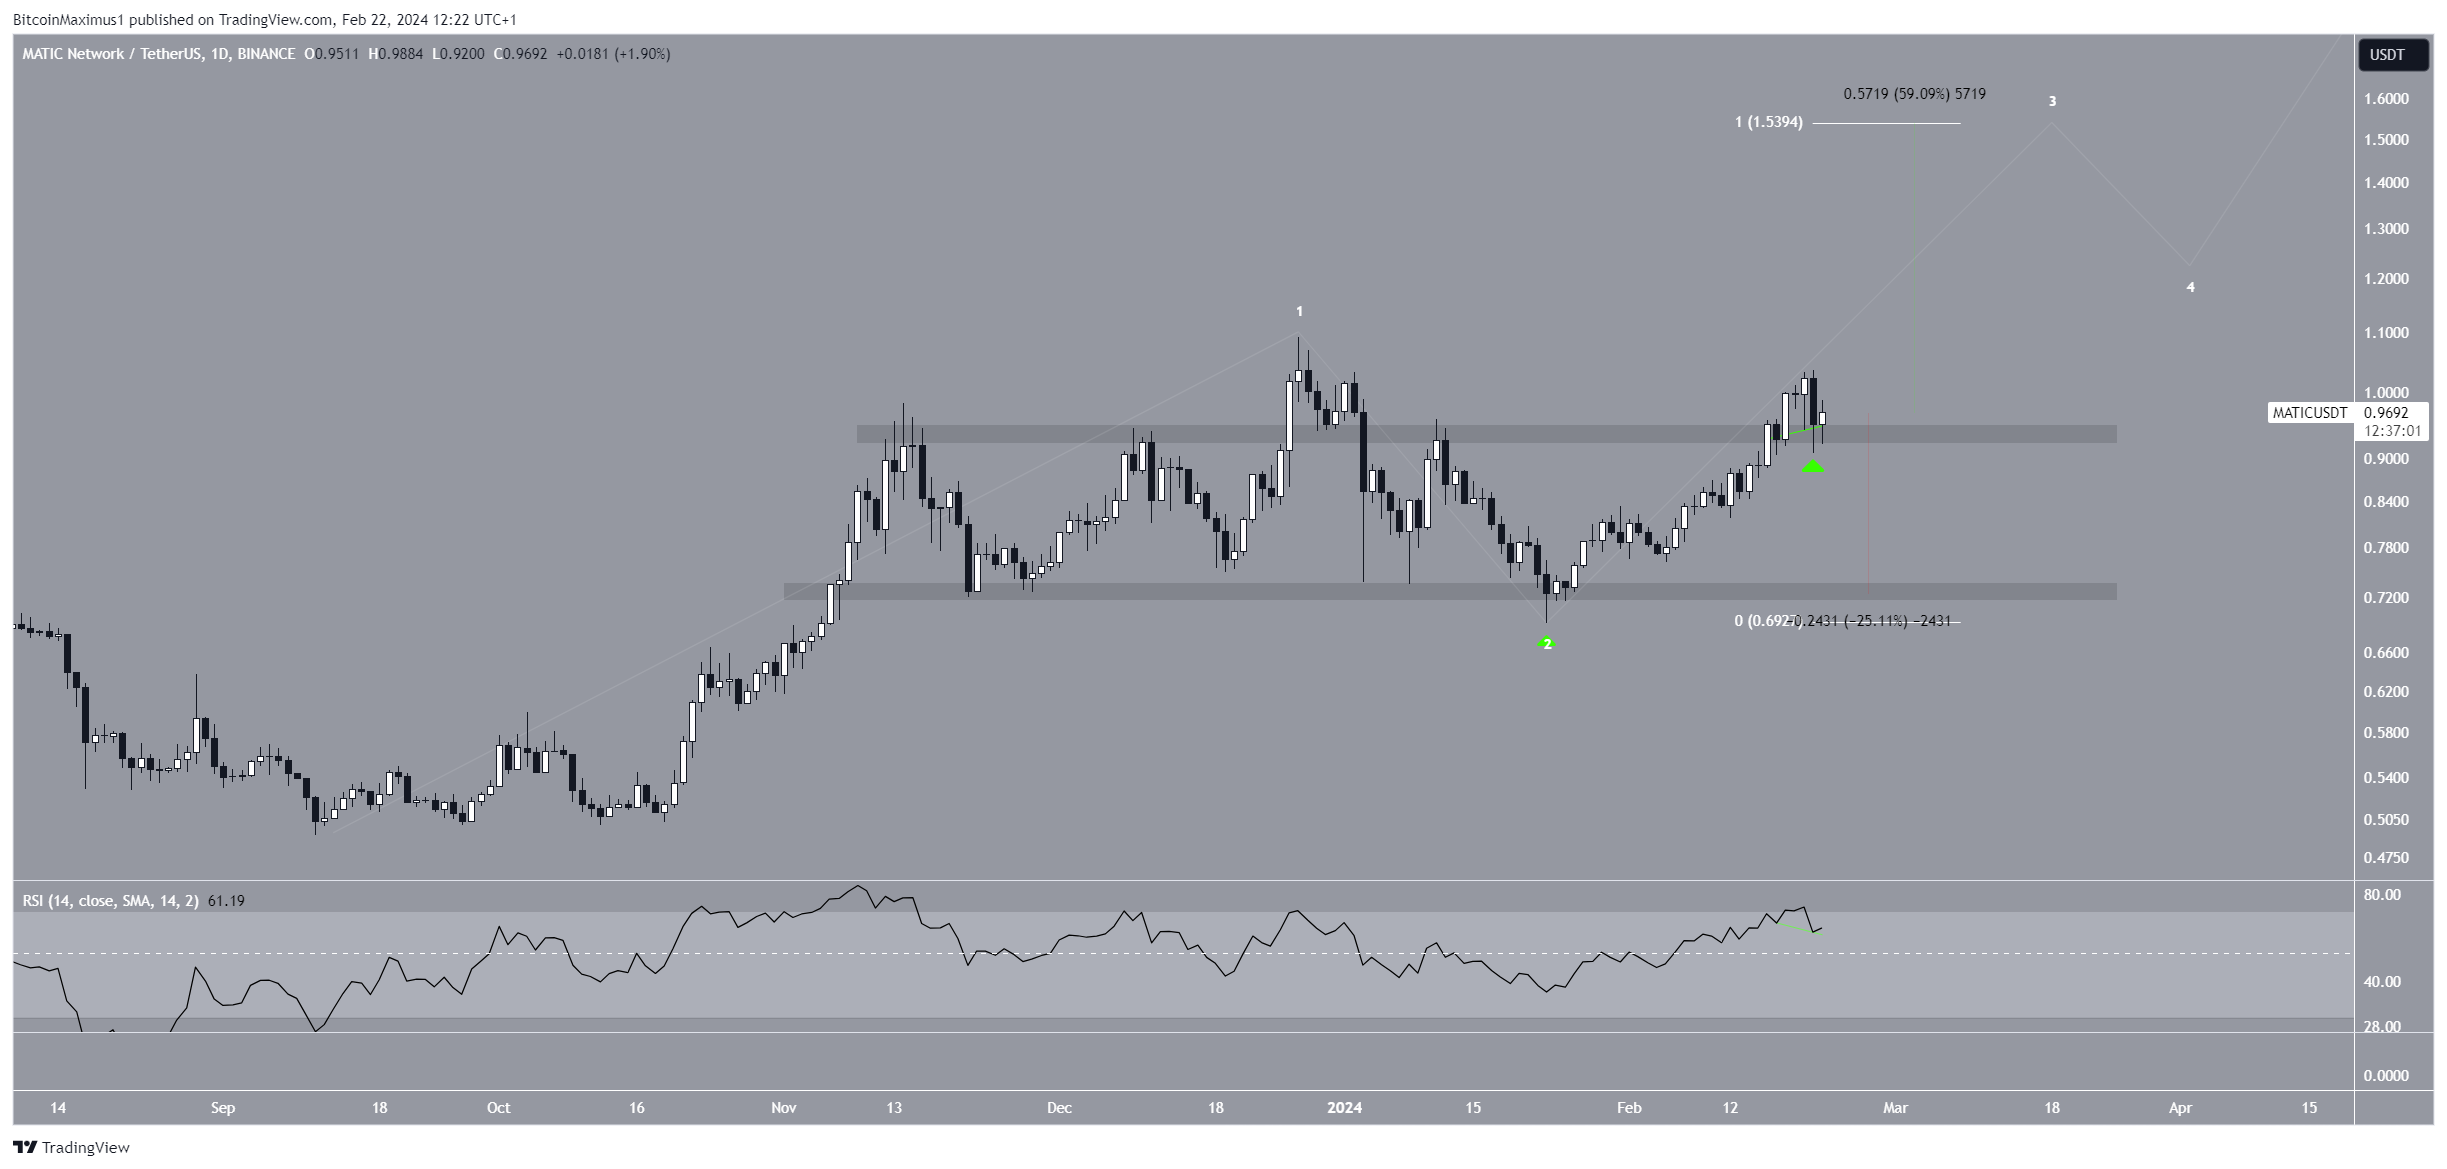
Despite the bullish MATIC price prediction, a daily close below $0.95 will mean the local top is in. Then, MATIC can fall 25% to the closest support at $0.74.
For BeInCrypto‘s latest crypto market analysis, click here.


