


The Polygon (MATIC) price has reached a long-term descending resistance trend line that has existed for nearly 800 days.
MATIC also reached the top of its short-term horizontal range. Can it break out and reach $1 next?
Will Polygon Finally Break Out?
The technical analysis of the weekly time frame shows the MATIC price has fallen under a long-term descending resistance trend line since the start of 2022.
The decrease led to a low of $0.32 in June 2022 before MATIC began an upward movement. The resistance trend line has been validated four times until now (red icons), most recently this week. So far, it has been in place for nearly 800 days.
Cryptocurrency trader CryptoFaibik believes the MATIC price will increase by more than 600% once it breaks out from this long-term resistance.
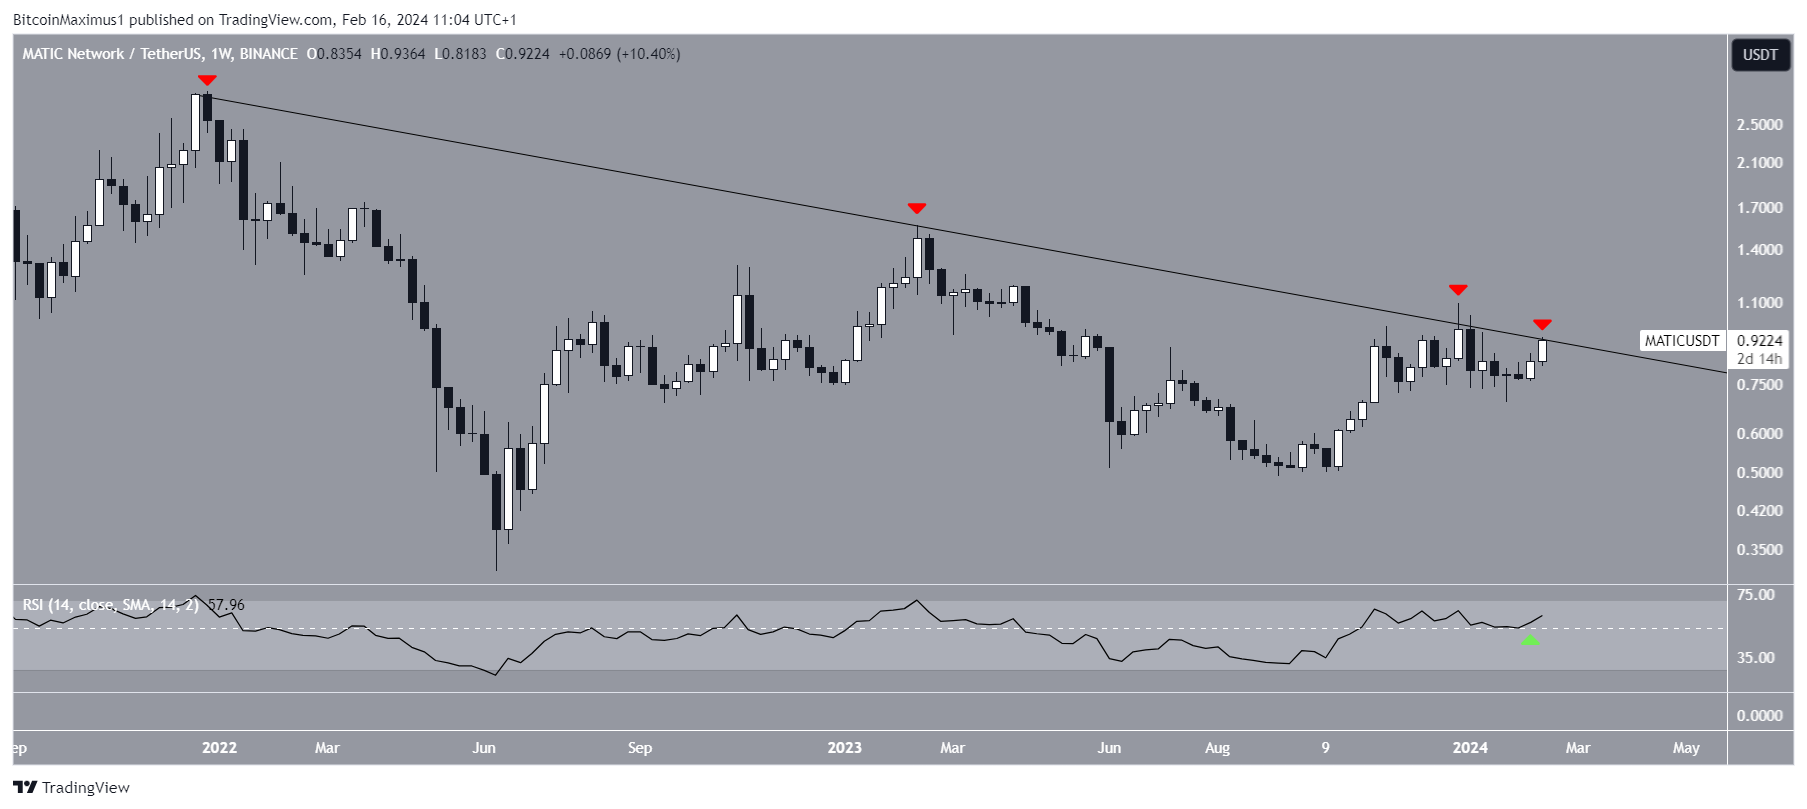
The weekly Relative Strength Index (RSI) gives a bullish reading. When evaluating market conditions, traders use the RSI as a momentum indicator to determine whether a market is overbought or oversold and whether to accumulate or sell an asset.
If the RSI reading is above 50 and the trend is upward, bulls still have an advantage, but if the reading is below 50, the opposite is true. The indicator bounced at 50 (green icon) and is moving upward, both signs of a bullish trend.
Read More: How to Buy Polygon (MATIC)
MATIC Price Prediction: $1 Incoming?
The daily time frame chart gives a bullish outlook because of the price action, RSI readings, and wave count.
The price action shows MATIC has increased since January 23, when it bounced at its range low (green icon). It has reached the range high of $0.93.
The daily RSI legitimizes this increase since it is above 50 and moving upwards (green circle).
Finally, the wave count supports the ongoing breakout. Elliott Wave theory involves the analysis of recurring long-term price patterns and investor psychology to determine the direction of a trend.
The most likely count suggests MATIC is in wave three of a five-wave upward movement. Wave three is usually the sharpest of the five waves, which would align with a breakout from the long-term descending resistance trend line.
Giving waves one and three a 1:1 ratio will lead to a high of $1.54, 65% above the current MATIC price.
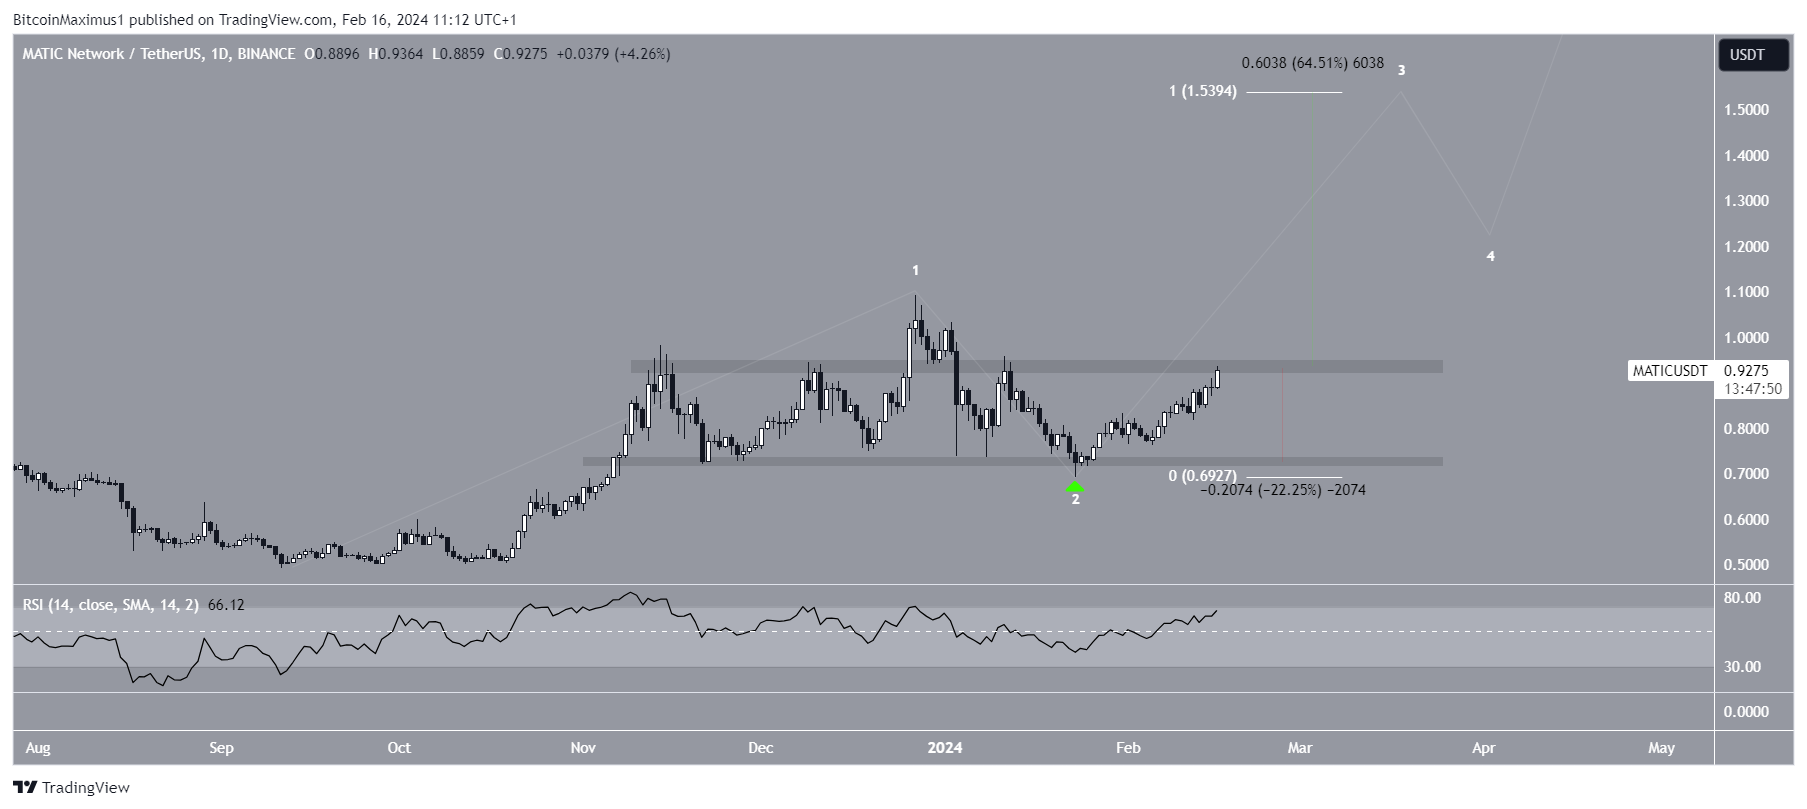
Despite this bullish MATIC price prediction, failure to break out from the $0.93 resistance area can trigger a 20% drop to the closest support at $0.73.
Read More: 14 Best Polygon (MATIC) Wallets


