


The Polygon (MATIC) price has traded above a long-term horizontal support area since breaking out in November 2023.
MATIC also broke out from a short-term descending resistance trend line but failed to clear a Fib resistance level.
Polygon Consolidates Above Support
The weekly time frame chart shows that MATIC has increased since October 2023. The price broke out from a horizontal resistance area the next month, culminating with a new yearly high of $1.09 in December.
While MATIC has fallen since, it still trades above the horizontal area, which now acts as support. MATIC bounced in January 2024, creating a long lower wick (green icon). Despite the bounce, the price trades below a long-term descending resistance trend line existing for 780 days.
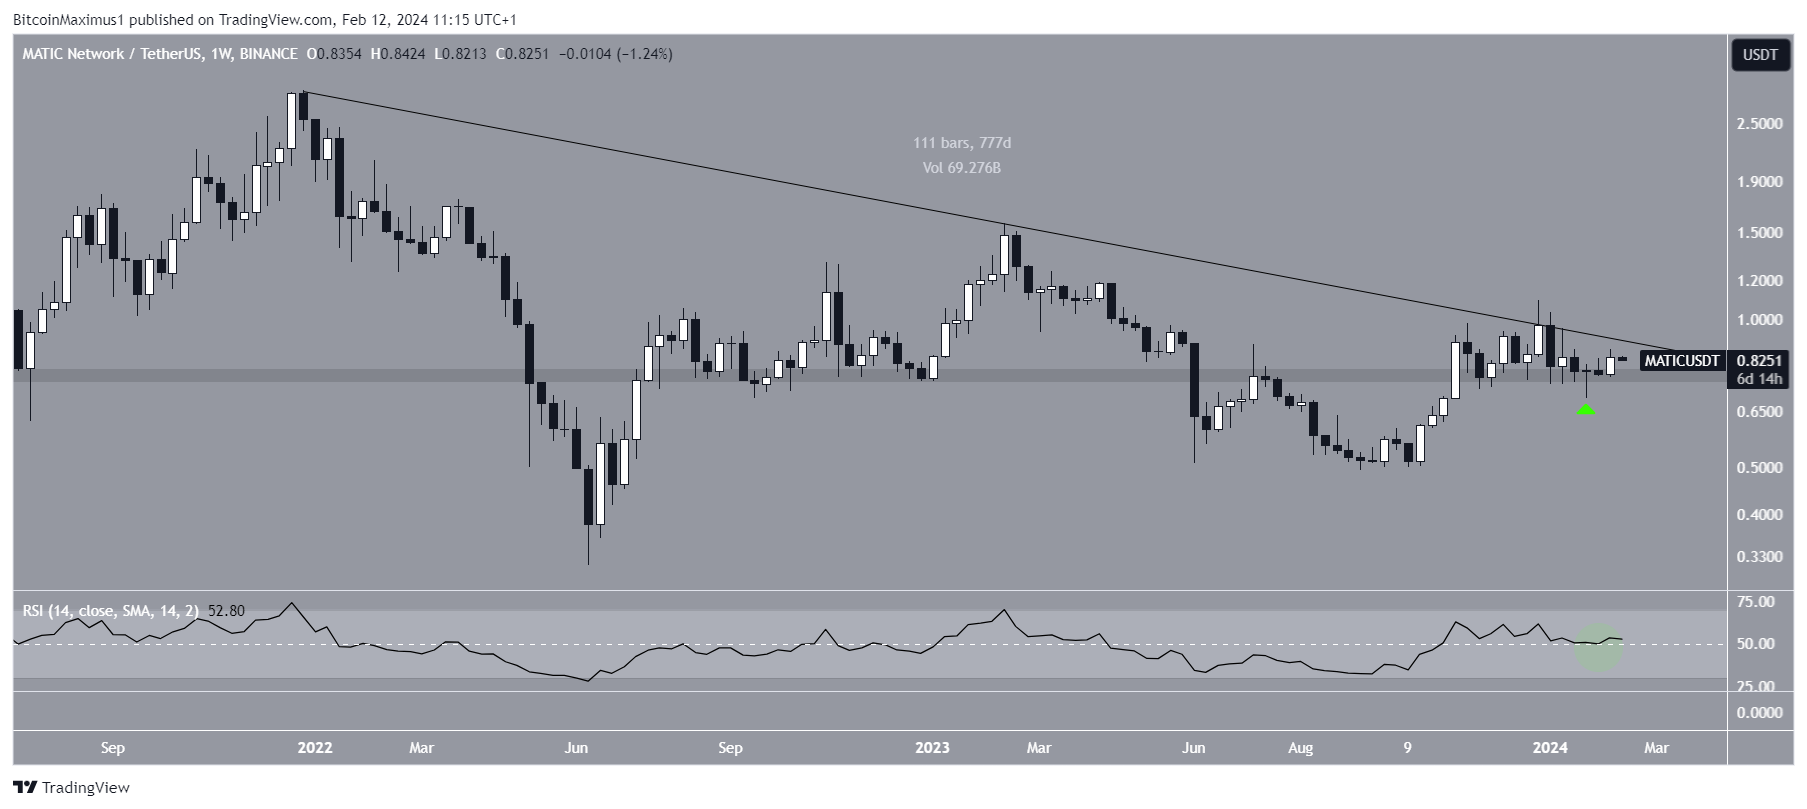
The weekly Relative Strength Index (RSI) gives a bullish reading since it is above 50 (green circle). Traders utilize the RSI as a momentum indicator to assess whether a market is overbought or oversold and whether to accumulate or sell an asset.
If the RSI reading is above 50 and the trend is upward, bulls still have an advantage, but if the reading is below 50, the opposite is true.
Read More: How to Buy Polygon (MATIC)
MATIC Price Prediction: Has the Reversal Started?
While the weekly time frame leans bullish, the daily one is undetermined.
The chart shows that MATIC has increased since January 23, breaking out from a descending resistance trend line five days later. The breakout led to a high of $0.87 on February 10.
ColdBloodShill believes that despite being at resistance, MATIC will soon break out.
Is $MATIC doing that thing where it’s like “haha im so weak at resistance oooh please short me” then BAM it hits the upside, ColdBloodShill commented.
However, MATIC was rejected by the 0.382 Fib retracement resistance level and has fallen since. This caused the RSI to decrease, nearly taking it below 50.
Because of the mixed readings, the reaction to the 0.382 Fib retracement resistance will be key in determining the future trend.
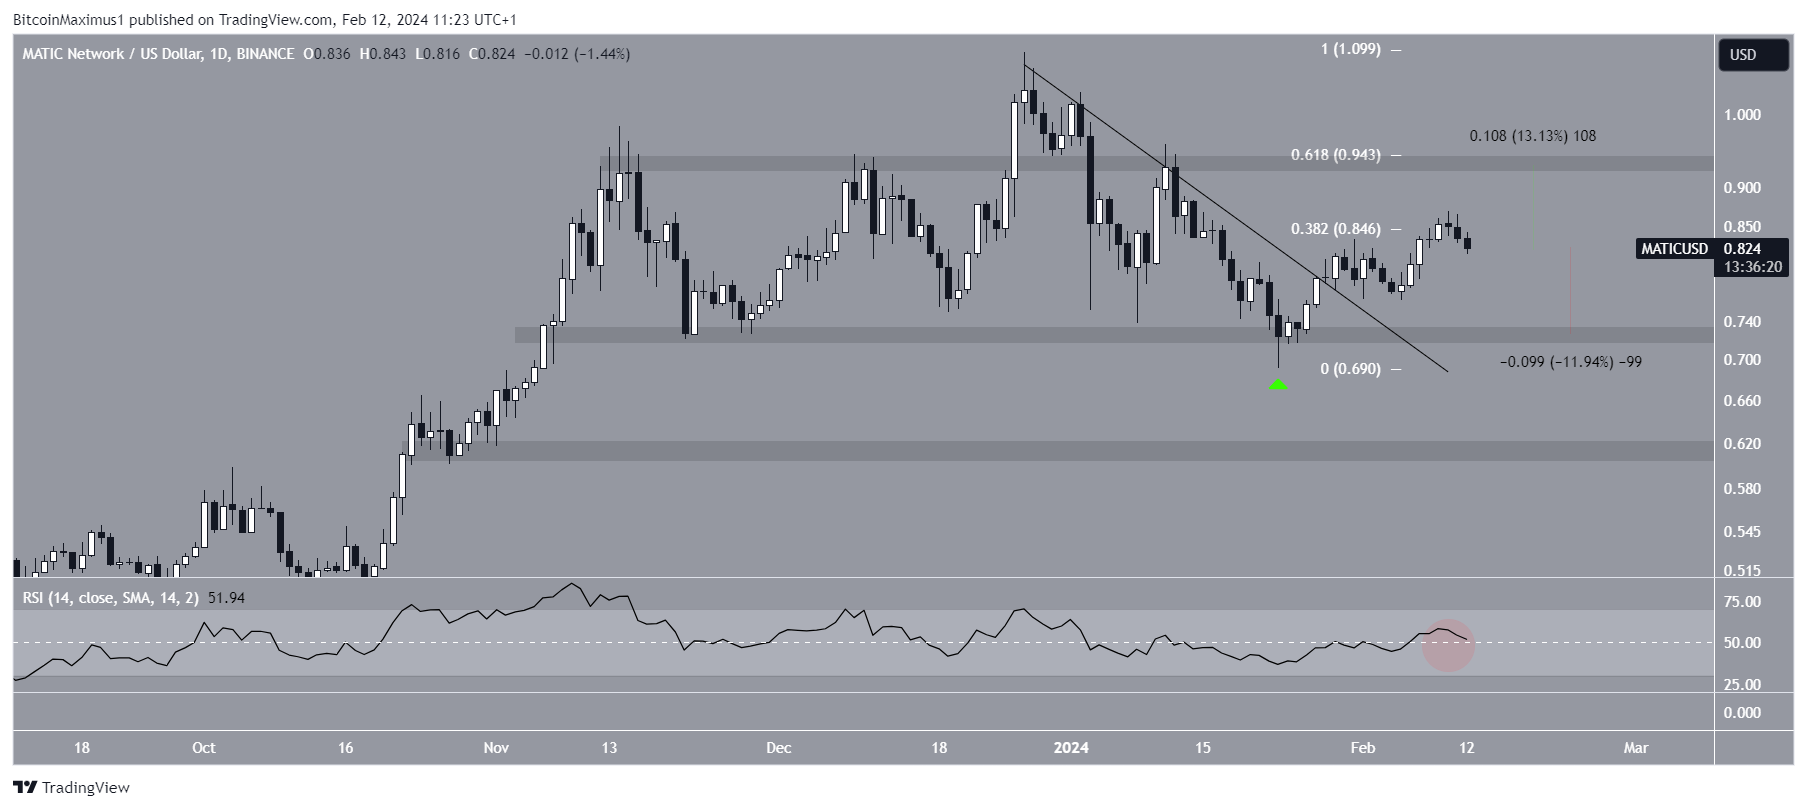
A MATIC breakout can trigger a 13% increase to the next resistance at $0.92, while a rejection can cause a 12% drop to the closest support at $0.72.
For BeInCrypto‘s latest crypto market analysis, click here.


