


The Polygon (MATIC) price has increased slightly since September 11. It is attempting to break out from a long-term descending resistance trendline.
The resistance trendline has been in place since February and is crucial for determining the future trend’s direction.
Will Polygon Break Out From Resistance Trendline?
In the analysis of MATIC’s daily price movement, there is a descending resistance trendline in place since February 28. At that time, MATIC reached its highest point of the year at $1.57.
MATIC broke below the $0.60 support level during this period and confirmed it as a resistance on August 29 (red icon).
This rejection coincided with the last touch on the descending resistance trendline, confirming its validity in the process.
However, MATIC has since started attempting a breakout from this trendline. A successful breakout above could mean the correction is complete and the price has begun a new upward movement.
On the other hand, failure to break out will be a sign that the correction is still ongoing.
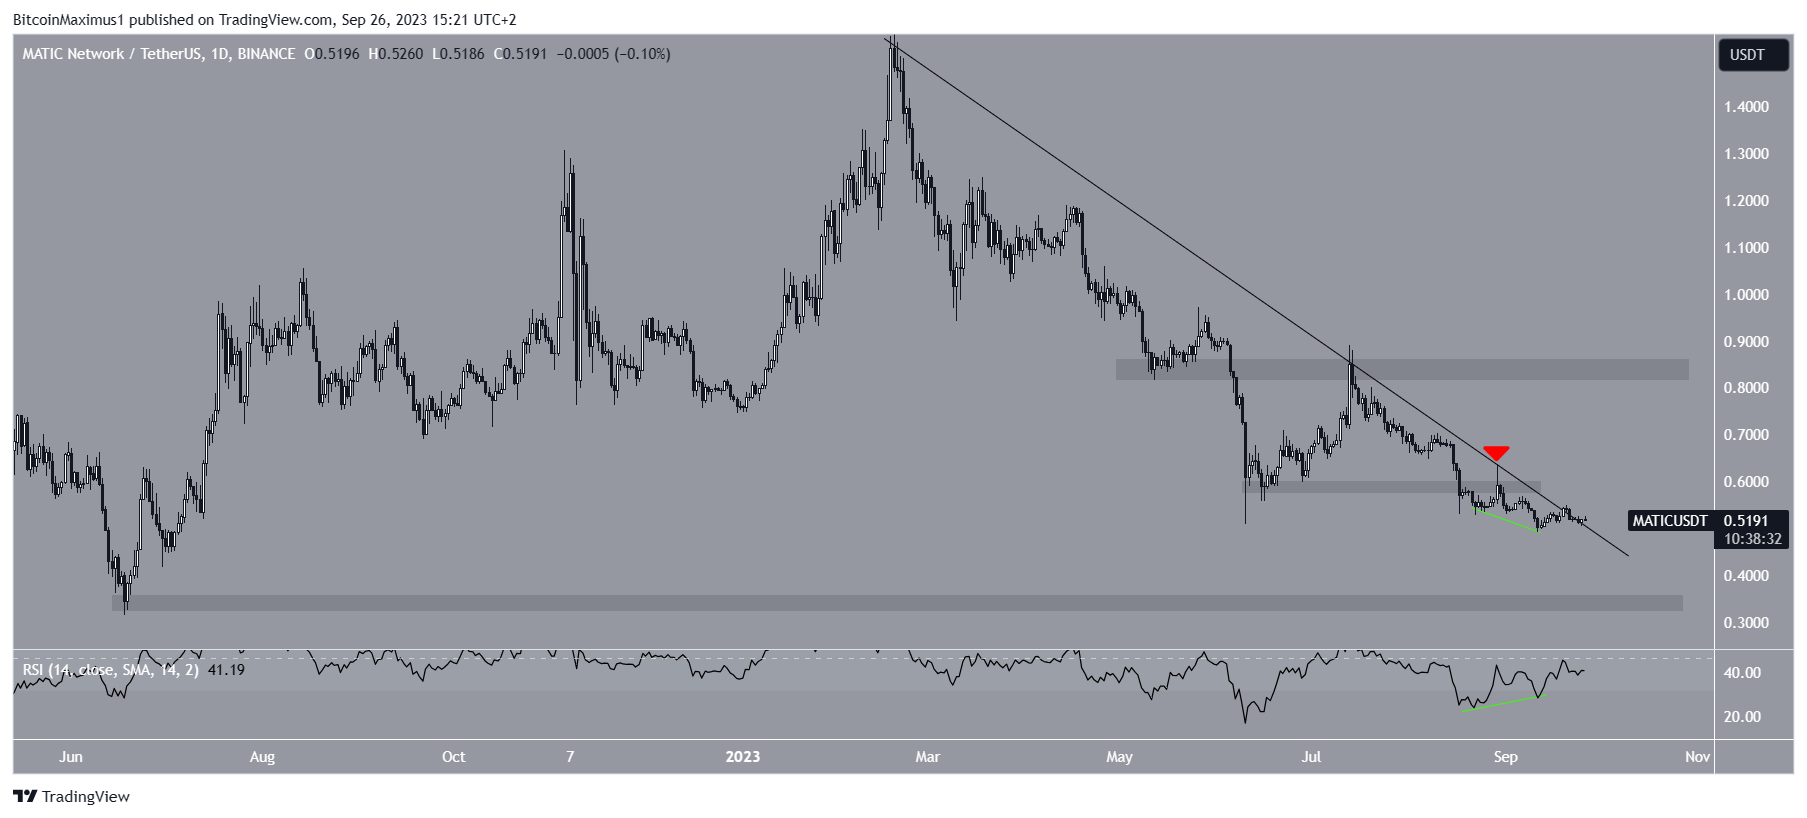
Despite the prevailing bearish sentiment in price action, the daily Relative Strength Index (RSI) shows signs of a potential shift towards a bullish trend.
The Relative Strength Index (RSI) is a favorite among traders for assessing momentum to guide their asset acquisition or disposal decisions. When in an uptrend, an RSI reading surpassing 50 is deemed optimistic for bullish traders; conversely, a reading beneath 50 is a bearish indicator.
Currently, the RSI is below 50 but is trending upwards. What’s more important is that it has displayed significant bullish divergence (illustrated by the green line).
This divergence occurs when an increase in momentum coincides with a decrease in price. Typically, it precedes bullish trend reversals.
Read More: Best Crypto Sign-Up Bonuses in 2023
MATIC Price Prediction: Corrective Pattern Supports Bottom
Similarly to the daily timeframe, the six-hour MATIC price movement provides an undetermined trend. However, the short-term timeframe is still more bullish than the daily one.
The main reason for this is the fact that the price is trading inside a descending parallel channel. These channels usually contain corrective movements, meaning that an eventual breakout from it is the most likely scenario.
Furthermore, the cryptocurrency is trading above the middle of the channel (green icon), another sign of a bullish trend.
However, the six-hour RSI does not confirm the possibility of a reversal. The indicator is below 50 (red circle), a sign of a bearish trend.
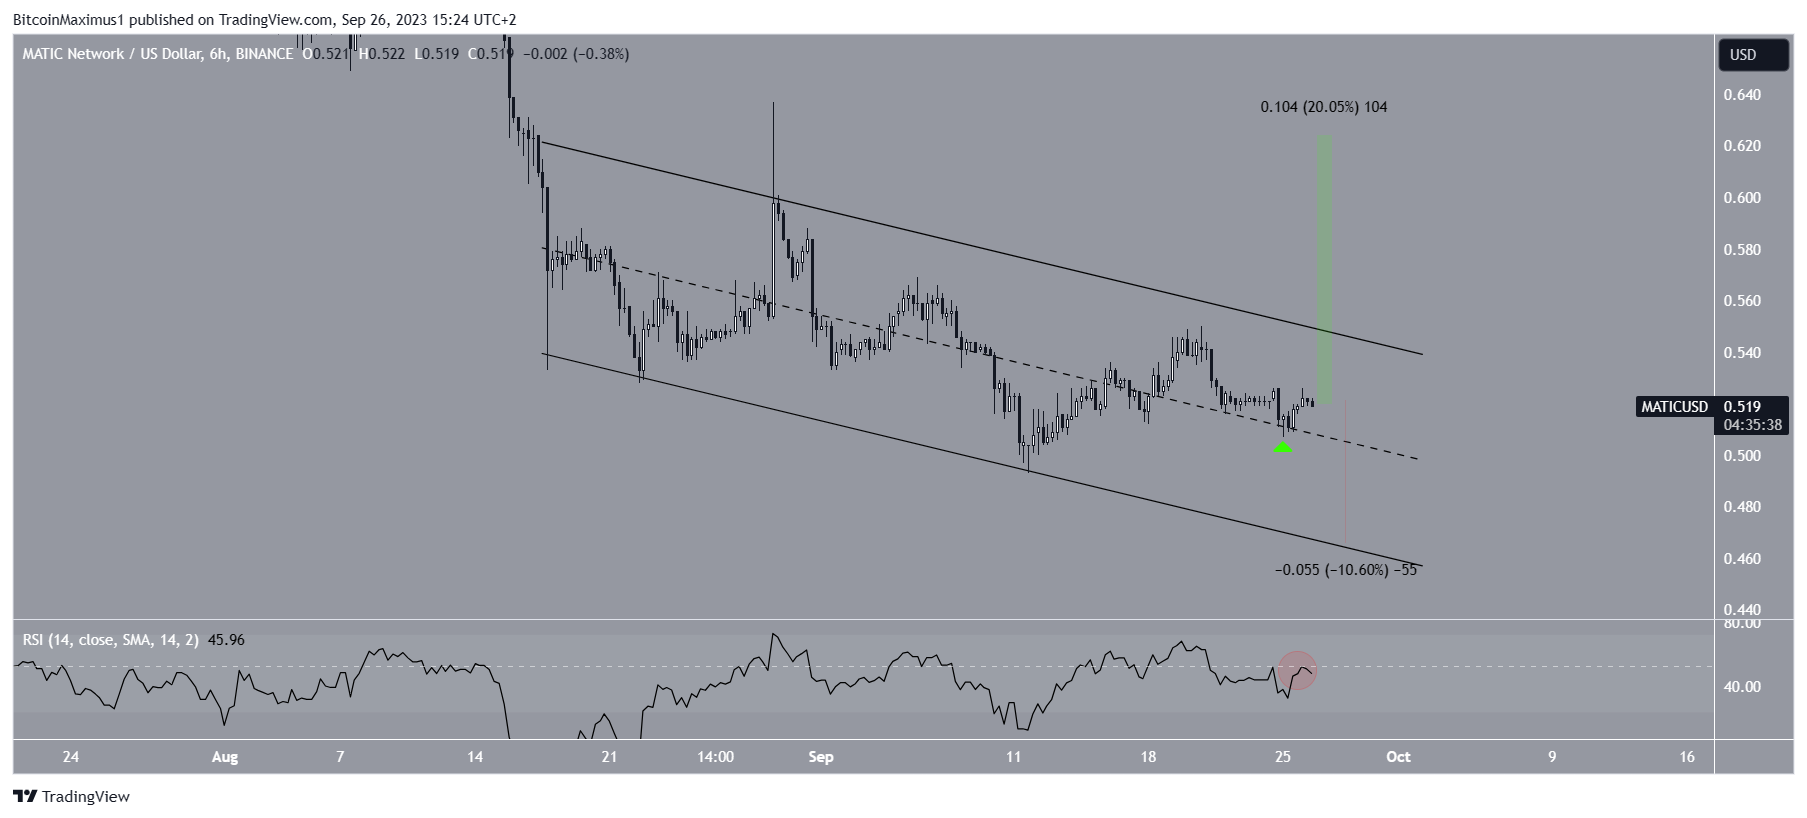
Therefore, the MATIC price prediction will determine whether the price breaks out from the descending resistance trendline or gets rejected.
A 20% increase to the $0.65 area is likely in case of a breakout.
However, a 10% drop to the channel’s support line at $0.46 could occur if the price gets rejected.
Interested in AI Trading? 9 Best AI Crypto Trading Bots to Maximize Your Profits


