


Litecoin’s (LTC) price trades above a long-term diagonal support level but inside a short-term bearish pattern.
The LTC price has traded devoid of significant volatility for nearly a year. How long will this trend continue?
Litecoin Hovers Above Support
The weekly time frame technical analysis shows that LTC has increased alongside an ascending support trend line since June 2022.
Since August 2023, the trend line has been validated six times (green icons), but the bounces did not initiate significant Litecoin upward movements. The trend line has existed for more than 620 days.
Additionally, the LTC price trades above a long-term horizontal support area.
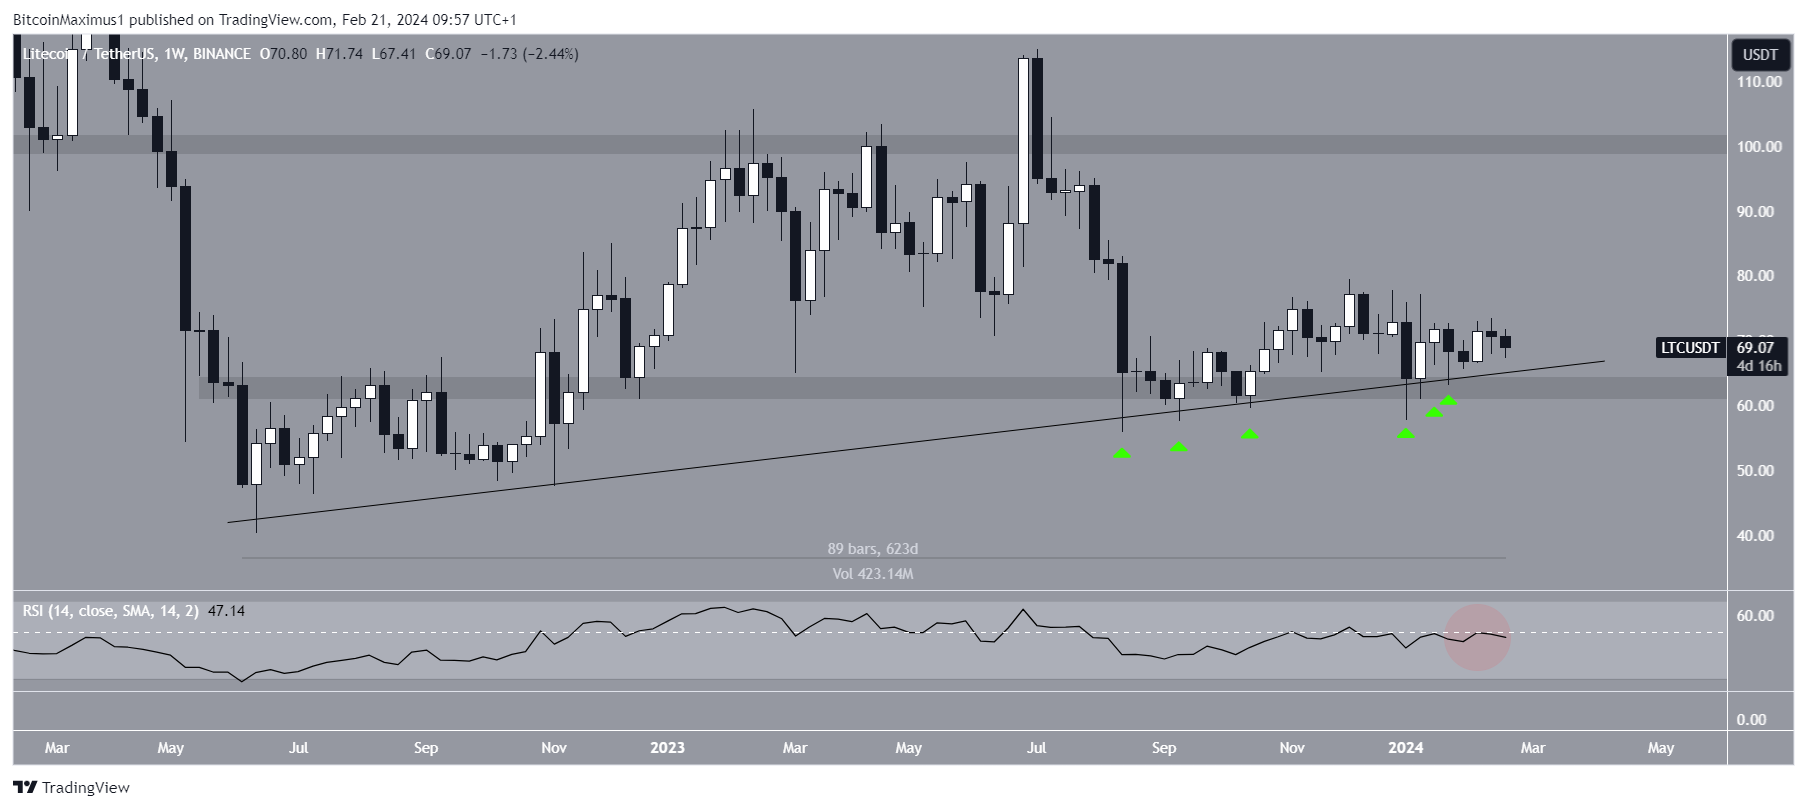
Similarly to the price action, the weekly Relative Strength Index (RSI) is undetermined. Market traders use the RSI as a momentum indicator to identify overbought or oversold conditions and to decide whether to accumulate or sell an asset.
Readings above 50 and an upward trend indicate that bulls still have an advantage, whereas readings below 50 suggest the opposite. The RSI is increasing but is below 50, a sign of an undetermined trend.
Read more: 7 Best Litecoin (LTC) Wallets
What Are Analysts Saying?
Cryptocurrency traders and analysts on X positively view the future LTC trend.
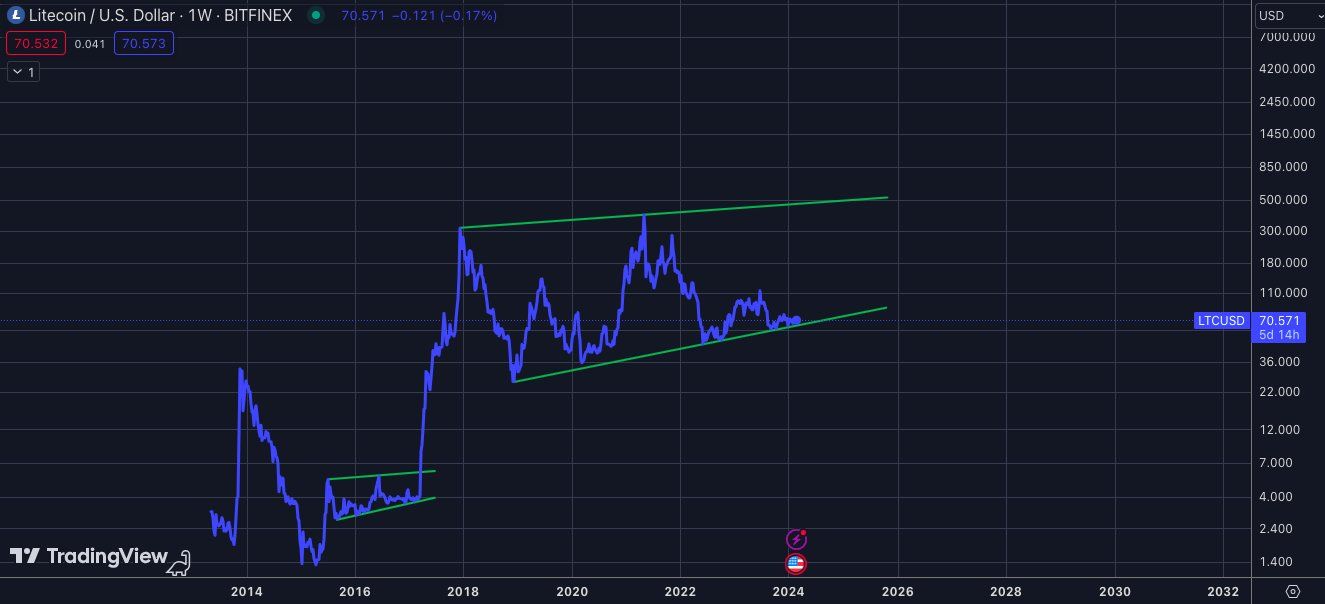
CryptoSurf tweeted a long-term fractal indicating the LTC price is just beginning its long-term bullish cycle.
NebraskanGooner suggests the LTC price can appreciate if it breaks above $72. CryptoMoneyKing gives a similar thought.
Read more: How To Buy Litecoin (LTC) in 4 Easy Steps
LTC Price Prediction: Is the Trend Still Bearish?
While the weekly time frame gives an undetermined reading, the daily chart leans bearish because of the LTC price action.
The movement since September 2023 has been contained inside an ascending parallel channel, a sign that the increase is corrective.
Furthermore, the significant overlap inside this pattern signifies a corrective increase. Finally, the LTC price trades in the channel’s lower portion, and the RSI falls below 50. If LTC breaks down from the channel, it can fall 15% to the next closest support at $58.
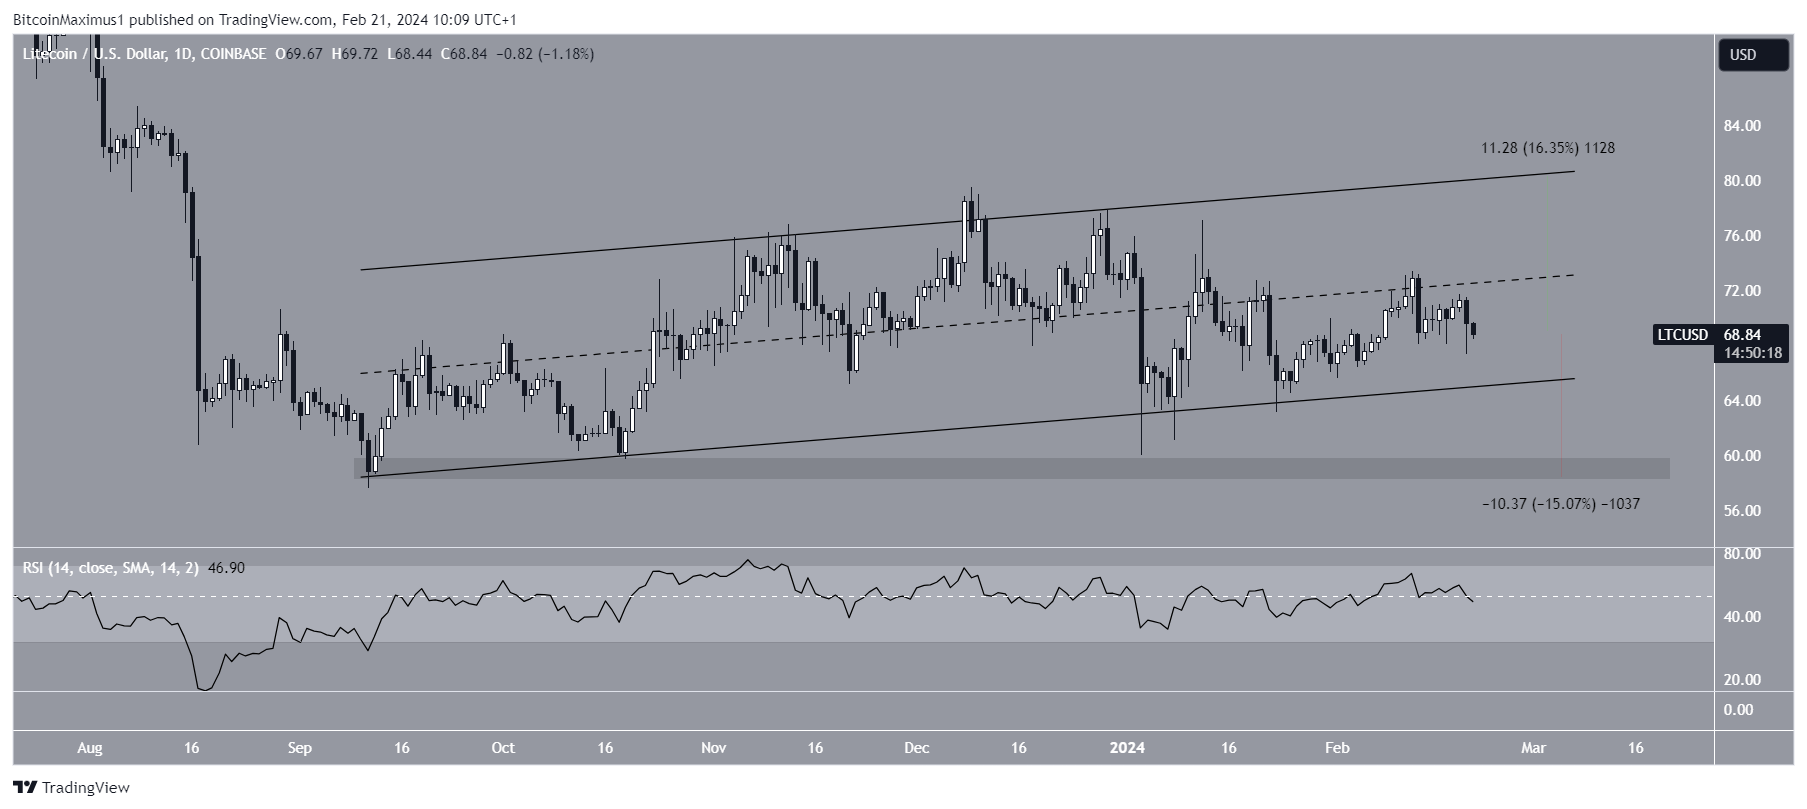
Despite this bearish LTC price prediction, moving above the channel’s midline can trigger a 16% increase to the resistance trend line at $80.
For BeInCrypto‘s latest crypto market analysis, click here.


