


The Litecoin (LTC) price trades above a diagonal and horizontal support area that has been in place for more than 600 days.
Litecoin moves inside a short-term corrective pattern, barely holding on to its support trend line.
Litecoin Holds Above Support
The weekly time frame technical analysis shows that the LTC price has increased alongside an ascending support trend line since June 2022. The trend line has been validated six times (green icons), most recently last week.
The LTC bounce also coincided with a horizontal area that has existed for more than 600 days, acting as both resistance and support.
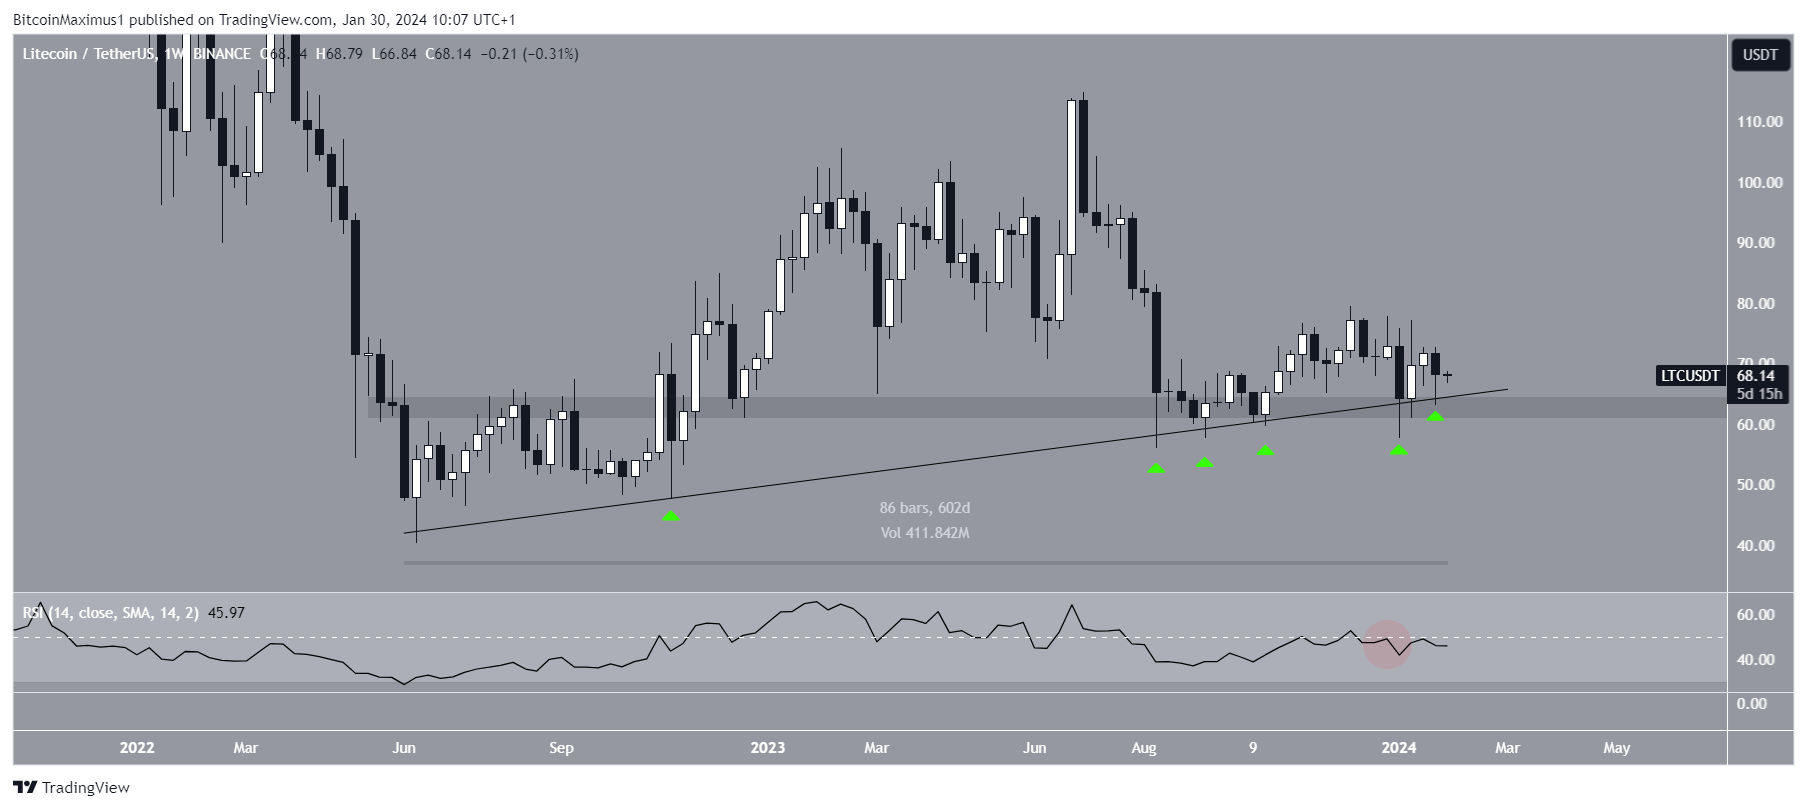
The weekly Relative Strength Index (RSI) leans bearish. The RSI is a momentum indicator traders use to evaluate whether a market is overbought or oversold and whether to accumulate or sell an asset.
Readings above 50 and an upward trend suggest that bulls still have an advantage, while readings below 50 indicate the opposite. The indicator is below 50 (red circle) and falling, both signs of a bearish trend.
Read more: 7 Best Litecoin (LTC) Wallets
What Are Analysts Saying?
Cryptocurrency analysts and traders on X have mixed opinions on the future LTC trend.
Matthew Dixon is bullish, predicting a movement to $85.
According to WB on the daily outlook, #LTC is due for a push higher to the grey box area, however, caution is advised ahead of the #FOMC rate decision tomorrow as this will likely provide solid direction to all markets including $LTC #BTC & others
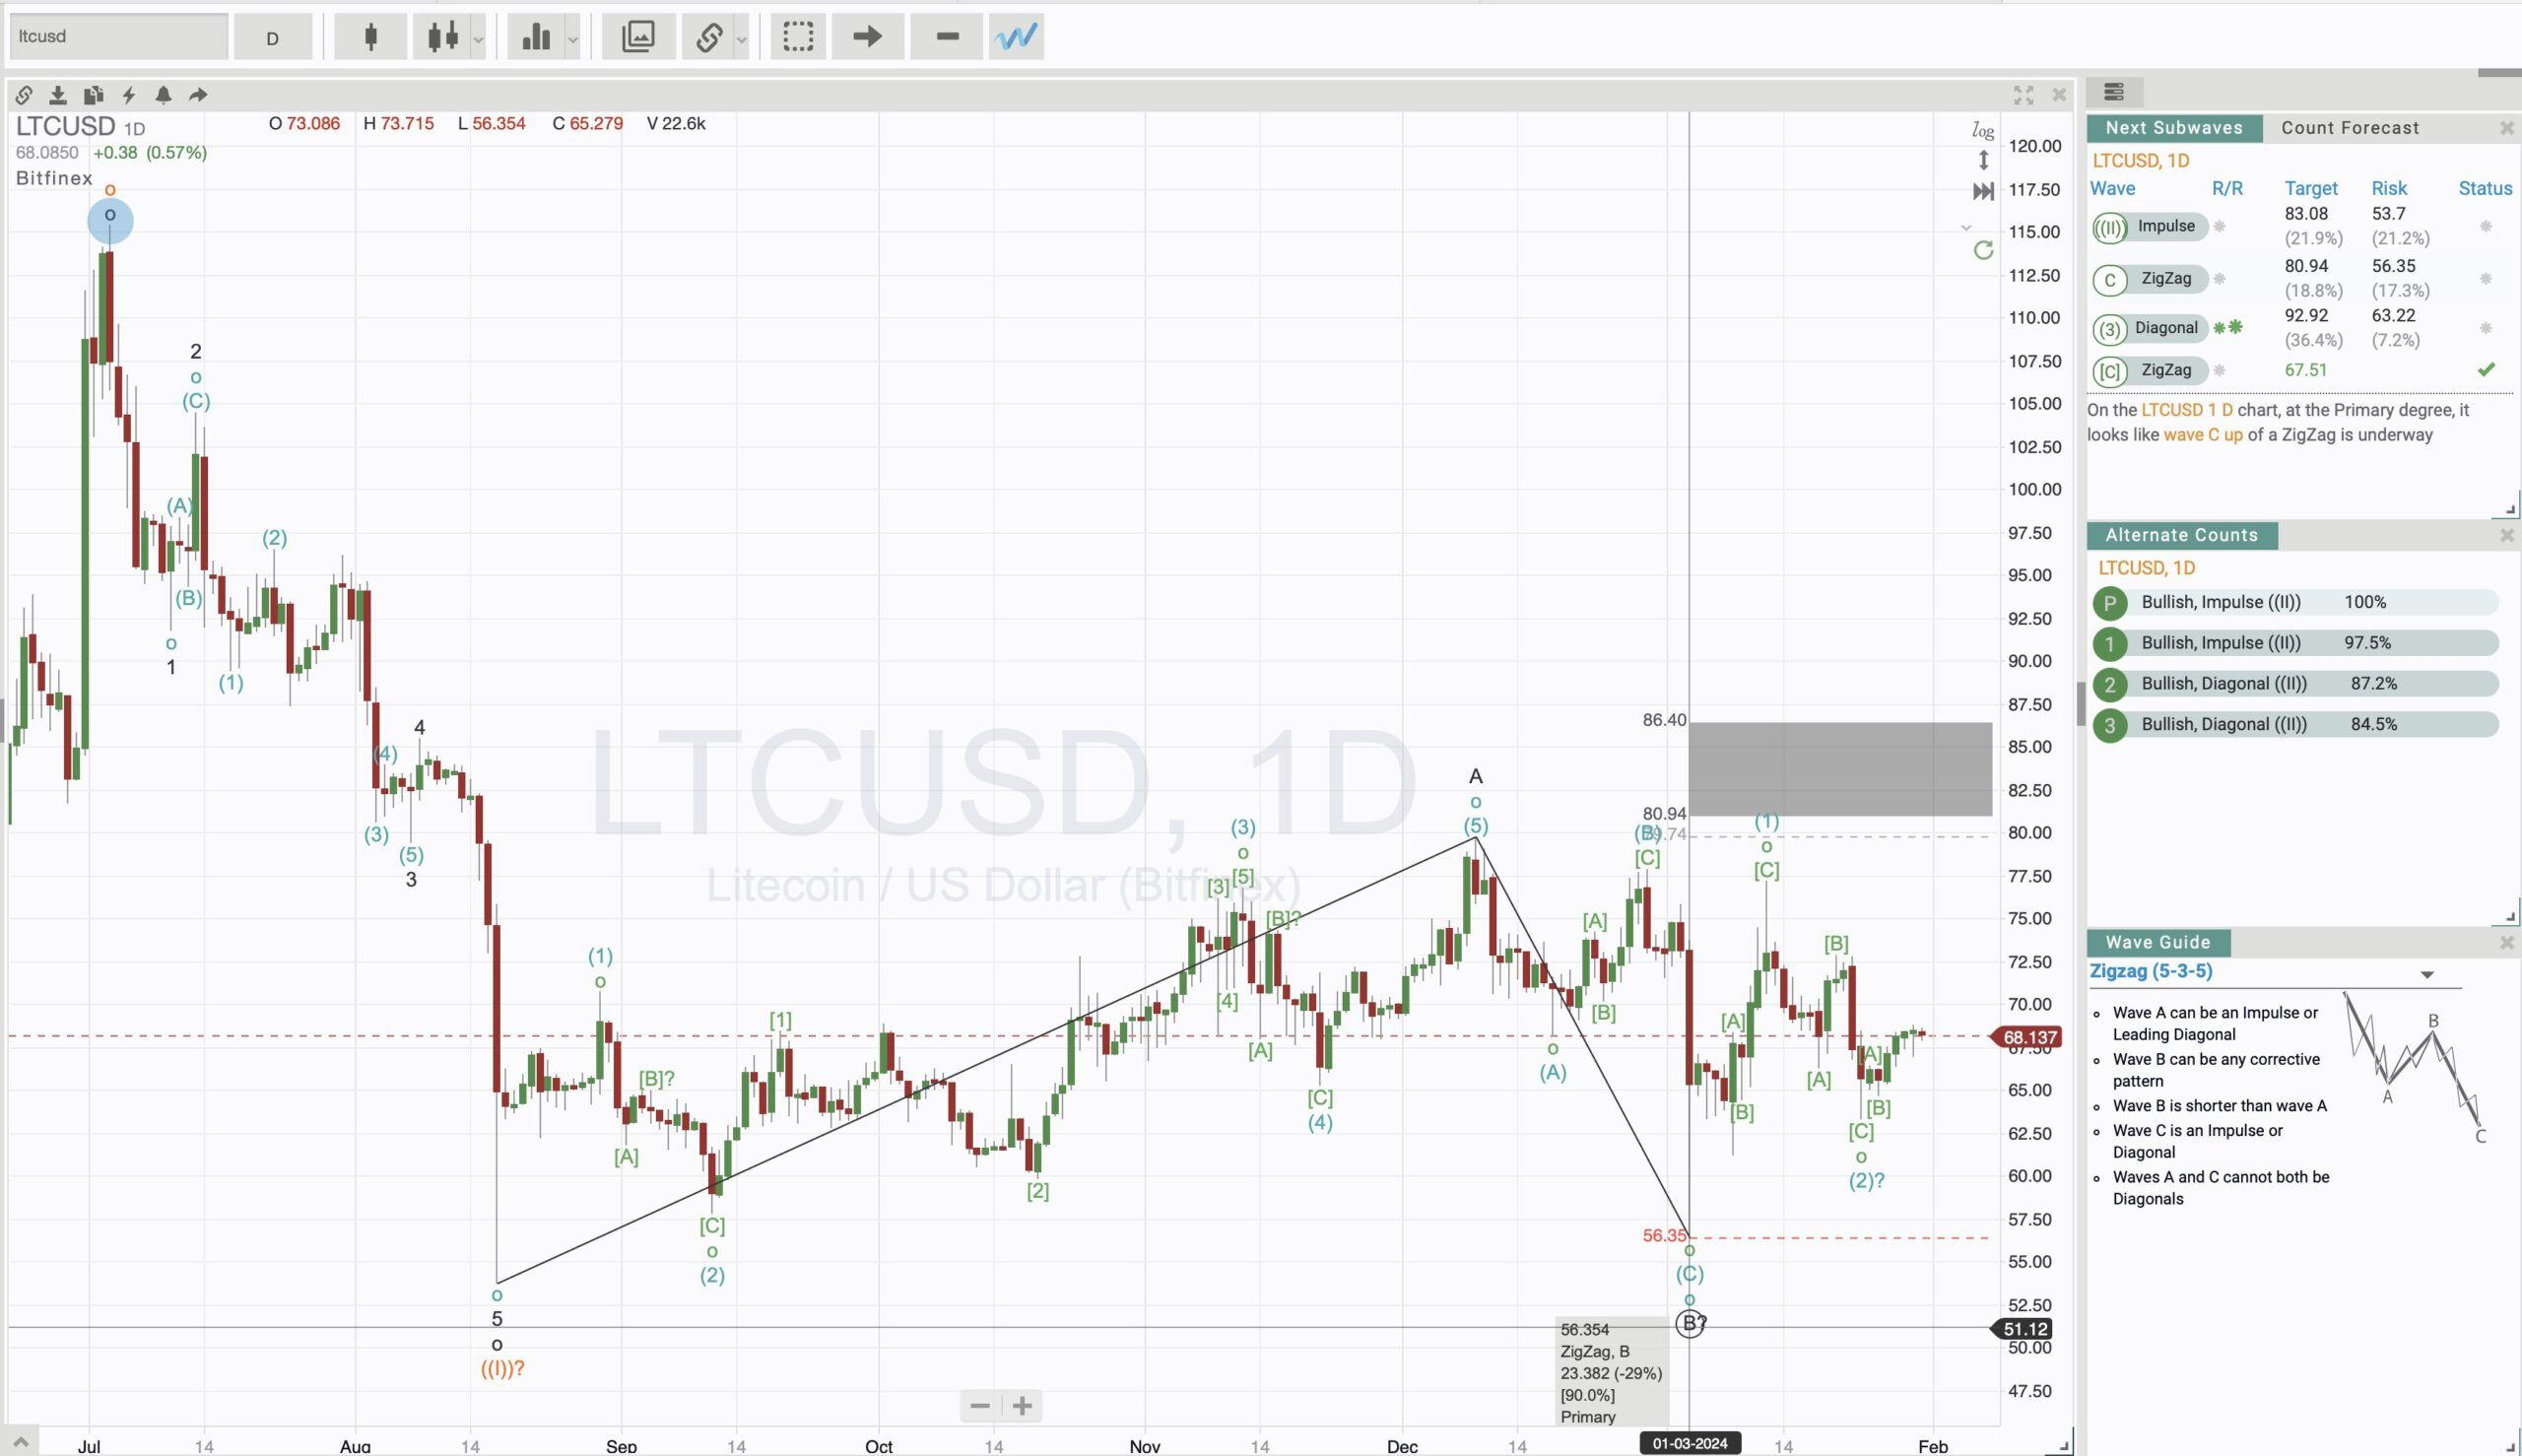
However, Valeriya is bearish because of a short-term breakdown expecting lower prices soon.
Read more: How To Buy Litecoin (LTC) in 4 Easy Steps
LTC Price Prediction: Will an Upward Movement Finally Begin?
The daily time frame technical analysis also leans bearish because of the price action and RSI readings.
The price action shows that LTC has traded inside an ascending parallel channel since September 2023. Such channels usually contain corrective movements, meaning an eventual breakdown from it is likely.
Furthermore, the Litecoin price has followed a descending resistance trend line (dashed) since a rejection from the channel on December 9, 2023.
Finally, the daily RSI is below 50 and falling (red circle), both signs of a bearish trend.
If LTC breaks down from the channel, it can fall 25% to the closest support at $50.
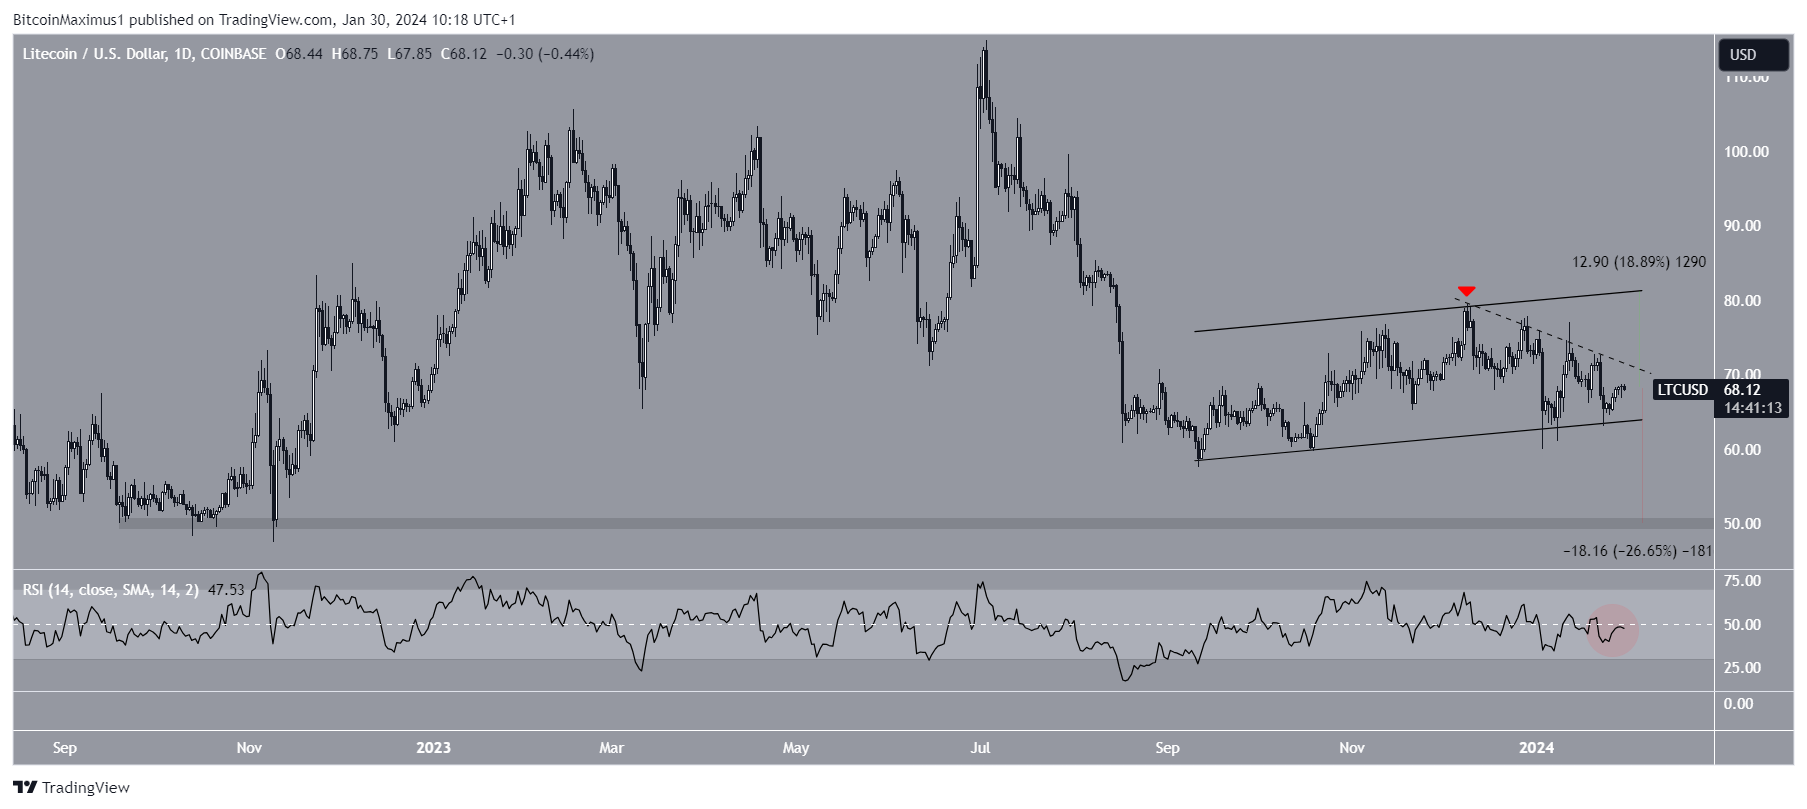
Despite this bearish LTC price prediction, a breakout from the short-term resistance trend line can trigger a 20% increase to the top of the channel at $80.
For BeInCrypto’s latest crypto market analysis, click here



