
Smartphone users are surely the closest to crypto adoption. Having a portable device in hand and being always connected to the internet simply makes life easier. The Celo blockchain is one of the first to understand this — as a smartphone-specific blockchain ecosystem. Here, we discuss the CELO price prediction model, focusing on the future of the blockchain and its native token, CELO.
If you are an early trader/investor and deliberating CELO as a long-term investment option, here’s some background. For starters, CELO is a proof-of-stake (PoS) crypto. Plus, the blockchain Celo is environment-friendly and helps build DApps. CELO is also useful as a governance token and as a mode of transaction. A blockchain optimized for smartphones, Celo also has plans to move into the stablecoin space. So what might the long and short time prices of CELO be? Let’s take a look.
- CELO price prediction using fundamental analysis
- CELO tokenomics
- CELO price action: market cap, trading volume, and trading markets
- CELO price forecast using on-chain metrics
- CELO price prediction using social growth
- CELO prediction using technical analysis
- Celo (CELO) price prediction 2023
- Celo (CELO) price prediction 2024
- Celo (CELO) price prediction 2025
- Celo (CELO) price prediction 2030
- Celo (CELO) long-term price prediction until 2035
- How accurate is the CELO price prediction?
- Frequently asked questions
CELO price prediction using fundamental analysis
Celo aims to break barriers to crypto adoption and make blockchain ecosystems more accessible. Here are some crucial insights:
- Celo’s first app, the Celo wallet, strives to become the go-to social-payments setup for smartphone users.
- There is already an algorithmic stablecoin — cUSD or Cello Dollars — within the ecosystem.
- Celo plans to grow a stablecoin ecosystem and bring DeFi to the masses.
- Even though CELO has its own mainnet, it still has an ERC-20-compliant interface.
- The stablecoin cUSD has grown by 764% since last year, as per Messari’s stablecoin growth tracker.
- Despite the market downturn, cUSD has shown decent peg stability since May 19, 2021.
- The growth of cUSD propels the dual token architecture and might impact CELO going forward.
- 76% of cUSD-backing reserves are in CELO. A red flag of sorts.
- Celo allows the creation of other stablecoins on the blockchain.
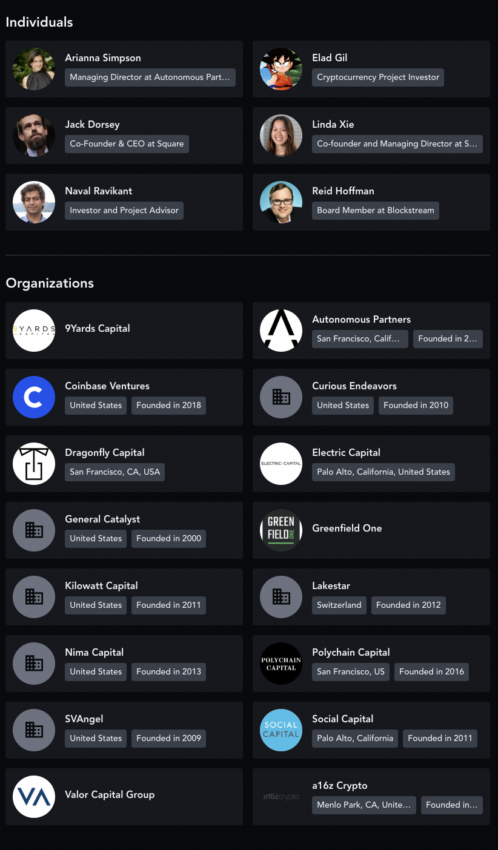
- Celo has Naval Ravikant as an investor and a project advisor.
- Coinbase is one of the leading institutional investors in Celo.
- A part of the generated gas fees moves to the community fund. This guarantees financial well-being if the ecosystem keeps growing.
The algorithmic stablecoin setup and the dual-token architecture of the Celo blockchain does raise eyebrows… Remember UST-Luna? Yet, Celo has a reliable investor base and a growing community. This makes the CELO price prediction positive for now.
CELO tokenomics
CELO has a max supply of 1 billion tokens. 600 million of those were a part of the mainnet launch.
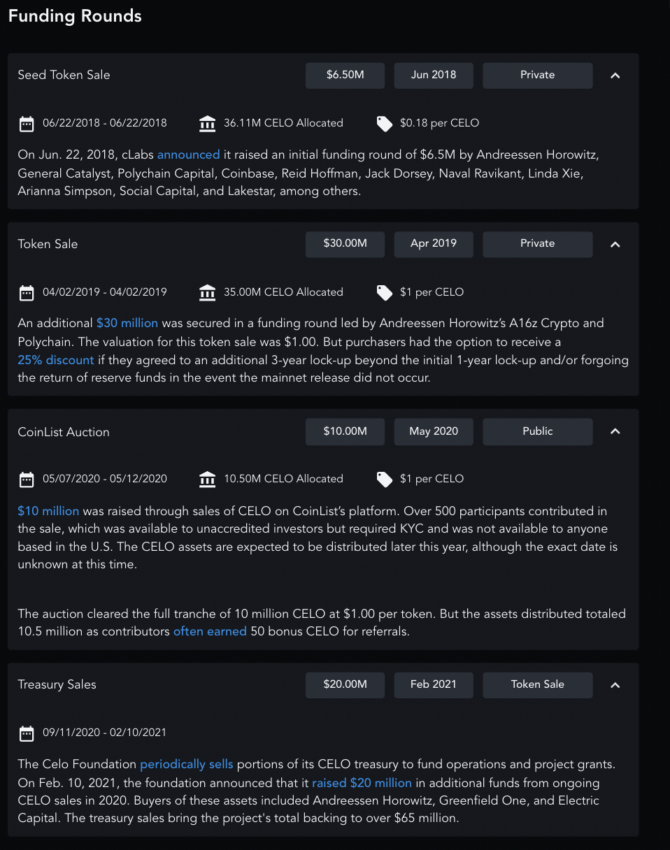
Also, there were a few funding rounds organized initially to drive capital. Here is a detailed breakdown of the same:
Here is a supply breakdown of the initially allocated 600 million tokens:
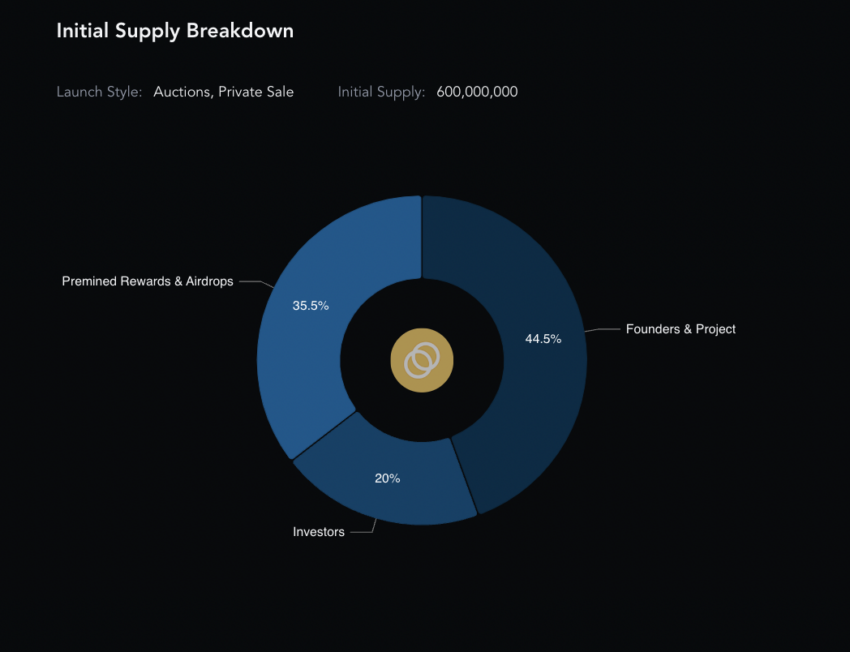
Do note that 44.5% of the supply belongs to the founders/project. Since 2018 Celo started token sales, there’s been a vesting period to avoid massive sell-offs.
Also, a maximum of 120 million can be allocated to the cUSD reserves as a stablecoin backing.
400 million tokens are to go out as Epoch rewards. Hence, they have their own vesting periods built within. Also, the Epoch-specific releases keep the issuance rate into consideration, which would decrease gradually.

The phased token release schedule aims to keep the demand-supply curve intact. If cUSD gains popularity, the demand for CELO will automatically increase. This would make the tokenomics even more favorable toward positive price action.
CELO price action: market cap, trading volume, and trading markets
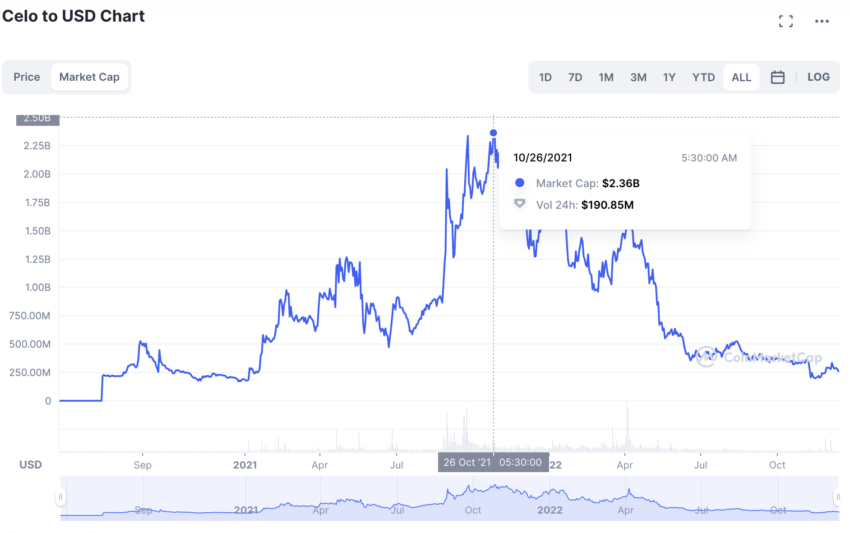
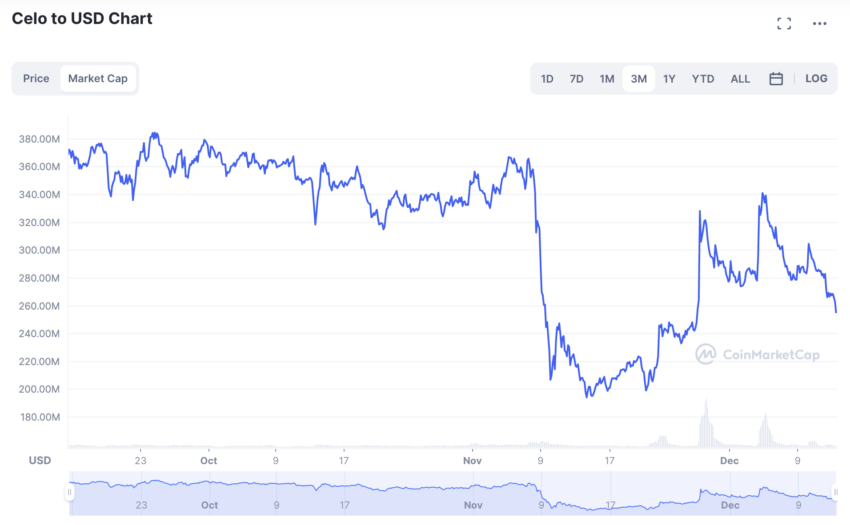
The market cap of CELO peaked on Oct. 26, 2021. It was at $2.36 billion with a trading volume of $190.85 million. That’s a turnover ratio of 0.08.
The market cap as of December 2022 is $254.68 million, whereas the daily trading volume is $8.39 million. The turnover ratio comes out to be 0.03.
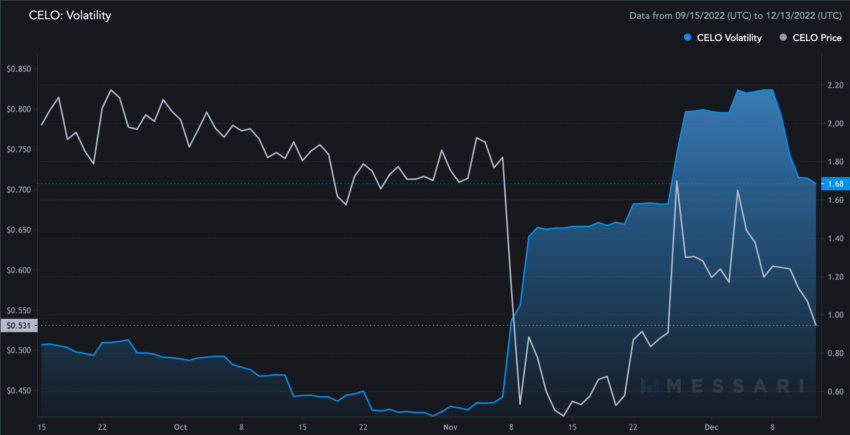
Hence, CELO’s volatility increased in 2023, which might not be a great short-term sign for bullish price action. Here is a Messari chart that shows the same. Our volatility calculation holds as CELO’s volatility seems to have peaked over the past three months. This has driven prices down in the process.
Turning to the trading markets, CELO has a good exchange spread in the Spot market, which was identified in 2022. The CELO-USDT trading volume is the highest. Most other markets also have decent liquidity scores, indicating the minimal impact of volatility.
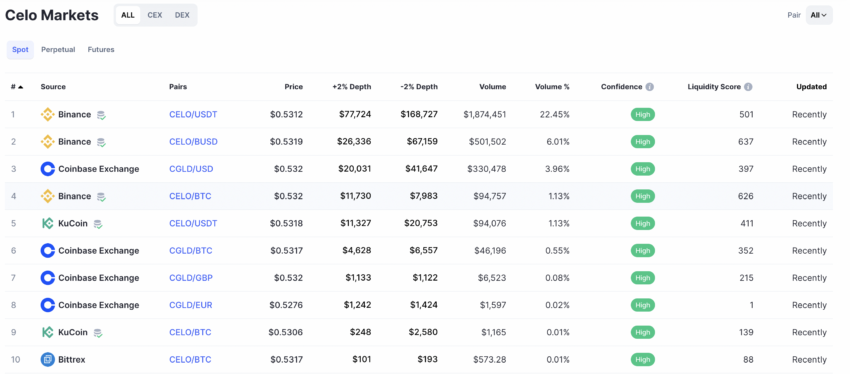
The CELO coin has a decent exchange spread, making it a potential option in the crypto market. Even in 2024, CELO is listed on the most popular exchanges, including Binance, OKX, Coinbase, and more.
CELO price forecast using on-chain metrics
CELO prices dipped in early November 2022 only to start picking up to pre-November levels, December onwards. This price movement aligns with the gradual rise in network activity at Celo during the same time.
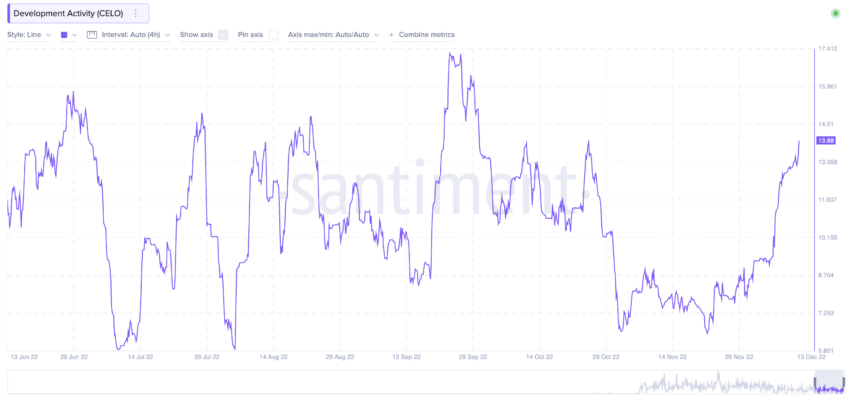
Development activity at Celo must keep showing strength for the prices to do the same.
CELO price prediction using social growth
The social media following is pretty strong — totaling 424.70K followers in 2022. So can this impact CELO’s future price?
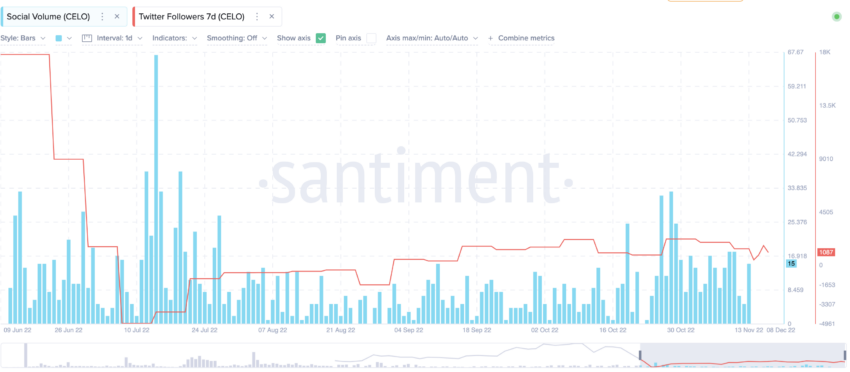
The social volume has been dipping since the July peak. However, we can see a steady uptick from October to the end of 2022 onwards. The prices have also seen an upward trajectory since.
Celo’s Twitter follower growth has also been steady during the initial dip in June 2022.
Inference: Social following does impact the price action. The more popular the Celo blockchain gets, the more chances the future prices have of going up. A close eye needs to be kept on the same.
CELO prediction using technical analysis
CELO looks like a decent prospect from a fundamental and an on-chain angle. Now, let us shift to the technical analysis to see if we can find a pattern in terms of price action.
But before that, here are the things we know about CELO:
- CELO went all the way up to $10.66 on Aug. 30, 2021.
- Its lowest level was $0.4043, touched a few days back, on Nov. 14, 2022.
Hence, the highest to lowest point took 441 days.
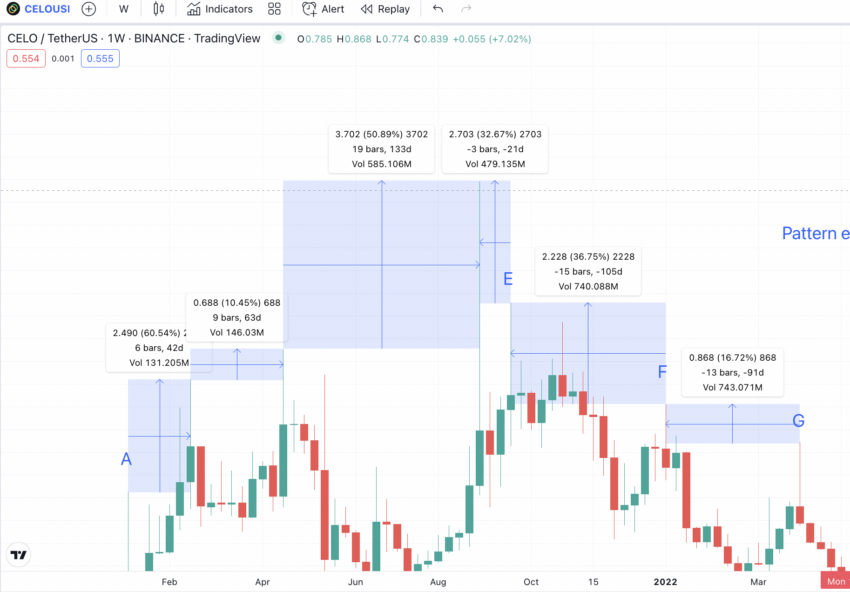
If we look at CELO’s weekly chart, here is the pattern we notice:
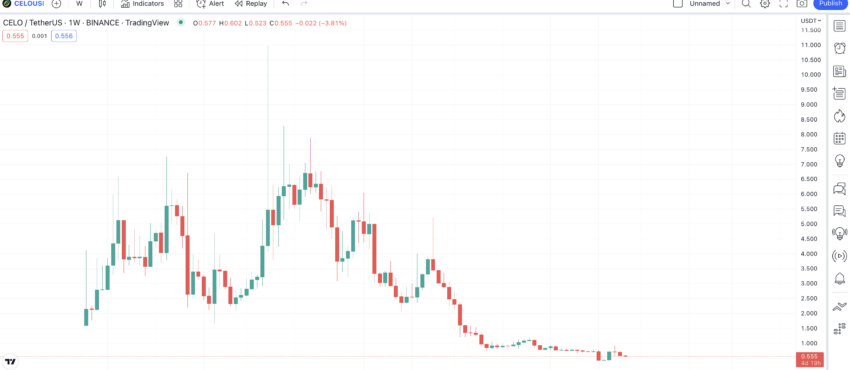
A series of three higher highs followed by a peak. The peak followed three lower highs. The following range-bound period is more like a cool-off period. Per the last two weekly patterns, we might see a new high at CELO’s counter.
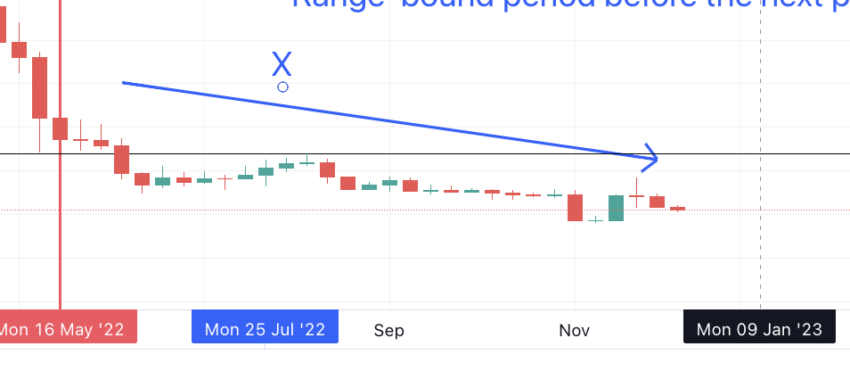
For the sake of reference, the points are marked from A to G. The vertical line is where the pattern is supposed to end.
Here is the chart with all the marked levels:
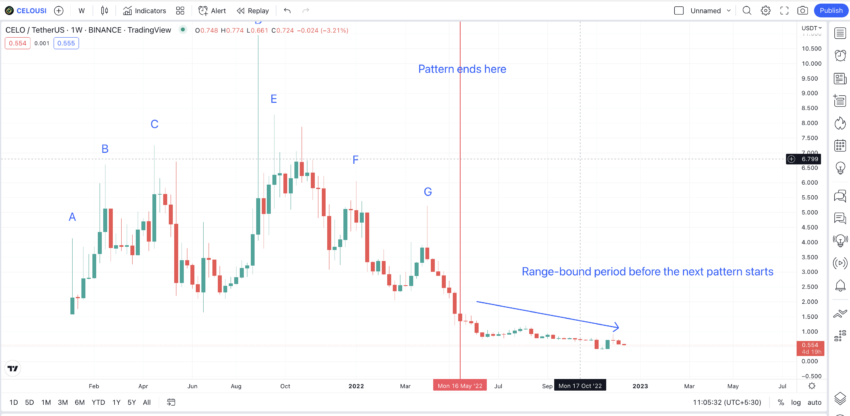
Price changes: High to high
Outlook: Bullish
To find the points as per the next pattern, we need to find the average distance between A-B-C-D and the D-E-F-G. Also, per the latest price action, the immediate high point could be X.
So let us plot the price change patterns using this information.
Pattern 1:
A to B = 42 days and a 60.54% growth; B to C = 63 days and a 10.45% growth; C to D = 133 days and a 50.89% growth
Pattern 2:
G to F = 91 days and a 16.72% growth; F to E = 105 days and a 36.75% growth; E to D = 21 days and a 36.75% growth
Here is a chart with all the points mentioned:
Now the average of the first high to the second high, both time and growth-wise, is:
(42+91)/2 = 67 days approximately
(60.54 + 16.72)/2 = 38.63% or 39% approximately
If we consider the first high of the next pattern at X, on Aug. 8, 2022, the next point Y might show a 39% uptick, 67 days from X.
Per the chart, the next high should have been on 14 October. However, the pattern failed due to the bear market.
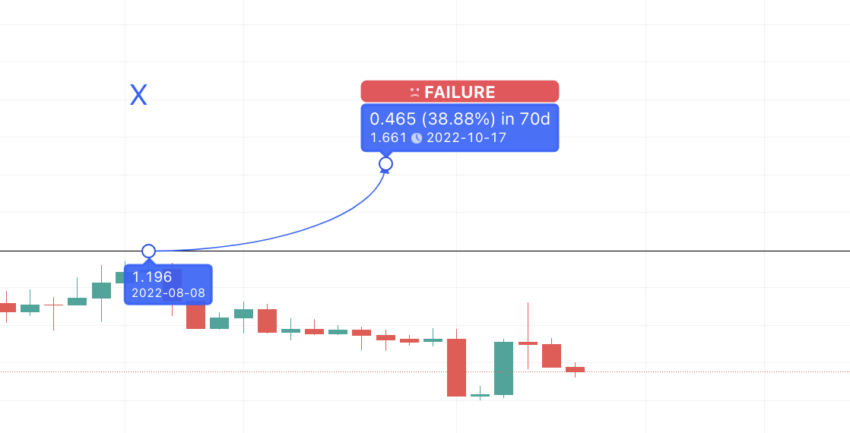
So to find the next high, we should use the Nov. 14, 2022, low as a reference.
Price changes: Low to high
Outlook: Moderately bullish
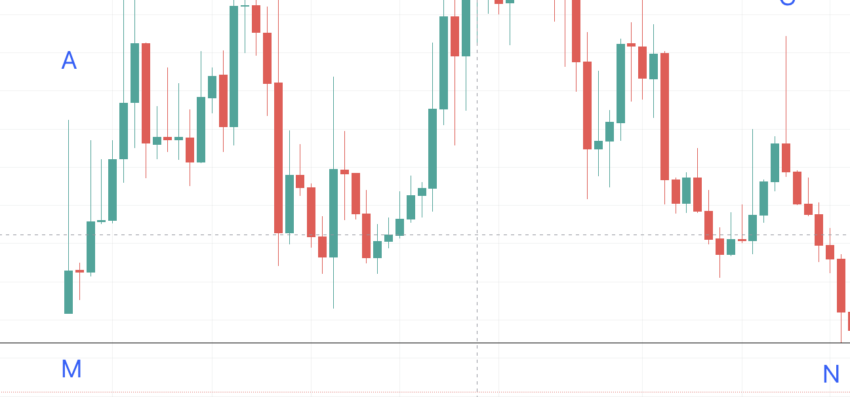
If you look at this chart carefully, you will know that point M was the first low on the CELO price chart. The first/last low, as per the second pattern, is N. Now let us plot M to B and N to F to find the next low-to-high path.
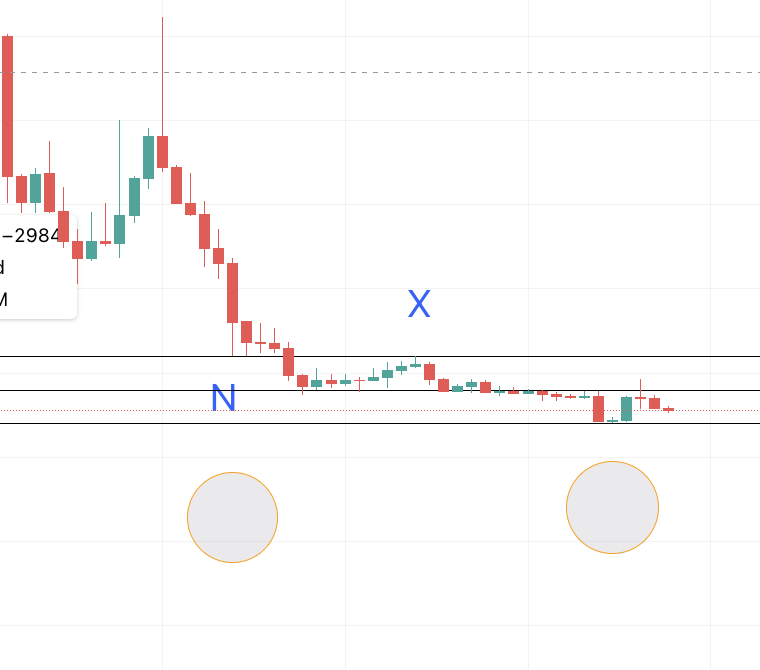
M to B = 42 days and a 312.77% growth; N to F = 126 days and a 403.99% growth
The average of these figures would be 84 days and 358.38%.
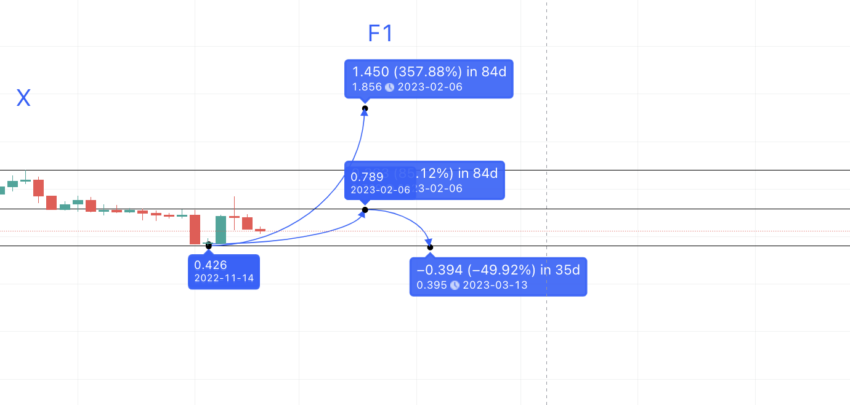
Now we can plot the same on the current chart, starting Nov. 14, 2022 — the day of the last low. If you plot the same, the next high should be at $1.85 and close to Feb. 6, 2023. However, if the current crypto market conditions prevail, the average price of CELO might settle lower.
Here is the price curve we are looking at:
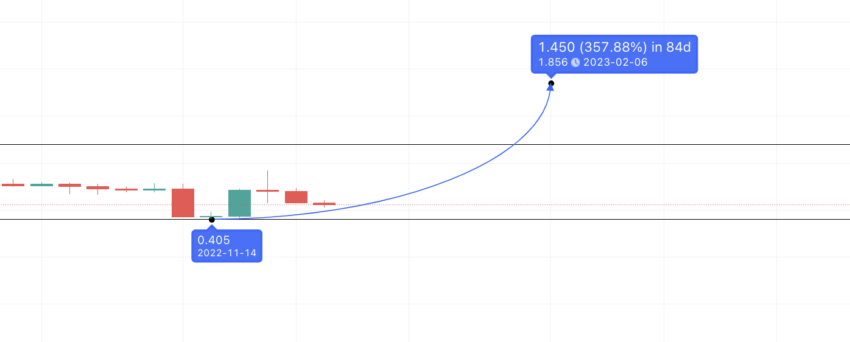
Let us name this point F1 as it coincides with F from the previous pattern.
Celo (CELO) price prediction 2023
CELO came close to breaching our 2023 price prediction level. Read on to know more about the same:
The previous chart plotting suggests the next high can surface at $1.85 or F1. But that’s the maximum projection. Let us visit the daily chart to find a more probable upper limit for CELO.
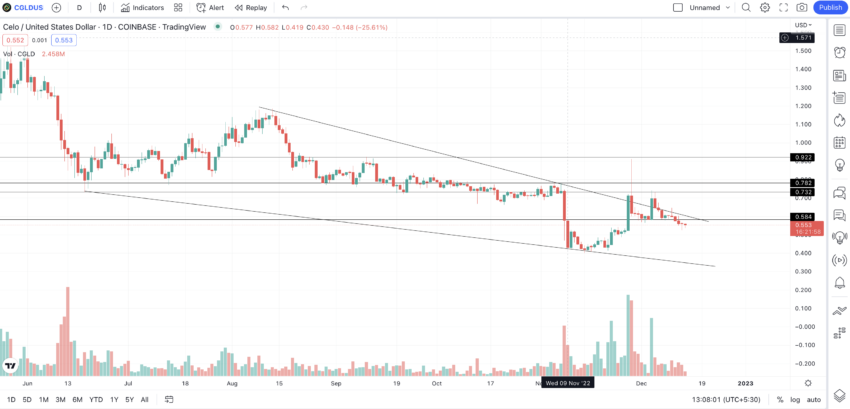
If you look at the chart pattern, you will notice that CELO is trading inside a descending or falling wedge. This pattern can turn bullish for CELO if the on-chain metrics and trading volume spikes agree. Also, if you notice the volume pillars, steady growth and adoption are visible at CELO’s counter.
If the upper trendline of the bullish wedge breaks out, expect the next highs to show somewhere at $0.782 and $0.922.
Keeping the current market conditions in mind, the February high could be at the immediate resistance of $0.782.
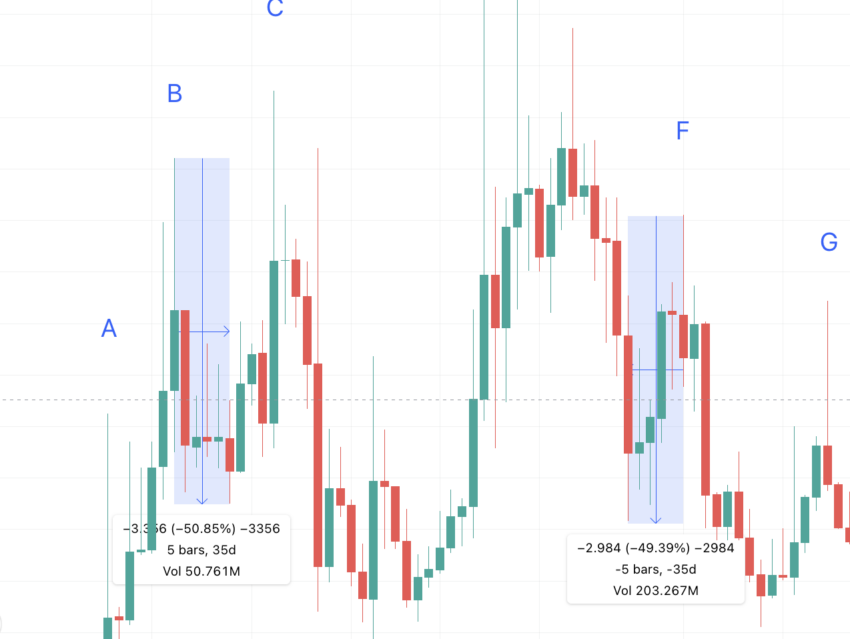
Now let us plot the low for 2023. We can track the distance from F to its previous low O, and the distance between B to its next low, Z.
B to Z = 35 days and a drop of 50.85%; F to O = 35 days and a drop of 49.39%
The average comes out to be 35 days a 50% drop.
Hence, if the high for 2023 is $0.782, the low could be anywhere close to $0.403. Also, if the high comes as per projection at $1.856, the low would then be at $0.97.
If short-term resistance levels and current patterns are considered, CELO might have a lukewarm year in 2023. We could see a high at $0.782 and a low at $0.403.
Celo (CELO) price prediction 2024
Outlook: Bullish
The average price of CELO in 2023 can be around $0.782 — near the resistance. Now, if we revisit the tables from earlier, we see that F to E took 105 days and a 36.75% growth. Whereas, B to C took 63 days and a 10.45% growth.
Therefore, the average would be 84 days and 23.6% or 24% approximately.
Now let us see if, keeping the current state of the crypto market in mind, the distance can shift.
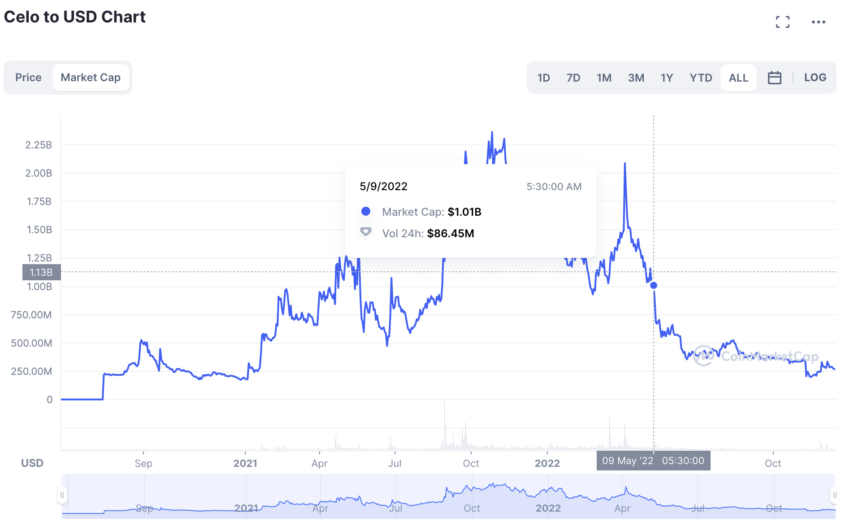
So, let us take those two encircled points as the two lows. The market cap at N or 9 May was $1.01 billion. Also, the market cap at the 14 November low was $197.75 million. (We took the lows into consideration to have a more realistic sight of the market cap)
Hence, the ratio low between the market caps from a semi-bear to the complete bear market is 1010/197.75 = 5.1 or 5.
Therefore, the time taken from the F1 to the next high, say E1, will be 84 x 5 days = 440 days.
If the same growth pattern continues, the next high would again be in 440 days and a 24% uptick.
Here are the plotted paths:
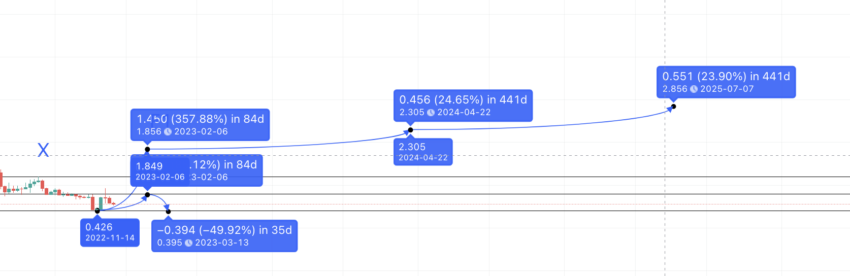
The next high will be in 440 days and 24% higher. Therefore, the CELO price prediction for 2024 is at $2.305.
Projected ROI from current levels: 147%
Celo (CELO) price prediction 2025
For 2025, the high could be at $2.856. The low can still be at a 50% drop or $1.15 for 2024 and at $1.425 for 2025.
Projected ROI from the current level: 206%
Celo (CELO) price prediction 2030
Once CELO touches the 2025 high of $2.856, there aren’t many resistance lines to stop its ascent. Also, let’s assume that 2025 is the C1, similar to the C from the first pattern. So, the next distance to the peak should be at 133 days and a 50.89% growth rate.

Hence, by the end of 2025 or early 2026, the CELO price could go as high as $4.319. However, by this time, the previous trend of slow growth would have changed. So, we can average out the timeframe.
We saw previously that the max distance between two highs is 440 days (with 24% growth) using the market cap. And, the minimum distance is 42 days (with 60.54% growth) using the first table and plotting from A to B. Therefore, the average comes out to be 241 days and a 42.25% growth. From 2026, the next high, as per the average, should be $6.61, somewhere in the middle of 2026.
If the same path is traced, the next high could be at $8.68. That would be the CELO price prediction for 2027. The CELO price prediction for 2028 might average out at $12.354. Also, do note that by 2028, CELO should breach its all-time high price, and hence next path might not follow the set pattern.
If the Celo ecosystem survives this, we can expect CELO to go as high as $17.94 by 2030.
Projected ROI from the current level: 1829%
Celo (CELO) long-term price prediction until 2035
Even though we have plotted CELO’s path till 2030, it is appropriate to consider a move till 2035, especially to help you visualize the long-term pathway.
You can easily convert your CELO to USD
Here is the longer-term price prediction data:
| Year | | Maximum price of CELO | | Minimum price of CELO |
| 2024 | $2.305 | $1.15 |
| 2025 | $2.856 | $1.425 |
| 2026 | $4.319 | $2.16 |
| 2027 | $8.68 | $4.40 |
| 2028 | $12.354 | $7.22 |
| 2029 | $14.82 | $9.88 |
| 2030 | $17.94 | $11.12 |
| 2031 | $26.01 | $16.12 |
| 2032 | $39.01 | $27 |
| 2033 | $46.82 | $33.71 |
| 2034 | $58.52 | $42.13 |
| 2035 | $87.79 | $54.42 |
CELO price prediction might differ from the projected paths. This depends on the sentimental drivers, changing fundamentals, token release schedules, short-term moving averages, and other technical analysis pointers.
How accurate is the CELO price prediction?
This detailed CELO price prediction model takes multiple factors into account. The projected prices each year are carefully calculated. Yet, things might change depending on when and where the crypto market bears and bulls appear. Therefore, focusing on the average CELO price movements each year is more advisable than focusing solely on the highs and lows.
Frequently asked questions
What will Celo be worth in 5 years?
Is Celo a good crypto?
Is Celo a good investment?
Is Celo a stablecoin?
Is Celo built on Ethereum?
Disclaimer
In line with the Trust Project guidelines, the educational content on this website is offered in good faith and for general information purposes only. BeInCrypto prioritizes providing high-quality information, taking the time to research and create informative content for readers. While partners may reward the company with commissions for placements in articles, these commissions do not influence the unbiased, honest, and helpful content creation process. Any action taken by the reader based on this information is strictly at their own risk. Please note that our Terms and Conditions, Privacy Policy, and Disclaimers have been updated.