
Aave is a popular DeFi protocol that aims to simplify lending and borrowing. This project’s functionality and use case seem sound, but is the native token AAVE a good investment option? This AAVE price prediction piece factors in fundamentals, technical analysis, and other metrics to find out.
- AAVE price prediction and fundamental analysis
- AAVE price forecast and the associated tokenomics
- AAVE price prediction and key metrics: On-chain, financial, and social
- AAVE price prediction and technical analysis
- Aave (AAVE) price prediction 2023
- Aave (AAVE) price prediction 2024
- Aave (AAVE) price prediction 2025
- Aave (AAVE) price prediction 2030
- Aave (AAVE’s) long-term price prediction until 2035: Is AAVE a good investment?
- Is the AAVE price prediction model accurate?
- Frequently asked questions
Want to get AAVE price prediction weekly? Join BeInCrypto Trading Community on Telegram: read AAVE price prediction and technical analysis on the coin, ask and get answers to all your questions from PRO traders! Join now
AAVE price prediction and fundamental analysis
First of all, Aave is an open-source protocol. It helps ecosystem participants earn interest, depending on whether they borrow or deposit assets. Hence, some investors use Aave to beef up liquidity pools. While depositors push digital assets into the pools, borrowers can use their crypto as collateral to take quick loans. This borrowing-lending cycle, followed by a stable interest-generating mechanism, is what makes the DeFi protocol Aave popular.
The future price growth, however, will depend on Aave becoming the go-to DeFi protocol and a sought-after money market. And that’s a primer on Aave.
Aave protocol and its DeFi outlook
DeFi protocol Aave was initially built on Ethereum but currently has exposure even on the Polygon, Arbitrum, Optimism, and Avalanche ecosystems.
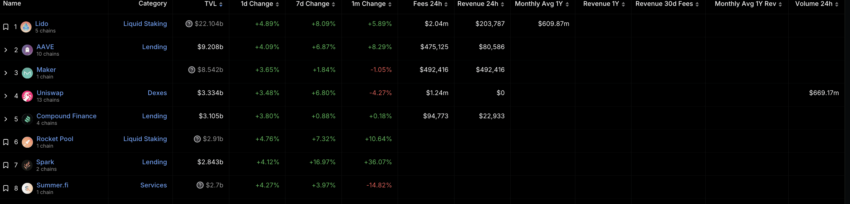
Also, as of January 2, 2023, Aave is the 2nd largest protocol on Ethereum in terms of total value locked, second only to Lido. Plus, AAVE has had the biggest positive monthly change in % the top 5 DeFi protocols on Ethereum.
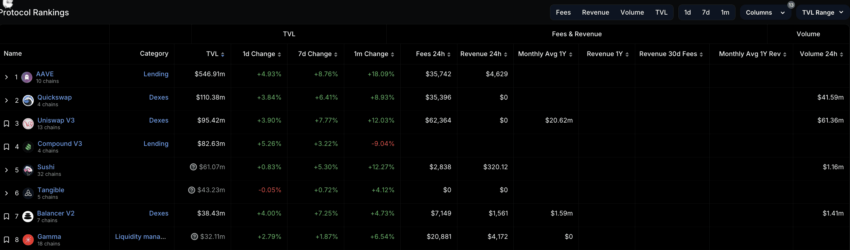
Aave on Polygon is the top-ranked protocol, with a TVL of $547 million at press time. The TVL value has increased by over 18% in the past 30 days.
“All Aave V3 markets are now back in operation. Swift action and resolution from the Aave DAO. Ethereum V2 market will be operational as usual tomorrow.”
Stani Kulechov, Founder of Aave: X
Other developments
Apart from the quantitative factors, the Aave ecosystem has other key developments working in its favor:
Aave is known to constantly introduce upgrades, with AAVE V3 being the third and the newest iteration to show up. V3 focuses on improving the governance model, risk management associated with DeFi activities, and other aspects.
- Decentralized protocol Aave currently supports cross-chain DeFi activities, including lending.
- This Stani Kulechov founded protocol’s native token AAVE saw a massive 97% surge in prices post the AAVE V3 launch.
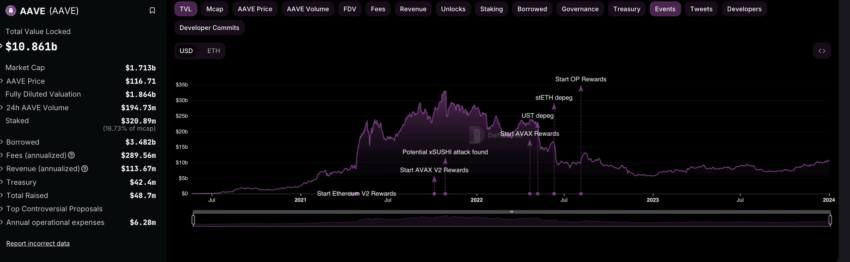
- As of Oct. 5, 2022, AAVE is among the top fee-generating DeFi protocols around, hinting at growing popularity and user adoption.
- Finally, its native token AAVE handles network governance and other ecosystem whereabouts.
- Apart from Ethereum, Polygon, and Avalanche, AAVE has exposure across Optimism, Fantom, Harmony, and even Arbitrum.
Did you know? Aave was initially known as ETHLend, with LEND as its native crypto. While ETHLand launched in 2017, the Aave rebranding happened in 2018.
Currently, the fundamentals look top-notch and favor aggressive AAVE price predictions. However, we still need to look at the on-chain metrics, user adoption, network growth, and tokenomics for forecasting AAVE prices accurately.
AAVE price forecast and the associated tokenomics
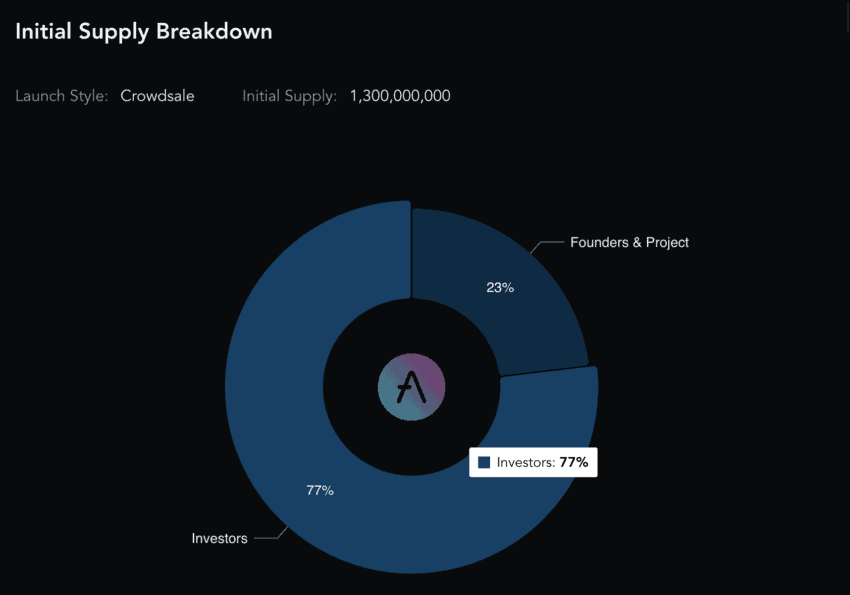
Firstly, AAVE has a fixed supply of 16 million, with three million tokens being reserve-held with timed releases. When Aave was ETHLend, the initial supply was 1.3 billion. However, Aave’s founder, Kulechov, thought of lowering the supply and, in 2020, proposed a 100:1 LEND to AAVE token swap.
As of Jan. 2023, the circulating supply of AAVE is fixed at 14.7 million AAVE tokens. On top of that, a fee-specific burn mechanism keeps the overall token economics model deflationary.
AAVE price prediction and key metrics: On-chain, financial, and social
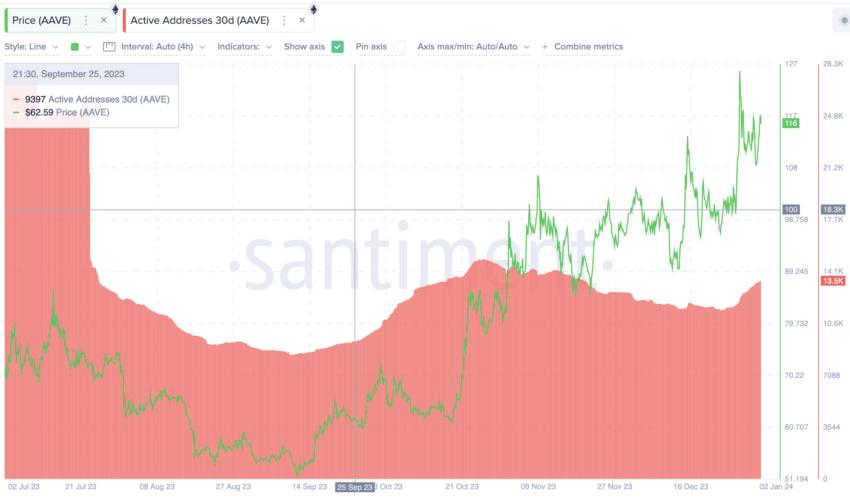
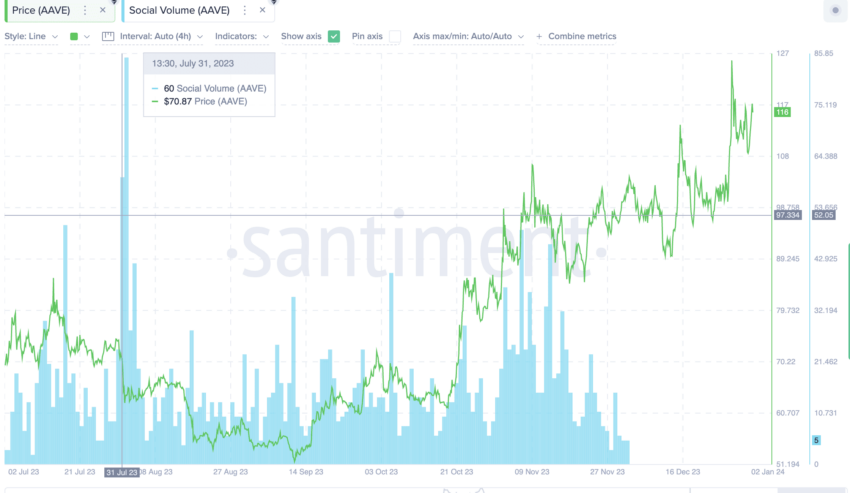
Looking at Aave’s active address count over the past 90 days, a steady drop is visible. The number of active addresses peaked in July 2023 but dropped since. The drop resulted in a price surge, showing that addresses have been creating sell pressure.
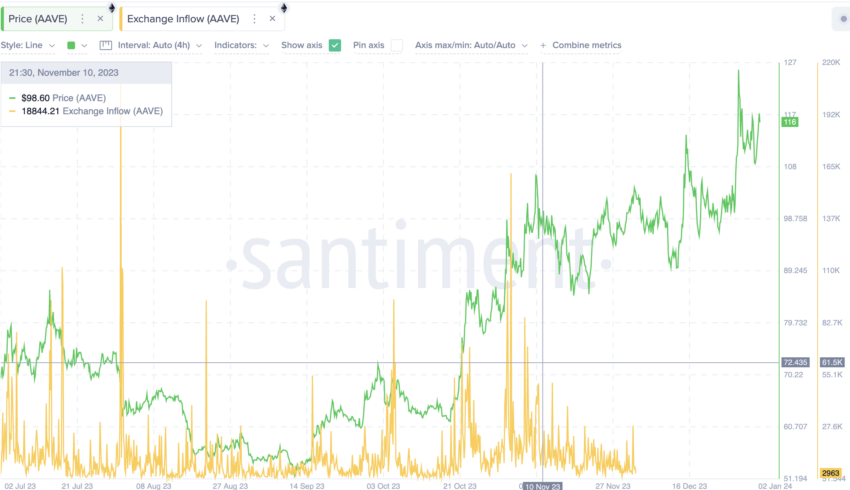
As of early October 2023, exchange inflows have been on the lower side, pushing the prices higher. And once AAVE gained momentum, even the peaks in supply inflow couldn’t push the prices low.
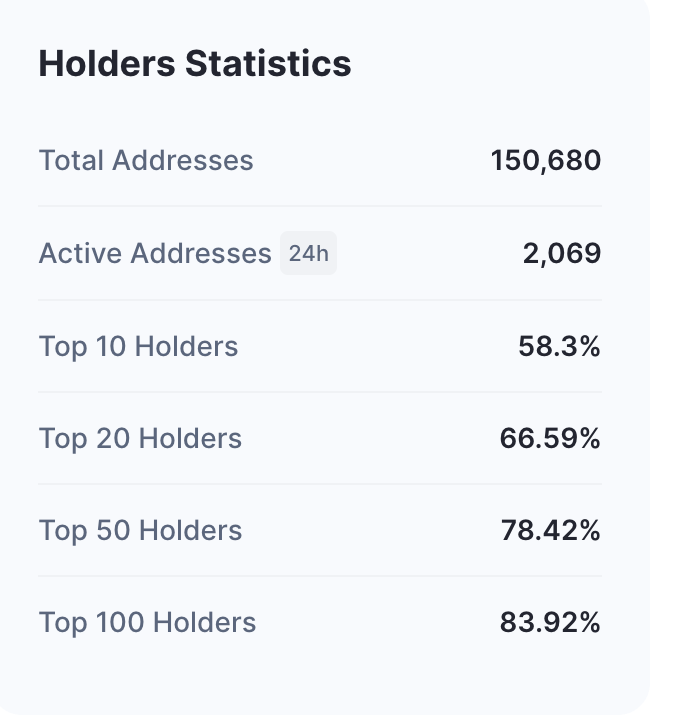
There is cause for concern, though. In the case of AAVE, the top holders 100 held almost 84% of the supply as of January 2023. This kind of distribution can backfire in the event of a market-wide dump.
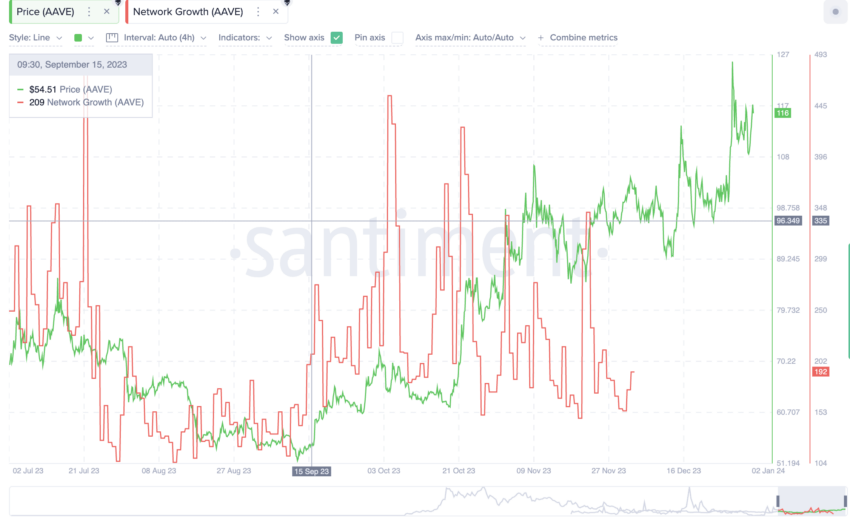
Another interesting on-chain metric is the daily network growth. Post the FTX collapse, the network activity concerning Aave had been rising steadily, with a peak forming around July 21, 2023. Since then, network growth has been steady, contributing to the AAVE price rise.
And finally, the social volume, or rather the social chatter concerning AAVE, has been steady post-July 2023. And the prices responded positively as well.
AAVE price prediction and technical analysis
Before we delve into the weekly patterns, let us analyze the short-term potential of AAVE:
Our January 2023 analysis
As of Jan. 2, 2023, AAVE is trading inside an ascending channel pattern, trying to break out of the upper trendline. However, even the RSI is supportive of the same, making higher highs in the process. If AAVE manages to breach past the upper trendline, $129.62 will be a crucial level.
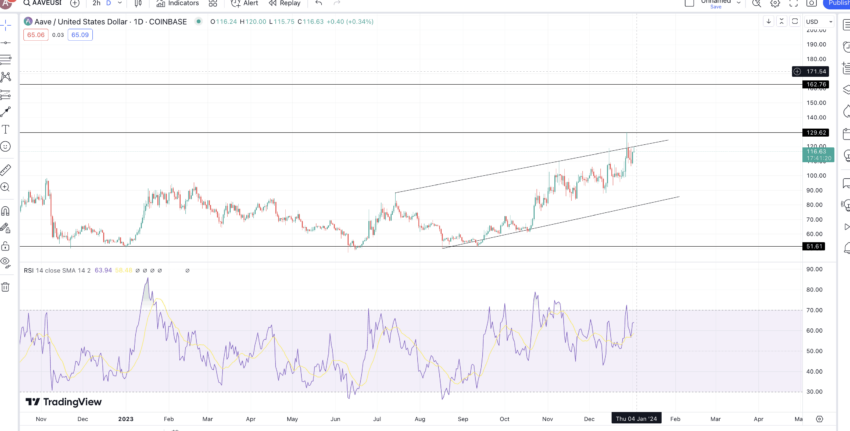
If AAVE can cross the above-mentioned level, the 2024 high can settle somewhere around the $163 mark.
Let us now shift our attention to the broader patterns, courtesy of the weekly charts:
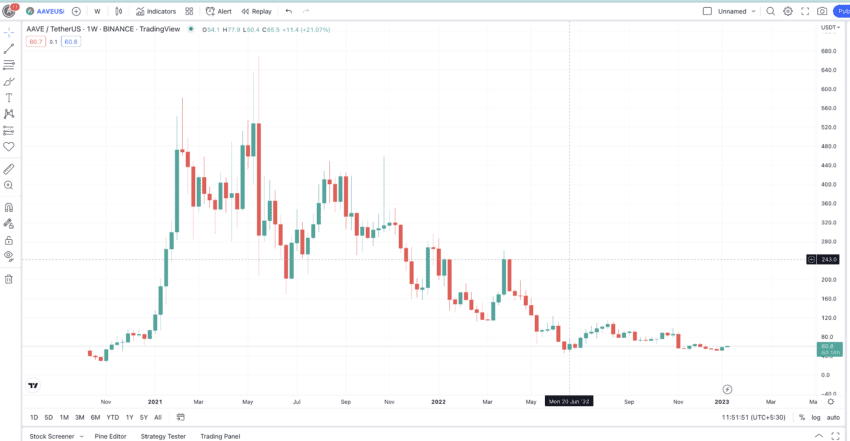
Here is the raw weekly chart for your reference:
Pattern identification
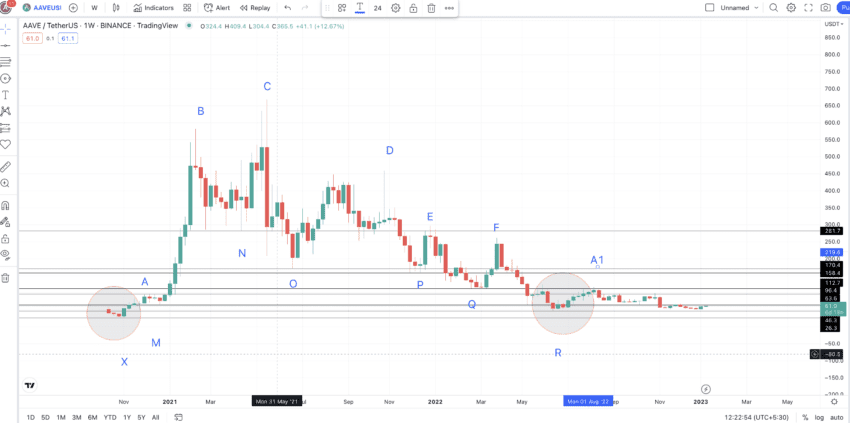
The two encircled zones might be the starting and ending points of the enclosed pattern. As for the pattern, AAVE makes two higher highs to form a peak at C. From the peak, it forms three lower highs, D, E, and F, respectively, to bottom out at R.
Point R resembles point X at the start of the pattern. This shows that we can expect a new pattern to start post-R, with the next high as A1.
Price changes
We now have all the points marked. The assumed pattern isn’t a mirror image of the previous pattern but the same type of continuation. So, our job is to locate the distance and price changes between all the key points from X to R.
We will divide the table creation into two parts: low-to-high and high-to-low.
Table 1: All low-to-high points
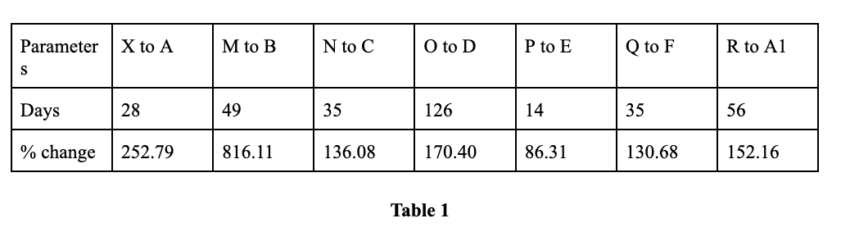
The average distance is 44 days (max is 126 days), and the average percentage growth is 248.03%.
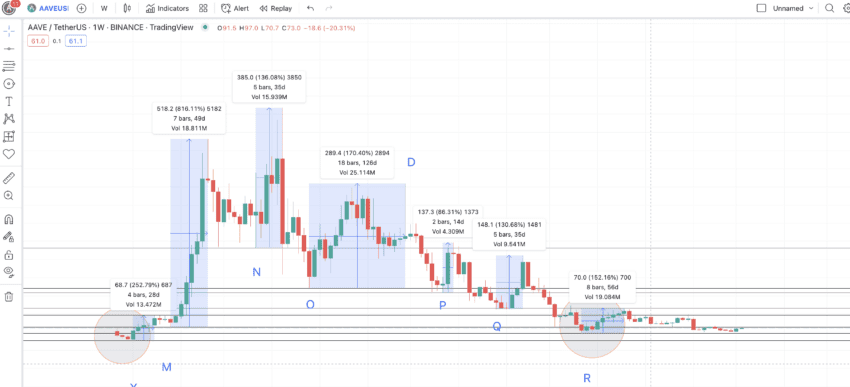
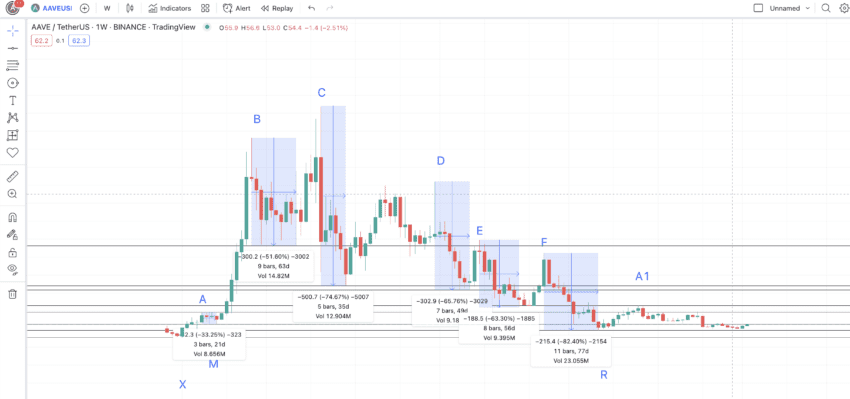
Table 2: All high-to-low points
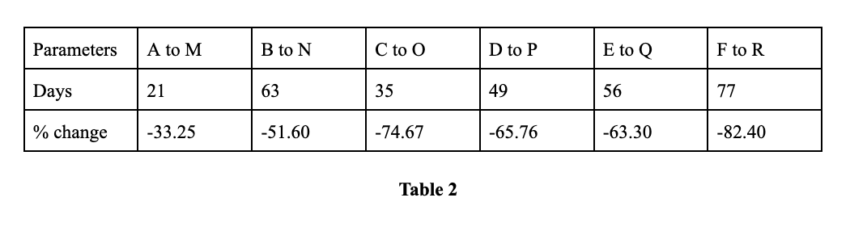
The average distance and price change using table 2 comes out at 49 days and -60.11%. (Do note that the distance can be greater, and the price drop anywhere between -33.25% and -82.40%, per table 2).
We will use the data to calculate the AAVE price prediction levels for 2023, 2025, and beyond.
Aave (AAVE) price prediction 2023
In 2023, we predicted a peak of $94.60 for AAVE. And the same even crossed the $118 mark, validating our projection levels. Here is how we analyzed everything last year:
Now that we can see the high of the next pattern or A1, we can use the high-to-low average to calculate the next low or M1. If we use the forecast line to search for the next low, the level M1 surfaces at a drop of 56.16% and $50.70.
Once there, we can use the low-to-high average of 248.03% and the max distance of 126 days to plot the next point of B2. Note we are taking the maximum distance here due to the bearish nature of the crypto market. Also, the market could continue to experience weakness in 2023, so the maximum percentage gain could be restricted to 86.31%. This is per the minimum price percentage growth, according to Table 1.
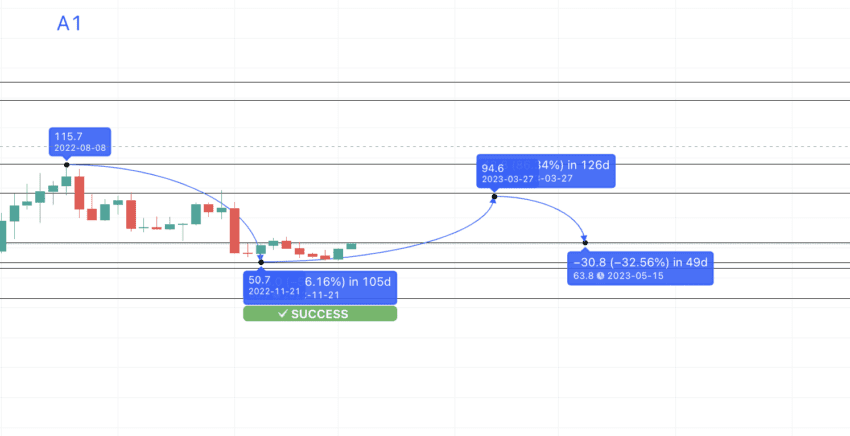
Therefore, in 126 days and at a price peak of 86.31%, we can find the next high or B1. This level might surface at $94.60. Note that, this way, B1 would break the pattern and be lower than A1. This would make sense, considering the fragility of the market.
The next low, or N1, can surface anytime in 49 days or even 77 days — as suggested by data from Table 1. As AAVE is one of the leading DeFi protocols, the drop could take support at $63.80 — an important support level, instead of dropping over 60% — as suggested by the table averages.
Therefore, the AAVE price prediction 2023 high and low could surface at $94.60 and $63.80, respectively.
Aave (AAVE) price prediction 2024
Outlook: Moderately bullish
We now have the minimum price prediction as per the AAVE price prediction 2023 model. Using this low, we can plot the next high in 126+ days and at a high of 86.31%. We are still taking the maximum and minimum values with the expectation of a weak crypto market for the better part of 2023.
And even though the high could show in 2023, we will be better off pushing the price forecast to 2024. The high, in early 2024, could surface at $118.50.
However, as $118.50 is almost there, we can refer to our short-term analysis part. This puts the prospective high for 2024 at $162.76. Based on the current analysis, the low can be around the $51.61 mark.
Projected ROI from the current level: 39%
Aave (AAVE) price prediction 2025
Outlook: Bullish

The low from this point could drop 60.11%, putting the next low at $47.12. Yes, there could be several support levels at $63.80 and even $50.20, but $47.12 seems appropriate. Hacks could still plague DeFi in 2024. There’s no guarantee, of course, but our AAVE price prediction model has considered the worst cases in order to remain practical and realistic.
From this level, we can expect the maximum AAVE price prediction for 2025 to surface at 248.03% — the average point of the low-to-high datasets. The average distance is 126 days, but considering the steady growth of AAVE tokens, the next high may be pushed to 2025. This level surfaces at $164.70. If this level is marked D1, we might see D1 finally moving higher than C1 — defeating the swing high pattern made post-C1.
This optimistic price prediction for 2025 might force an uptrend at AAVE’s counter.
Projected ROI from the current level: 41%
Aave (AAVE) price prediction 2030
Outlook: Bullish
The AAVE price prediction for 2025 is high at $164.70. The low, from here, could drop up to 60% — surfacing at $65.50. The next high could surface at $228 from this level by early 2026.
We now have a 2026 high and a price prediction low for 2025. We can connect these points using the Fibonacci indicator — which will help us trace the path of AAVE till 2030.
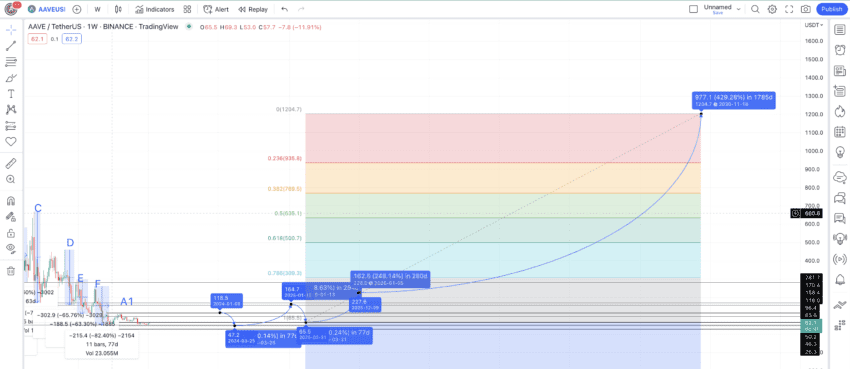
Tracing the same path till 2026 puts the AAVE price prediction high for 2030 at $1204.70. By this time, we can expect AAVE to hit new DeFi milestones, putting the minimum AAVE price prediction 2030 level at somewhere near the $769.50 mark.
However, for AAVE to cross $1200 by 2030, it must breach its previous all-time high of $666.86 by 2029. Doing so will provide the token with some serious momentum.
Projected ROI from the current level: 933%
Aave (AAVE’s) long-term price prediction until 2035: Is AAVE a good investment?
Outlook: Bullish
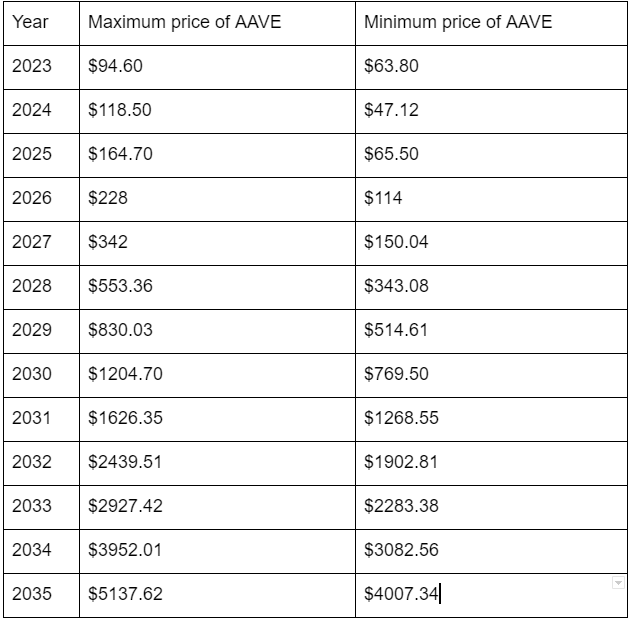
Aave looks like a good investment option till 2030. If you plan on holding AAVE tokens even further into the future, the table below can help trace a price path till 2035.
You can easily convert your AAVE to USD
Do note that price growth or drop will depend on the digital asset’s market sentiments, market cap, and trading volume at the given instant. Also, the growth in the future price of AAVE will depend on the TVL locked across chains. Once layer-2 platforms like Optimism, Arbitrum, and even Polygon start gaining more popularity, we can expect Aave’s TVL and price movements to surge.
Is the AAVE price prediction model accurate?
This AAVE price prediction model considers the project’s DeFi presence, on-chain metrics, and historical data. It is well-rounded, with an equal focus on fundamental and technical analysis. So, we can consider all the price forecast points as relatable, attainable, and in line with crypto market developments. Most importantly, this price prediction model for AAVE even accounts for the DeFi hacks and mishaps — keeping the price estimates reasonable instead of far-fetched.
Frequently asked questions
How much will Aave be worth in 2030?
Is Aave a good investment?
How much will Aave be worth in 2025?
Is AAVE good long term?
What was AAVE’s lowest price?
Disclaimer
In line with the Trust Project guidelines, the educational content on this website is offered in good faith and for general information purposes only. BeInCrypto prioritizes providing high-quality information, taking the time to research and create informative content for readers. While partners may reward the company with commissions for placements in articles, these commissions do not influence the unbiased, honest, and helpful content creation process. Any action taken by the reader based on this information is strictly at their own risk. Please note that our Terms and Conditions, Privacy Policy, and Disclaimers have been updated.