


The GALA price broke out from a short-term descending resistance trendline but still trades under a longer-term one.
The readings from the weekly and daily timeframes do not align with each other.
GALA Falls Under Descending Resistance Trendline
The GALA price has decreased under a descending resistance trendline since the beginning of the year. The high point of the trendline coincides with the yearly high of $0.062.
During the 252 days the trendline has been in place, GALA fell by 80%, culminating with a low of $0.013 last week.
After the low, the price bounced and is currently in the process of breaking out from the trendline. However, a weekly close above it is required to confirm the breakout.
The line also coincides with the $0.016 horizontal resistance area, increasing its significance. The next resistance is at $0.032.
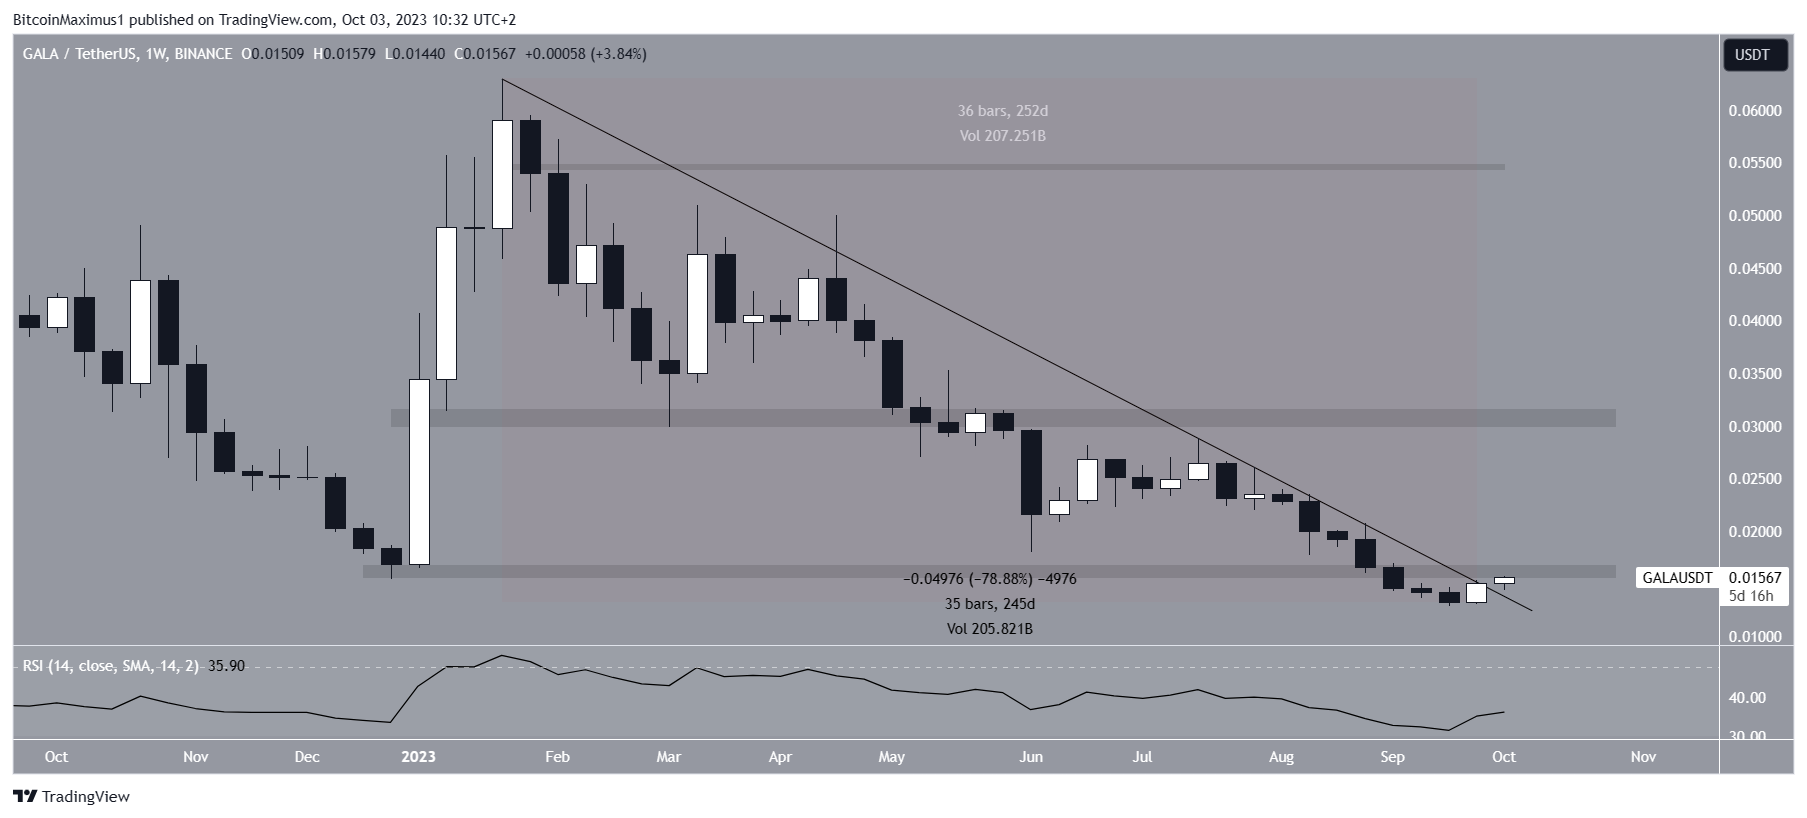
The weekly RSI does not determine the trend’s direction. With the RSI as a momentum indicator, traders can determine whether a market is overbought or oversold and decide whether to accumulate or sell an asset.
Bulls have an advantage if the RSI reading is above 50 and the trend is upward, but if the reading is below 50, the opposite is true. While the indicator is increasing, it is still below 50. The mixed signs do not provide clarity for the future trend.
GALA Price Prediction: Will Bullish Divergence Start Trend Reversal?
While the weekly timeframe outlook is still undetermined, the readings from the daily one are more bullish. There are two main reasons for this.
Firstly, GALA broke out from a shorter-term descending resistance trendline and closed above it. The daily close confirms that the breakout is legitimate.
Read More: 9 Best Crypto Demo Accounts For Trading
Secondly, the RSI generated a bullish divergence (green line). A bullish divergence occurs when a price decrease is combined with a momentum increase. It often precedes bullish trend reversals. The RSI is now above 50, another sign of a bullish trend.
If the increase continues, the next resistance will be at $0.021, 30% above the current price.
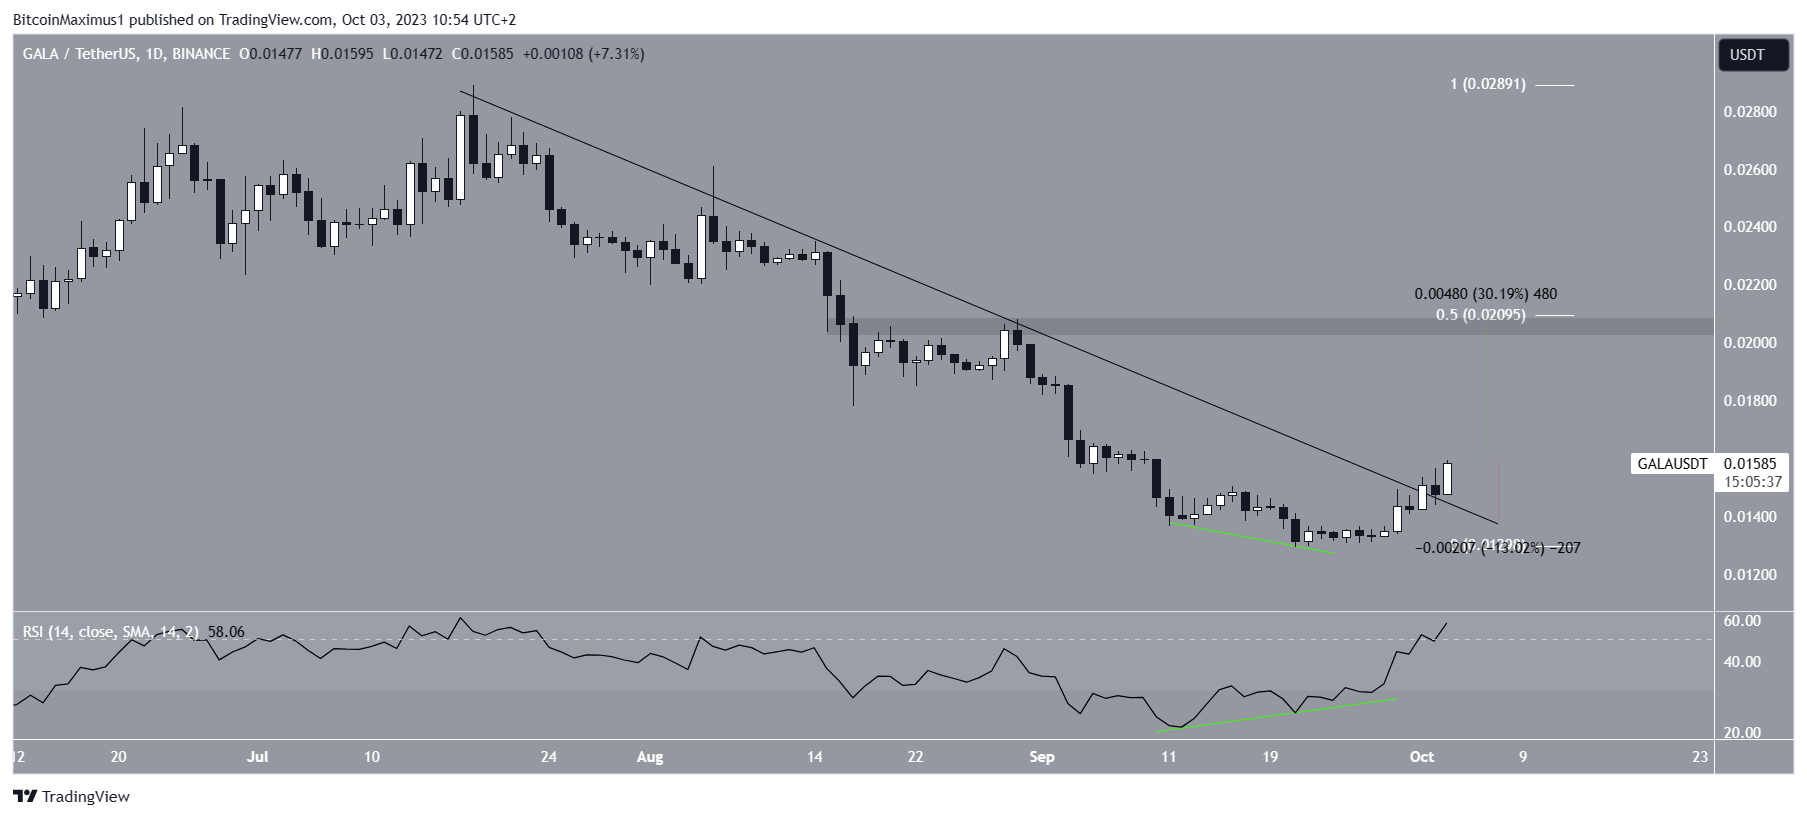
Despite this bullish GALA price prediction, a sudden loss of momentum could take the price back to the descending resistance line, validating it as support in the process.
The line is at $0.014, 13% below the current price.
For BeInCrypto’s latest crypto market analysis, click here


