


The Frax Share (FXS) price broke out from a 230-day long-term descending resistance trendline, gaining 7% in one day as the market experienced a bearish sell-off.
Besides the long-term breakout, the price also cleared a short-term descending resistance trendline. Is there more in the tank?
Frax Share Clears Long-Term Resistance
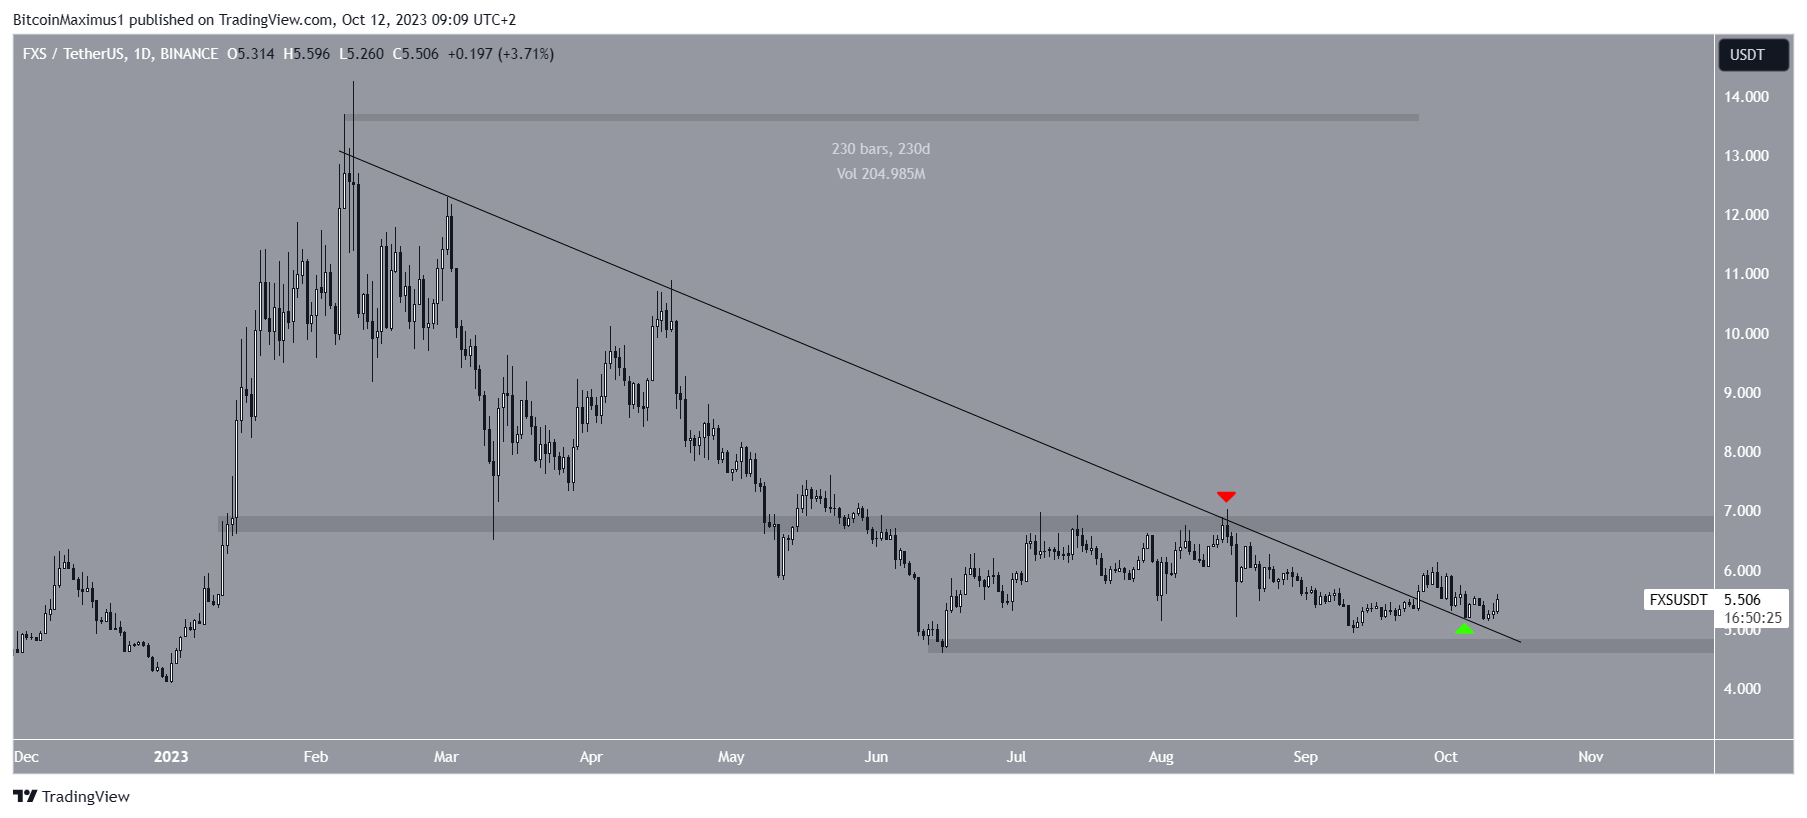
The FXS price had fallen under a descending resistance trendline since February. The decrease led to a low of $4.60 on June 15.
After initiating an upward movement, the price was rejected by the trendline again on August 15 (red icon). Nevertheless, it created a higher low in September and then broke out from the resistance trendline.
At the time of the breakout, the trendline had been in place for 230 days.
After breaking out, the FXS price returned to validate the trendline as support (green icon) and seemingly began an upward movement on October 12.
Despite the increase, the altcoin still trades very close to its pre-breakout levels.
Launch of New Staking Vault Incentives Holders
It is possible that the launch of sFRAX aided the ongoing increase. sFrax is a staking vault that aims to capitalize on the surge in Treasury Yields. Users can stake FRAX and earn the Treasury Bill Yield on it. This is likely to start at 10%.
According to Frax Shares’ founder Sam Kazemian, the yield could tappers off to 5% but will not fall below it.
The Frax ecosystem currently issues three stablecoins: FRAX, FPI, and frxETH. The first one is pegged to the USD, the second one to a basket of consumer goods, and the third one is pegged to the Ethereum price.
FXS Price Prediction: Is the Breakout Legitimate?
The technical analysis from the shorter-term six-hour timeframe supports the continuing of the increase. There are two main reasons for this.
Firstly, the altcoin broke out from a shorter-term descending resistance trendline, legitimizing the breakout from the longer-term one.
Read More: 9 Best Crypto Demo Accounts For Trading
Secondly, the Relative Strength Index (RSI) broke out from its own trendline (green).
When evaluating market conditions, traders use the RSI as a momentum indicator to determine if a market is overbought or oversold and to decide whether to accumulate or sell an asset.
If the RSI reading is above 50 and the trend is upward, bulls still have an advantage, but if the reading is below 50, the opposite is true.
Besides the breakout, the RSI is above 50 and increasing, both signs of a bullish trend.
If the upward movement continues, the FXS price can increase by another 11% and reach the $6.10 horizontal resistance area.
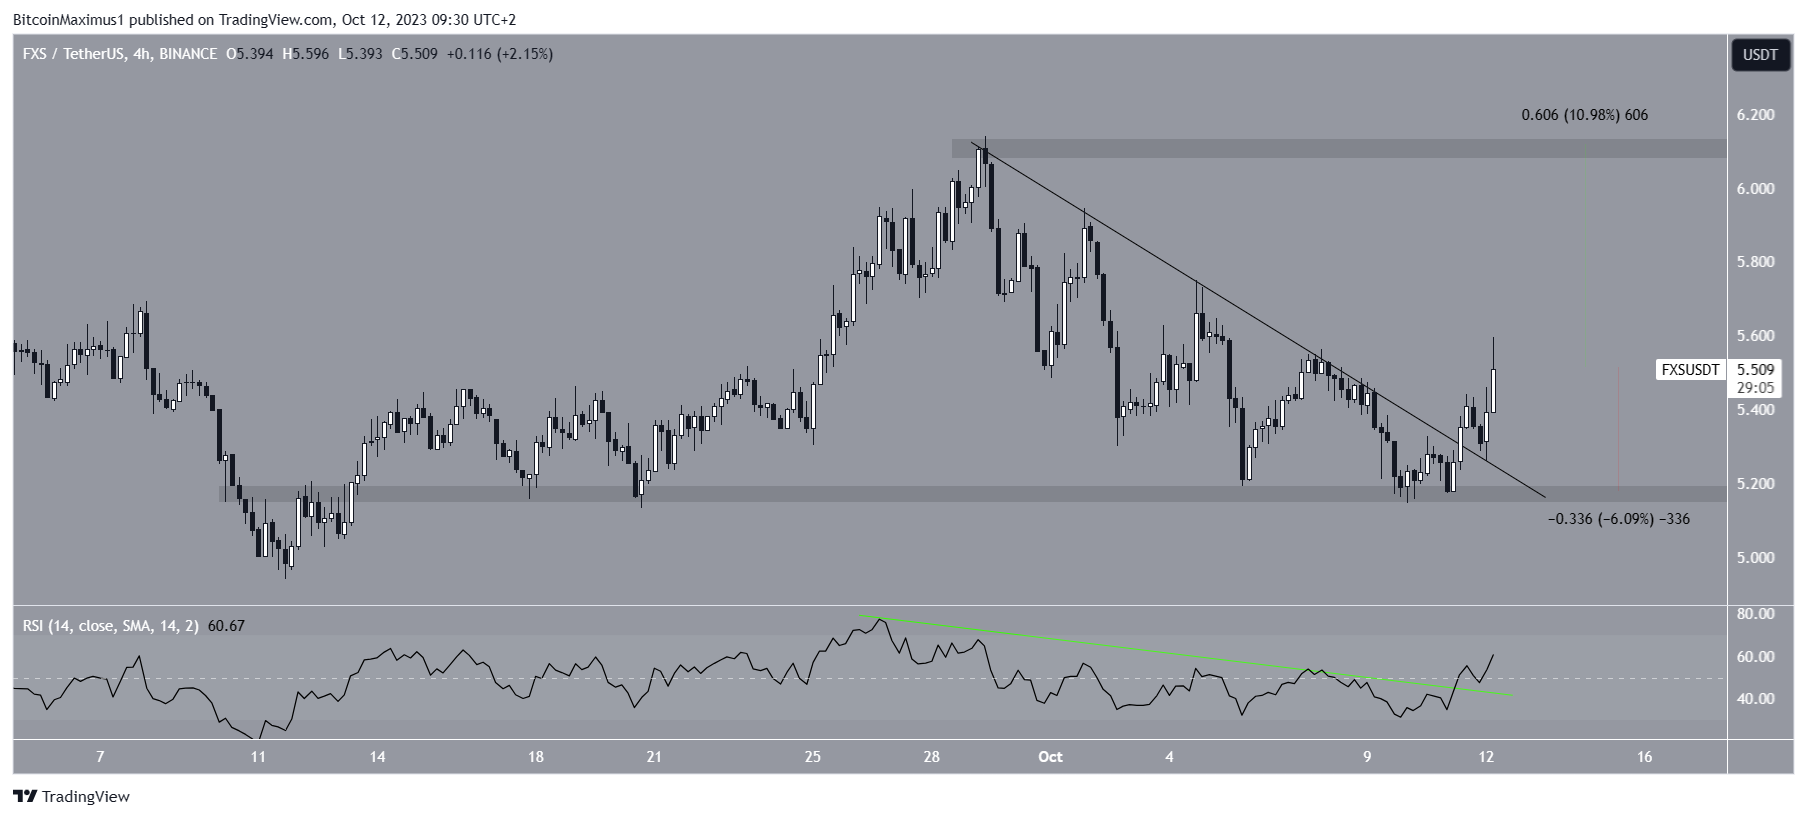
Despite this bullish FXS price prediction, failure to sustain the increase can lead to a 6% drop to the closest horizontal area at $5.20. This will also coincide with the previous descending resistance trendline.
For BeInCrypto’s latest crypto market analysis, click here.


