

Ethereum’s (ETH) RSI gave a bearish sign for the first time this week, legitimizing the downward movement that has been ongoing since April.
While the ETH/USD chart is bearish, ETH/BTC gives bullish signs that could precede a significant breakout.
Ethereum’s RSI Gives Bearish Signal for the First Time This Year
The weekly time frame technical analysis for Ethereum is bearish due to both the price action and RSI readings.
The ETH price deviated above the $1,950 horizontal resistance area at the beginning of April (red circle). Afterward, it fell below it and validated the area as resistance in July (red icon).
Both the deviation and validation of the area as resistance are considered bearish signs and are expected to lead to more downside. The price has fallen since and is currently trading at $1,635.
If the downward movement continues, ETH can fall to an ascending support line at $1,500. The line has been in place since May 2022. Since the line has been in place for such a long time, the price will likely bounce once it gets there.
It is worth mentioning that Ethereum’s founder Vitalik Buterin, sold all his MakerDAO (MKR) tokens for 353 ETH. There are speculations that this occurred because of the latter’s praise of the Solana blockchain. Also, Matter Labs co-founder proposed an “Ethereum Supreme Court” to act as the ultimate judicial system for the Ethereum network.
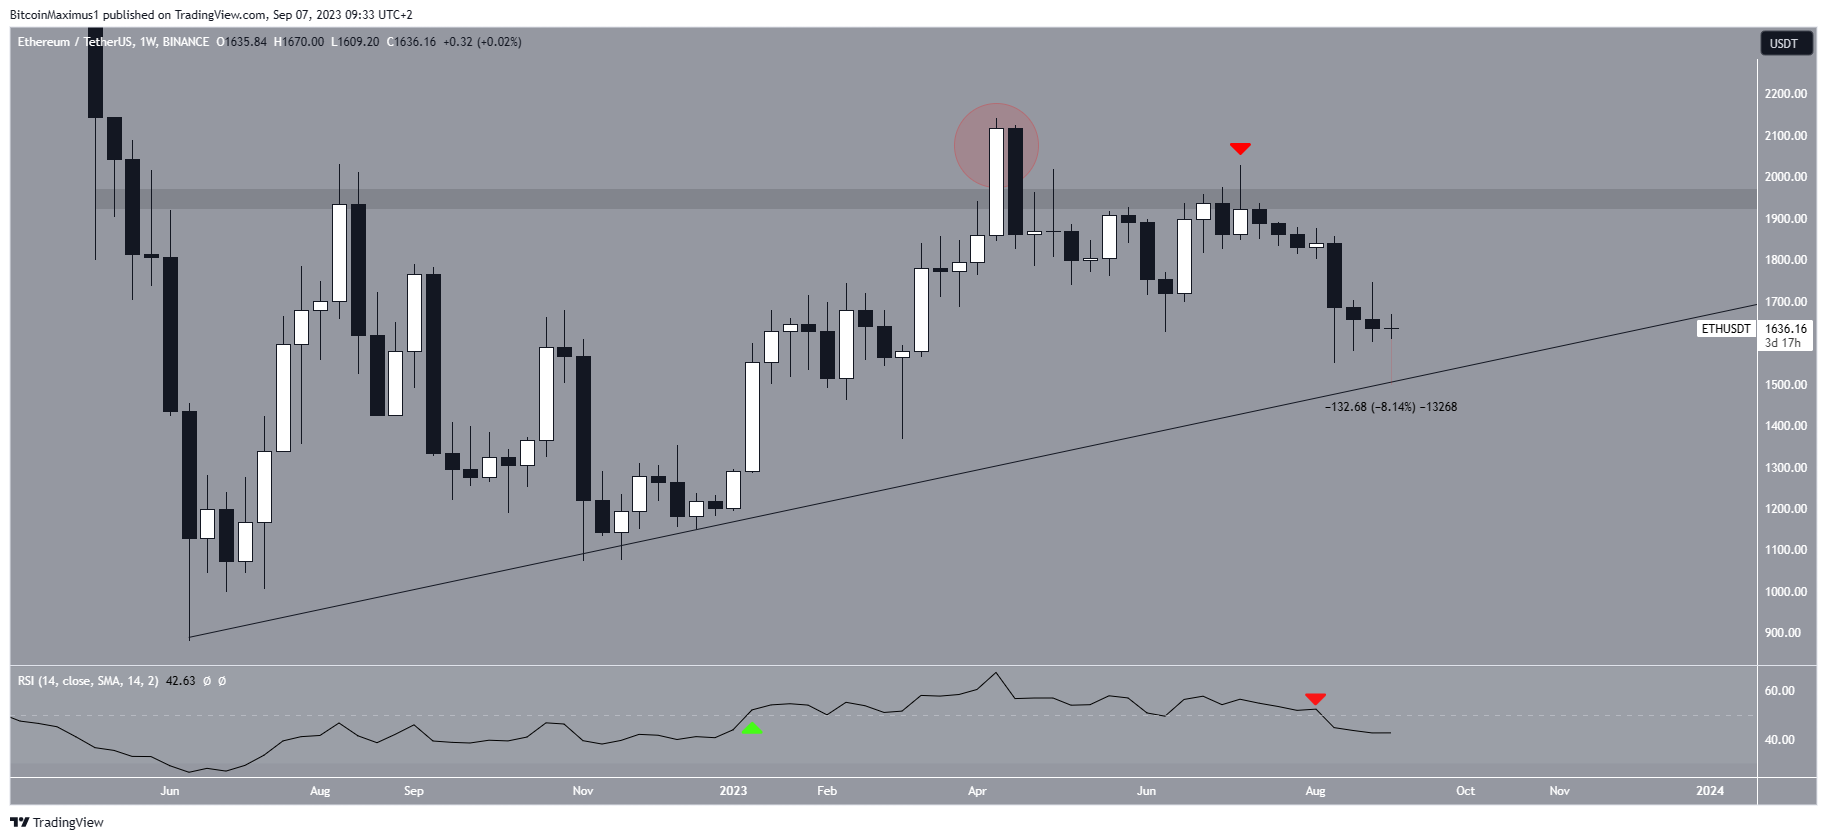
Similarly to the price action, the RSI is also bearish. Market traders use the RSI as a momentum indicator to identify overbought or oversold conditions and to decide whether to accumulate or sell an asset.
Readings above 50 and an upward trend indicate that bulls still have an advantage, whereas readings below 50 suggest the opposite. The RSI is a momentum indicator used by traders to evaluate whether a market is overbought or oversold and to determine whether to accumulate or sell an asset.
The RSI fell below 50 at the beginning of August (red icon). This is the first time it has done so this year. The decrease below 50 is considered a bearish sign, suggesting that the trend is bearish.
Check out the 9 Best AI Crypto Trading Bots to Maximize Your Profits.
Will Ethereum Gain Against Bitcoin (BTC)?
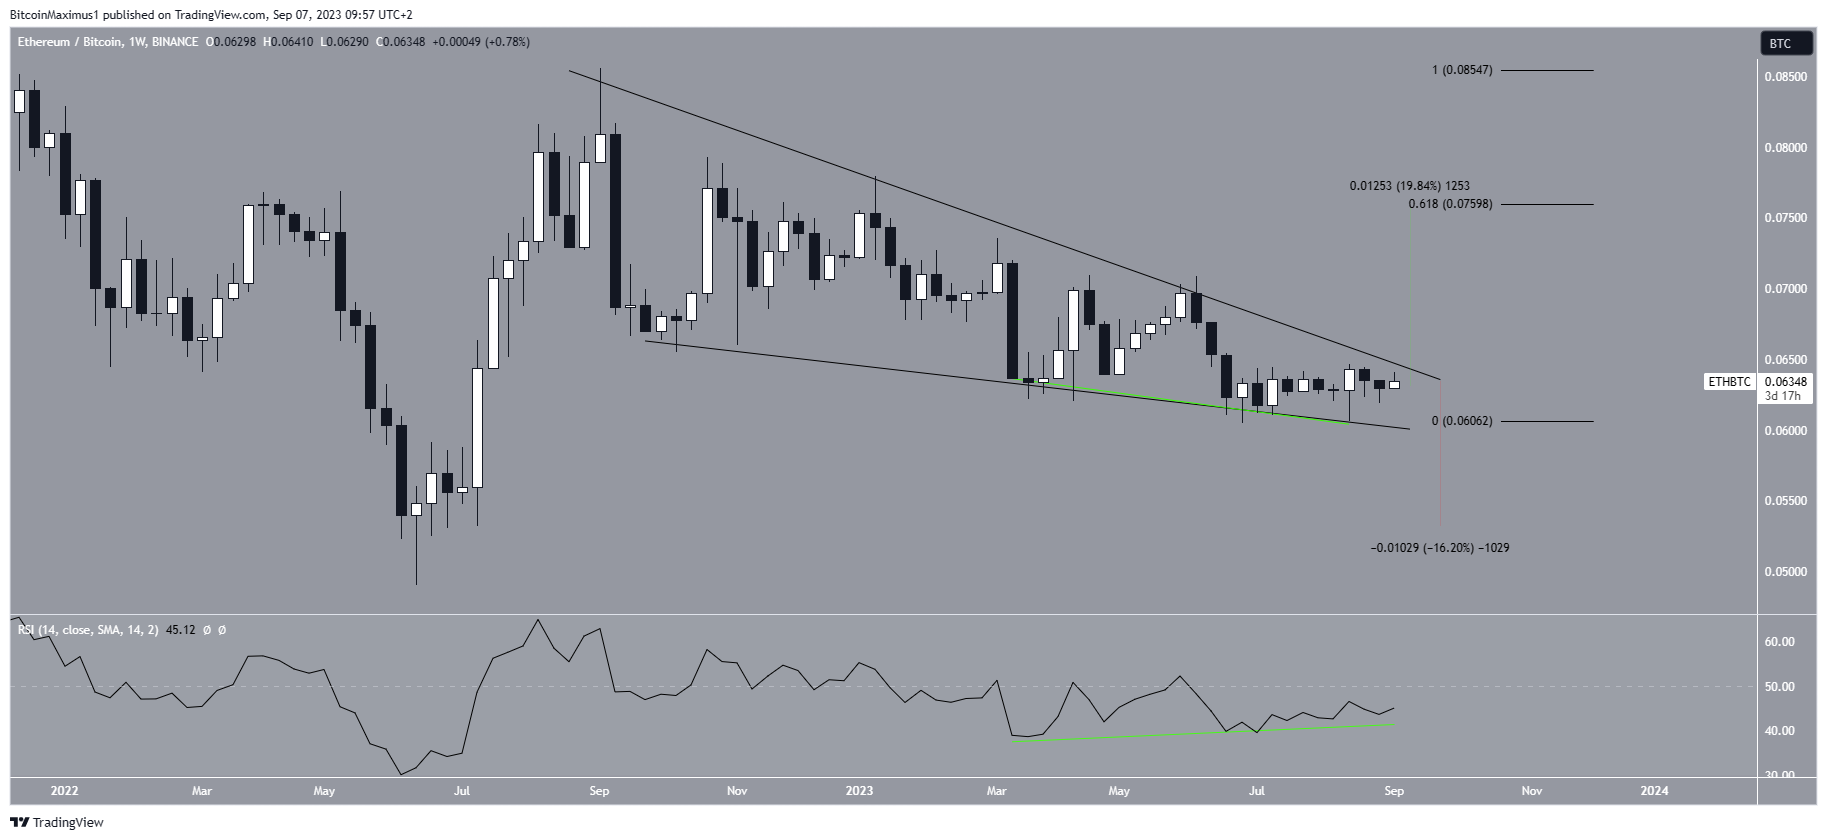
While the ETH/USD chart is bearish, the ETH/BTC one is still bush. This is because of both the price action and the RSI readings.
The price action shows that ETH has fallen inside a descending wedge since September 2022. The descending wedge is considered a bullish pattern, which is expected to lead to breakouts most of the time. The price is nearing the end of the wedge, at which time a decisive movement is expected to occur.
The weekly RSI has generated a bullish divergence for nearly four months. Divergences that transpire for such a long period of time often lead to a significant breakout.
If ETH breaks out, the price can increase by at least 20% to the 0.618 Fib retracement resistance level at ₿0.076. On the other hand, a breakdown from the wedge could lead to a 16% drop to ₿0.053.
Therefore, the ETH/USD price prediction is bearish, while the ETH/BTC one is bullish.
Reclaiming the $1,950 horizontal area will turn the former bullish, while breaking down from the wedge will turn the latter bearish.
Looking to be profitable? Learn How To Make Money in a Bear Market.
For BeInCrypto’s latest crypto market analysis, click here.
Disclaimer
In line with the Trust Project guidelines, this price analysis article is for informational purposes only and should not be considered financial or investment advice. BeInCrypto is committed to accurate, unbiased reporting, but market conditions are subject to change without notice. Always conduct your own research and consult with a professional before making any financial decisions. Please note that our Terms and Conditions, Privacy Policy, and Disclaimers have been updated.
