


In the previous week, there was a significant recovery in the price of Ethereum (ETH), which temporarily interrupted the preceding downward trend that had been ongoing since April.
The ETH price is currently consolidating within a horizontal range, specifically confined between the levels of $1,650 and $1,950. Given the prevailing short-term pattern, price movement, and wave count, it is more likely that the price will persist in its trajectory toward the upper limit of this range and eventually encounter a breakout.
Ethereum Price Approaches $2,000 Resistance
ETH, the native token of the Ethereum blockchain, was created by Vitalik Buterin. The weekly time frame outlook for Ethereum is bullish, mostly due to the impressive upward movement since June 15.
At the time, the price had just bounced at the $1,650 horizontal support area. The ensuing long lower wick (green icon) validated the $1,650 support area and indicated that buyers are taking over.
Such wicks are considered bullish signs since they indicate that sellers could not push the price down.
The ETH price has increased since then, culminating with a high of $1,960. The price is now very close to the $2,000 resistance area.
This is the most important resistance area since it is the final one before a new yearly high. Additionally, there is very scarce horizontal resistance above it. So, if the ETH price clears it, it can further accelerate its rate of increase.
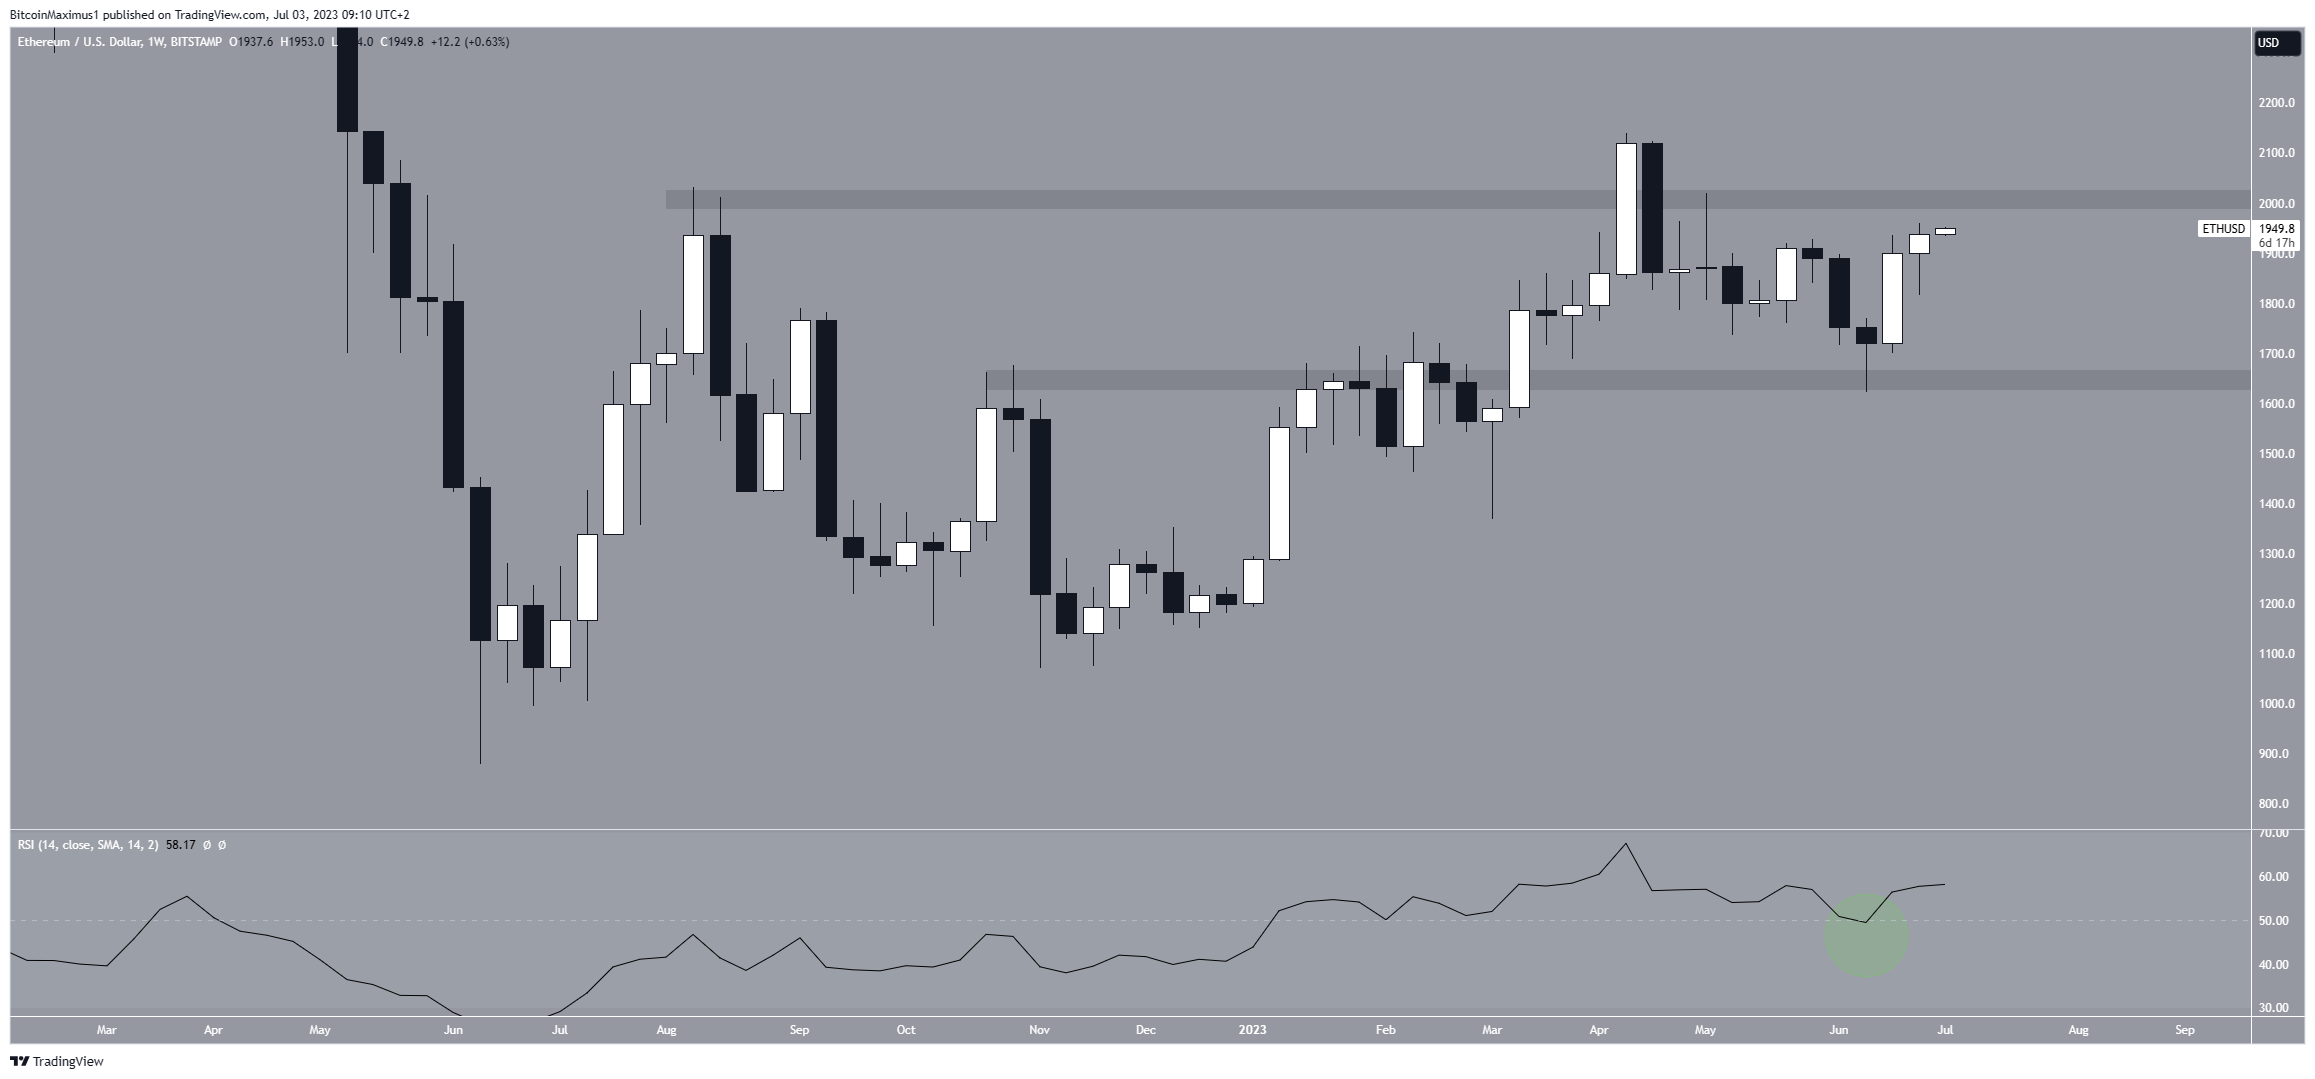
Technical indicators are also bullish. The weekly Relative Strength Index (RSI), a tool traders use to assess market conditions, supports the rebound.
The RSI value above 50 and an upward trend indicate a favorable position for the bulls, whereas a value below 50 suggests the opposite.
When the price rebounded, the RSI also bounced at the 50 line (highlighted by the green circle). This signals a bullish trend. The RSI is in an upward trend, suggesting the same for the ETH price.
Read More: Best Upcoming Airdrops in 2023
ETH Price Prediction: Wave Count Suggests Price Will Clear $2,000
The short-term daily timeframe analysis presents a decisively bullish Ethereum price prediction. This forecast primarily relies on the examination of price action and Elliot Wave patterns.
The most likely wave count suggests the ETH price began a five-wave upward movement (white) in November 2022. Then, the decrease inside a descending parallel channel was the corrective wave two.
The sub-wave count is given in black, showing a completed correction. The fact that the price bounced at the 0.5 Fib retracement support level supports this possibility.
So, the increase since June 15 is part of wave three, which is usually the sharpest of the bullish waves. Giving waves one and three a 1:1 ratio would lead to an increase to $2,700. Measuring from the current price, this would amount to an upward movement of 37%
The sub-wave count is given in black. It suggests that a brief retracement could ensue, after which the rate of increase can accelerate further.
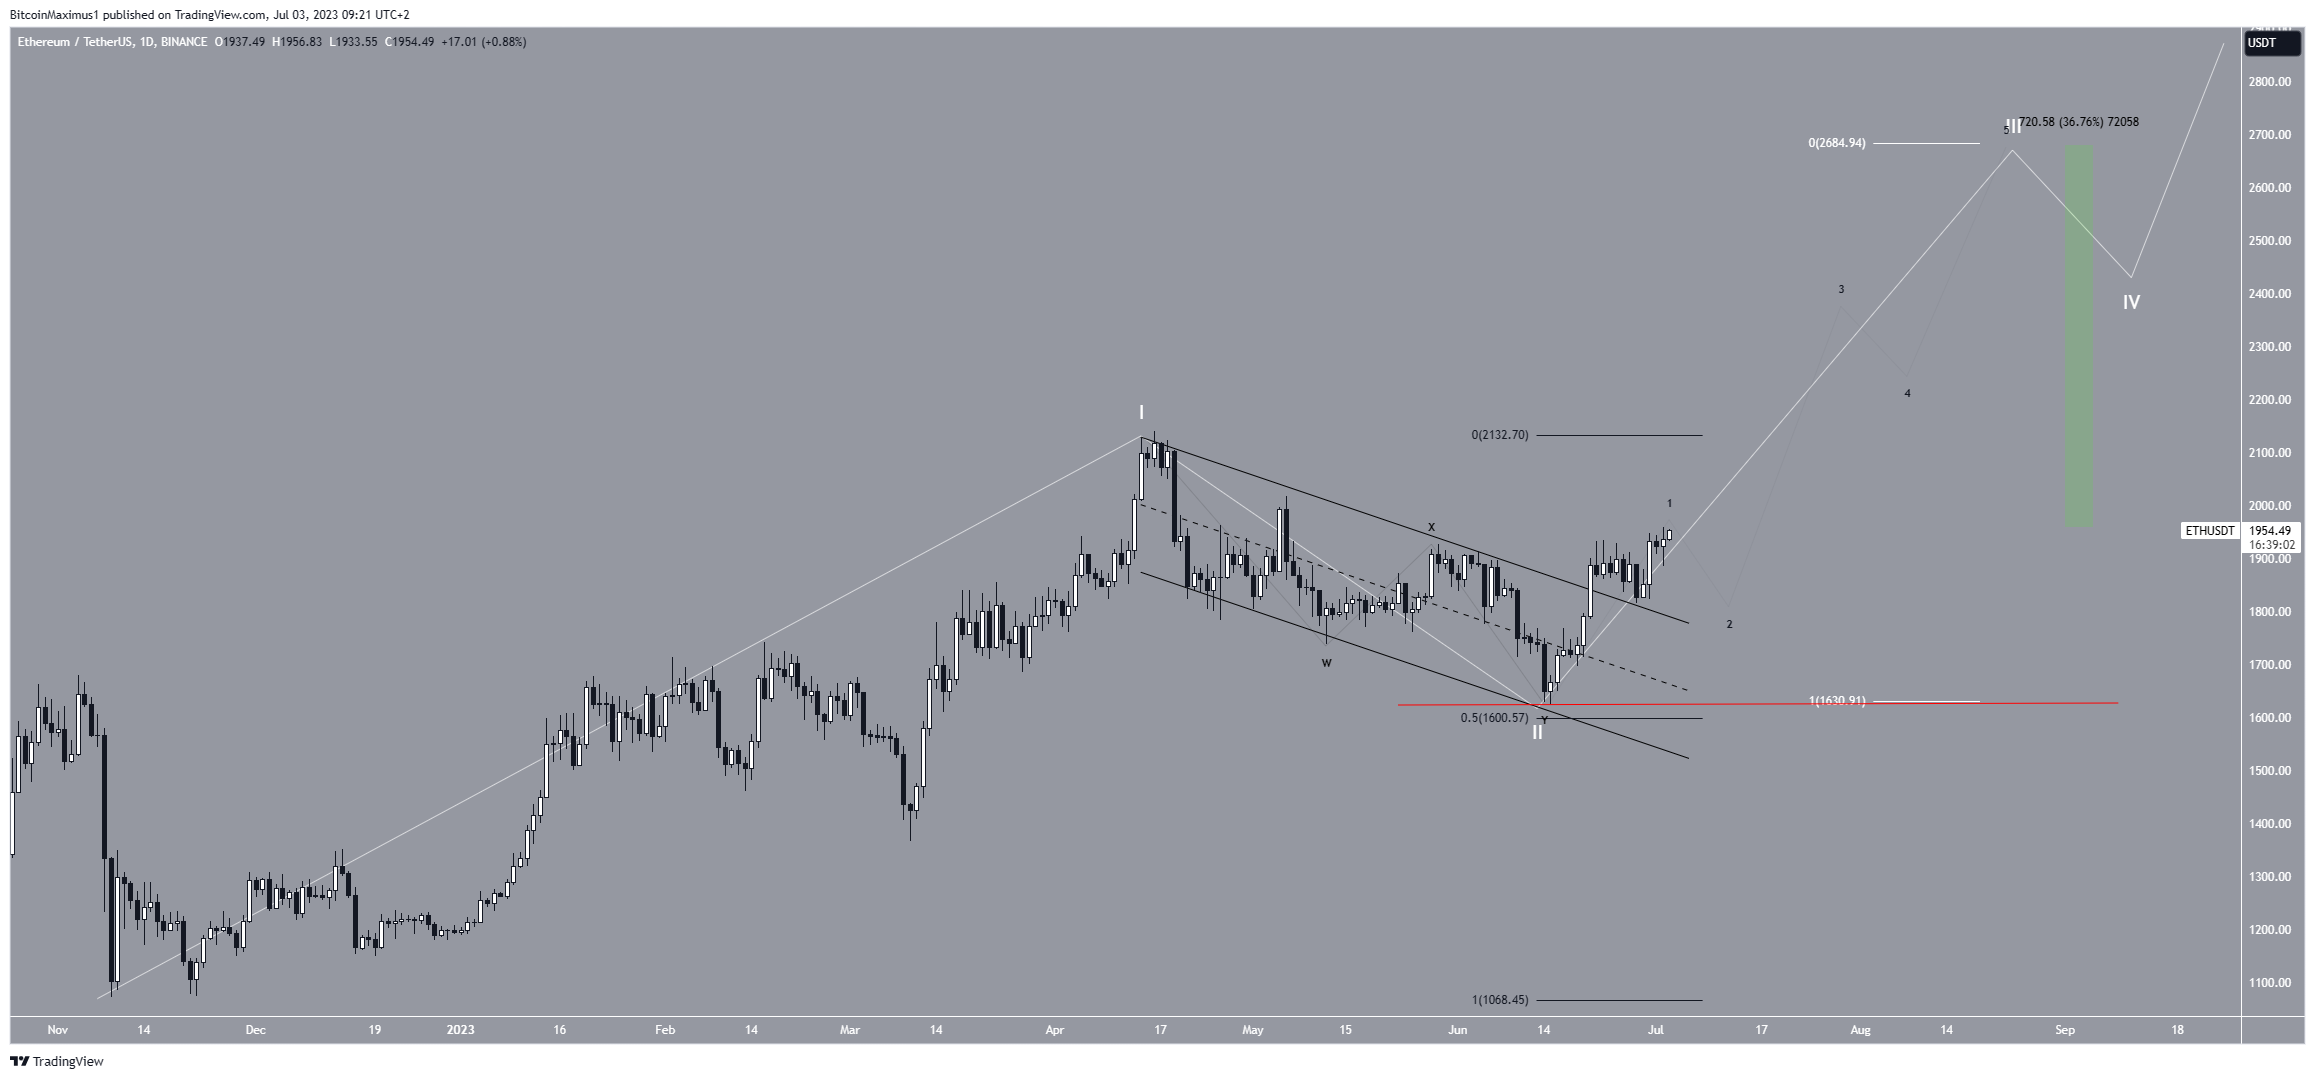
Despite this bullish ETH price prediction, falling below the wave two low (red line) of $1,625 will mean that the trend is bearish.
A drop to the next closest support at $1,300 will be expected in that case.
More From BeInCrypto: 9 Best AI Crypto Trading Bots to Maximize Your Profits


