


The DOGE price is trading inside a long-term bearish pattern. A breakdown from it could trigger a 50% price decrease.
The readings from both the weekly and daily timeframes are bearish, supporting the possibility of a breakdown.
Dogecoin Price Trades Above Critical Support
The technical analysis from the weekly time frame shows that the DOGE price has traded slightly above the $0.059 horizontal support area since June 2022. The support area has been validated numerous times so far, increasing its validity. The two most recent validations (green icons) created long lower wicks, considered signs of buying pressure.
Despite this seemingly bullish price action, DOGE has also fallen under a descending resistance line since November 2022. When combined with the $0.059 horizontal support area, this created a descending triangle, considered a bearish pattern.
During this time, the DOGE price has created several lower highs, a sign of weakening momentum.
A breakdown that travels the entire height of the pattern (white) would take the DOGE price to $0.030. in order to confirm the breakdown, DOGE has to close below the $0.059 horizontal support area.
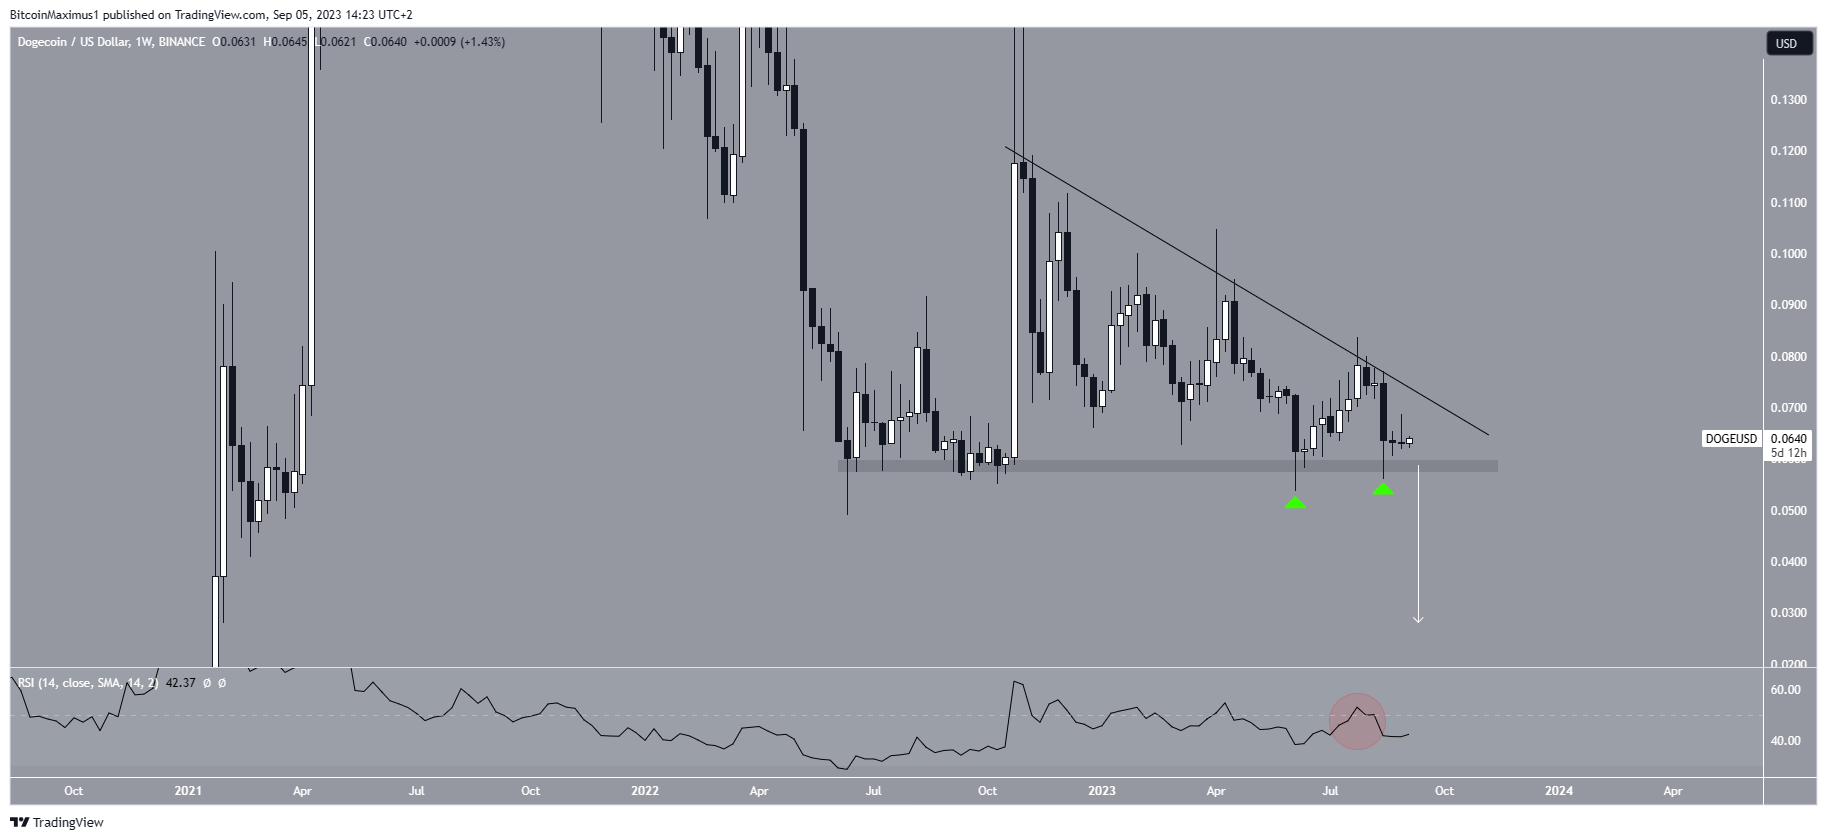
The weekly RSI supports the possibility of a breakdown. With the RSI as a momentum indicator, traders can determine whether a market is overbought or oversold and decide whether to accumulate or sell an asset.
If the RSI reading is above 50 and the trend is upward, bulls have an advantage, but if the reading is below 50, the opposite is true. The indicator is below 50 (red circle) and falling, both signs of a bearish trend.
DOGE Price Prediction: Has the Decrease Already Begun?
Similarly to the weekly timeframe, the daily one provides a bearish DOGE price prediction. This prediction comes from both the price action and RSI readings.
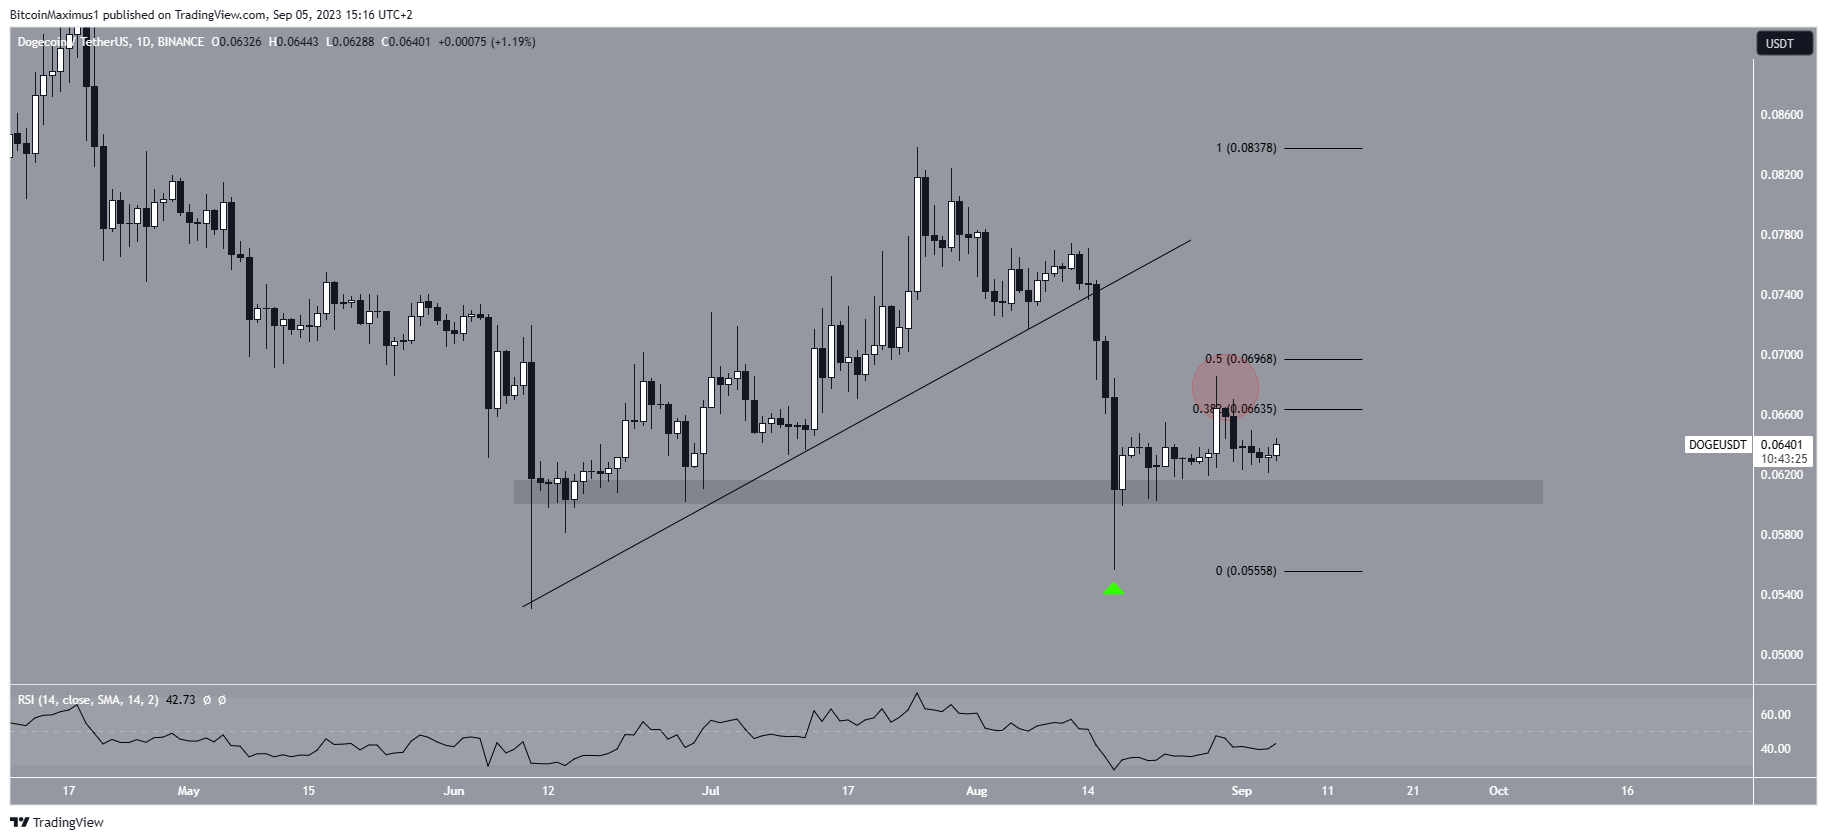
The DOGE price broke down from an ascending support line on August 15 and accelerated its rate of decrease. This is a sign that the previous trend has ended, and the price has now begun a new downward movement.
Check Out the Best Upcoming Airdrops in 2023
The meme coin bounced on August 17 (green icon), validating the $0.059 horizontal support area and creating a long lower wick. However, the price failed to move above the 0.382-0.5 Fib retracement resistance area (red circle).
The theory of Fibonacci retracement levels suggests that after a substantial price move in one direction, the price will partially retrace or return to a prior price level before continuing in its original direction. The rejection and the 0.382 to 0.5 area is a sign that the increase was corrective, and the trend is still bearish.
The daily RSI is also bearish since it was rejected by the 50 line and is now below it.
Therefore, the most likely DOGE price prediction suggests that the price will break down below $0.059 and fall by 50% to the next support at $0.030.
However, a breakout from the long-term resistance line will invalidate this bearish scenario. In that case, DOGE can increase by 90% to the $0.12 resistance area.


