


On November 9, BlackRock filed to launch an Ethereum (ETH) trust. The price increased above $2,000 shortly afterward but fell over the weekend.
Despite the increase, ETH failed to reach a new yearly high by just $4. Will it be possible this week?
Ethereum Rallies After Breakout
The technical analysis from the daily time frame shows that the Ethereum price broke out from a descending resistance trendline on November 5. At the time of the breakout, the trendline had been in place for more than 200 days.
After breaking out, ETH reached a high of $2,136 before falling slightly. The high was slightly below the yearly high of $2,140. The ETH price fell afterward and currently trades at $2,060.
Crypto investing, simplified. Get Ethereum (ETH) price predictions here.
During the increase, the Grayscale Ethereum Fund discount decreased to 14%. This is a significant turnaround since the discount was 60% earlier in the year, and could have occurred because of Blackrock filing for a trust.
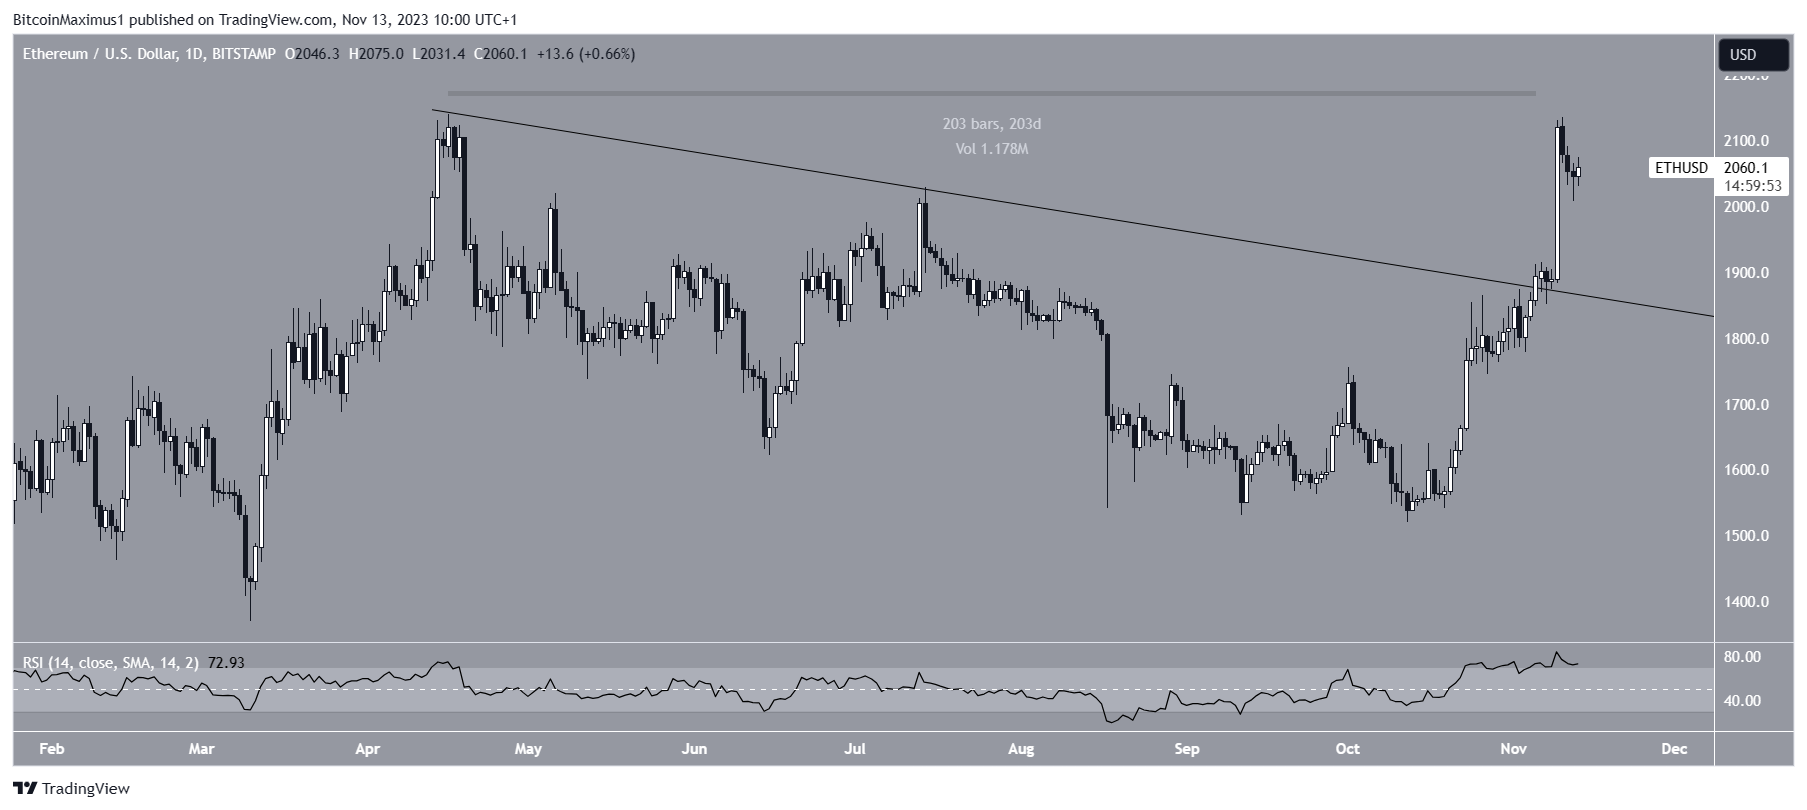
The daily Relative Strength Index (RSI) gives a positive outlook.
Traders use the RSI as a momentum indicator to gauge whether a market is overbought or oversold, helping them make informed decisions on buying or selling assets.
When RSI readings are above 50, and the trend is upward, it suggests that buyers are in control, while readings below 50 indicate the opposite.
The RSI is on the rise and positioned above 50, signaling a bullish trend. Despite being in overbought territory, there are no indications of a bearish divergence that could trigger a decline.
What Are the Analysts Saying?
Cryptocurrency traders on X have a bullish outlook for the future of the ETH price. EmilyKols69 believes that the ETH price trend is bullish since the psychological resistance of $2,000 has been shattered.
52kSkew gives a similar outlook and notes the importance of the $2,000 area.
Pentosh1 believes that the weekly chart indicates that the price will reach a new yearly high since it has not swept its previous highs yet.
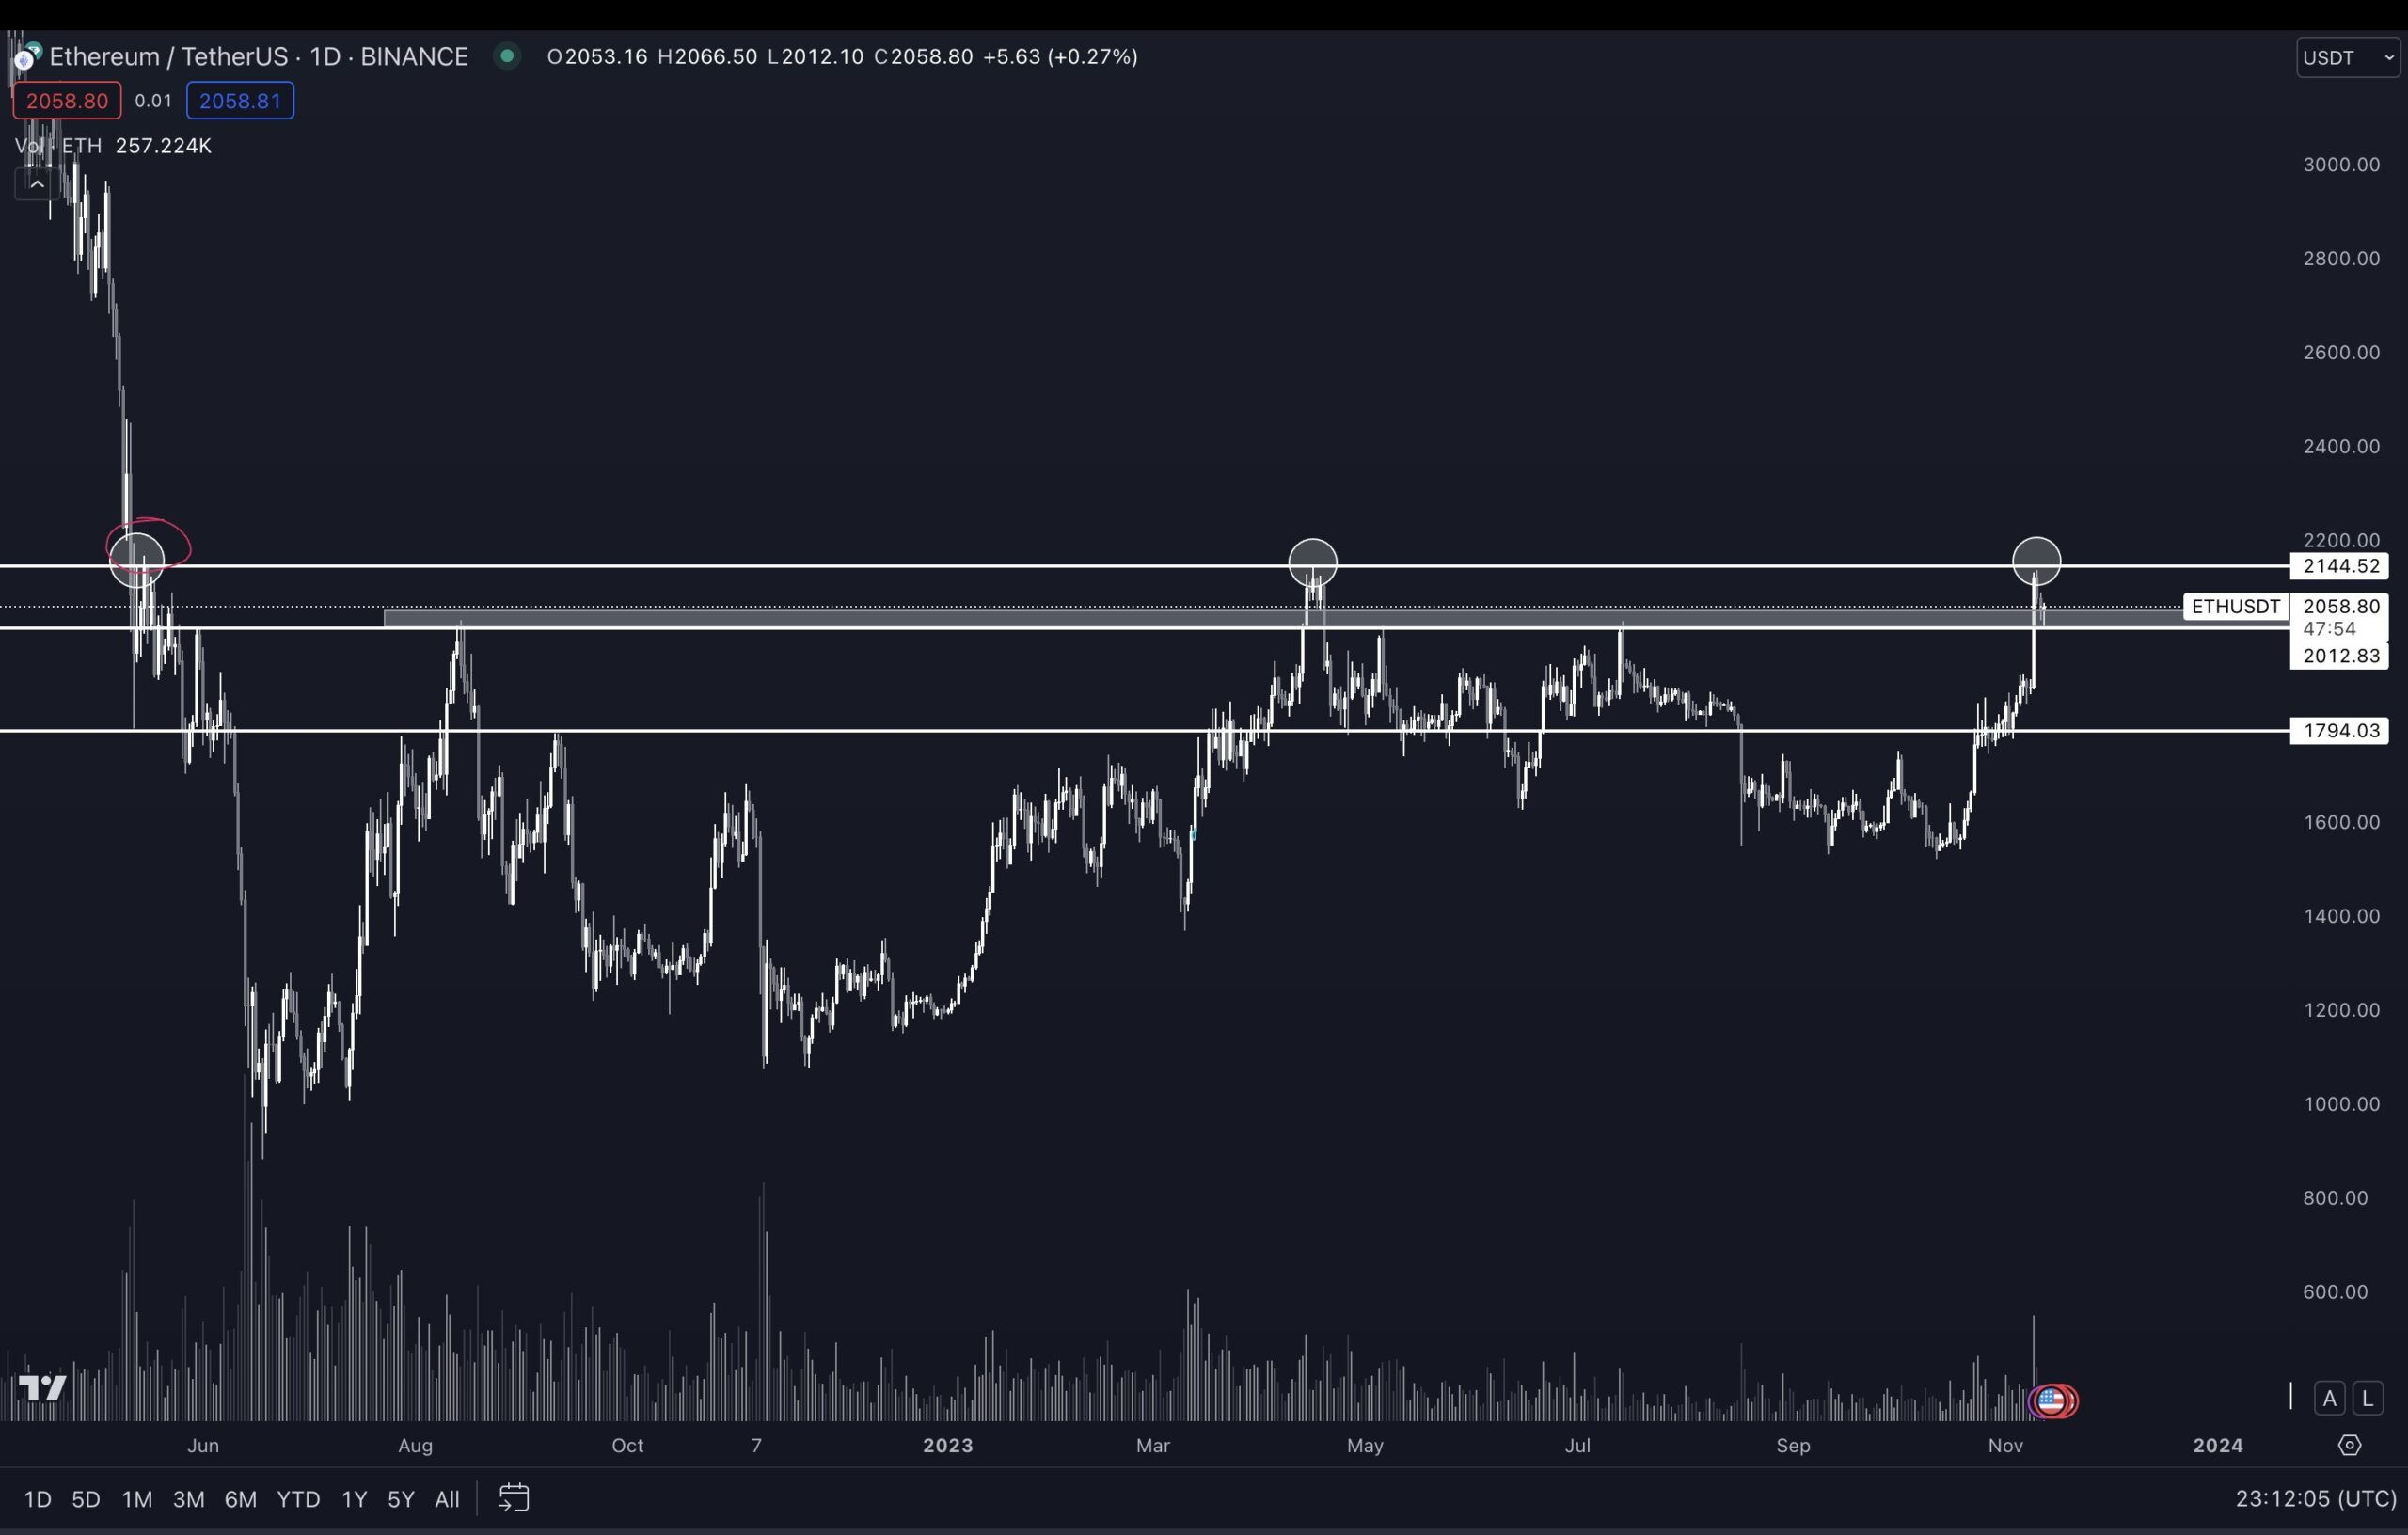
However, on lower timeframes, he believes that a sweep of the $2,000 lows is likely, stating that:
On lower time frames would like to get some size on a sweep of those lows at 2010 chart #2
ETH Price Prediction: Will New Yearly High Be Reached?
Utilizing the Elliott Wave theory, technical analysts study recurring long-term price patterns and investor psychology to ascertain trend directions.
A notably positive outlook is evident in the weekly analysis, corresponding with Ethereum’s price breaking out from long-term horizontal resistance at $1,950.
This analysis suggests that ETH is presently in the third wave of a five-wave upward cycle (black), originating in June 2022.
The sub-wave progression, outlined in white, indicates that ETH is currently within the third sub-wave.
The increase is also supported by the weekly RSI, which has just moved above 50.
Giving waves one and three a 1:1.61 ratio leads to a high of $3,250. This is very close to the long-term resistance at $3,500. Reaching it would require an Ethereum price upward movement of 65%.
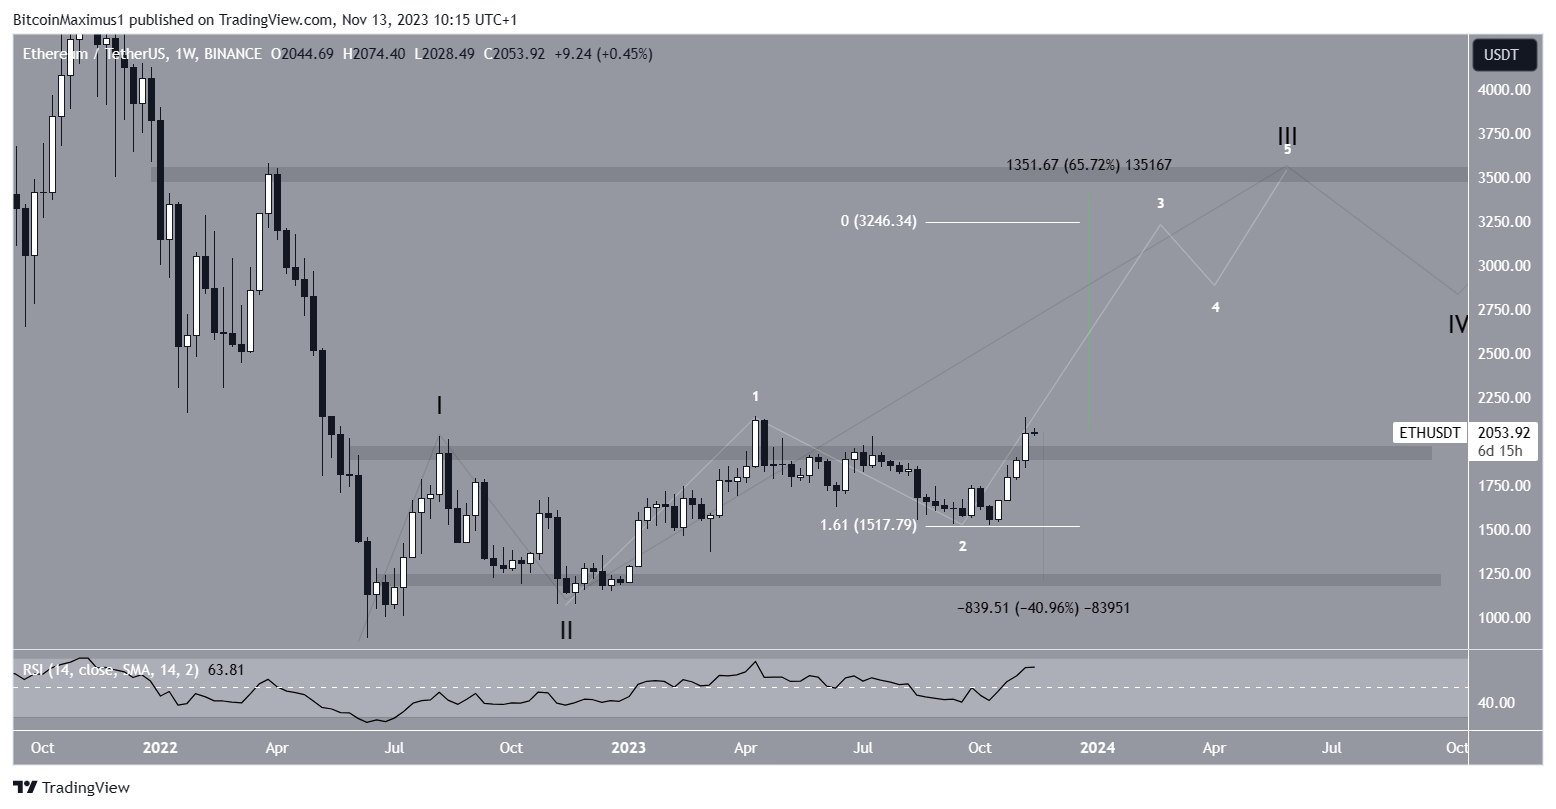
However, it’s crucial to note that despite this bullish ETH price prediction, a weekly close below the $1,950 long-term resistance will invalidate the breakout. A 40% drop to the closest support at $1,200 could occur in that case.
For BeInCrypto‘s latest crypto market analysis, click here.


