


The Ethereum (ETH) price broke out from a 200-day descending resistance trendline yesterday.
The ETH price reached a new yearly high of $1,916 today. How long will it continue to increase?
Ethereum Finally Clears Resistance
The daily time frame technical analysis shows that the Ethereum price had fallen under a descending resistance trendline since its yearly high of $2,141 in April.
The decrease led to a low of $1,520 before the price began, an upward movement that is still ongoing.
Crypto investing, simplified. Get Ethereum (ETH) price predictions here.
On November 5, after falling under the descending resistance trendline for 203 days, the Ethereum price finally broke out. It reached a new yearly high of $1,916 the same day.
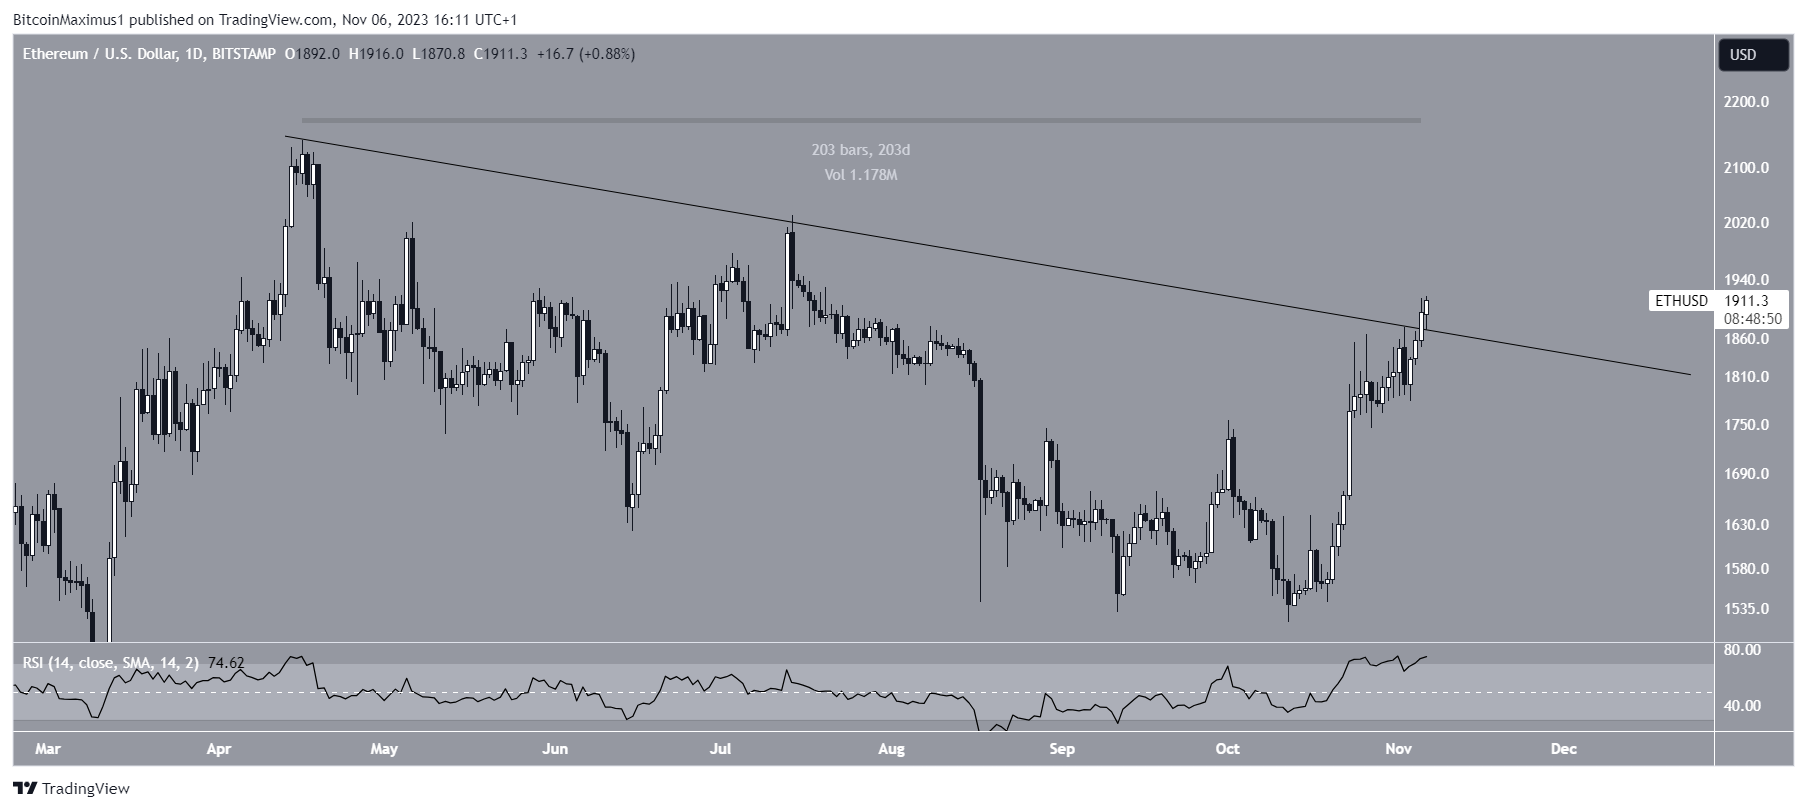
The daily Relative Strength Index (RSI) supports the ongoing upward movement.
RSI is a momentum indicator used by traders to assess whether a market is in an overbought or oversold condition, aiding in their decision to buy or sell an asset.
When RSI readings are above 50 and the trend is upward, it suggests that bulls maintain an advantage, whereas readings below 50 imply the opposite.
Currently, the RSI is rising and sits above 50, both considered indications of a bullish trend. Although the indicator is in overbought territory, there are no signs of a bearish divergence that might trigger a decline.
Check out the 9 best AI crypto trading bots to maximize your profits.
What Are the Analysts Saying?
Cryptocurrency traders on X are predominantly bullish for the future ETH outlook.
BluntzCapital believes that the Elliott Wave count is bullish, and the price has begun a new upward movement. He suggests that while an initial retracement is possible, the ETH price will eventually rally well above $2,000.
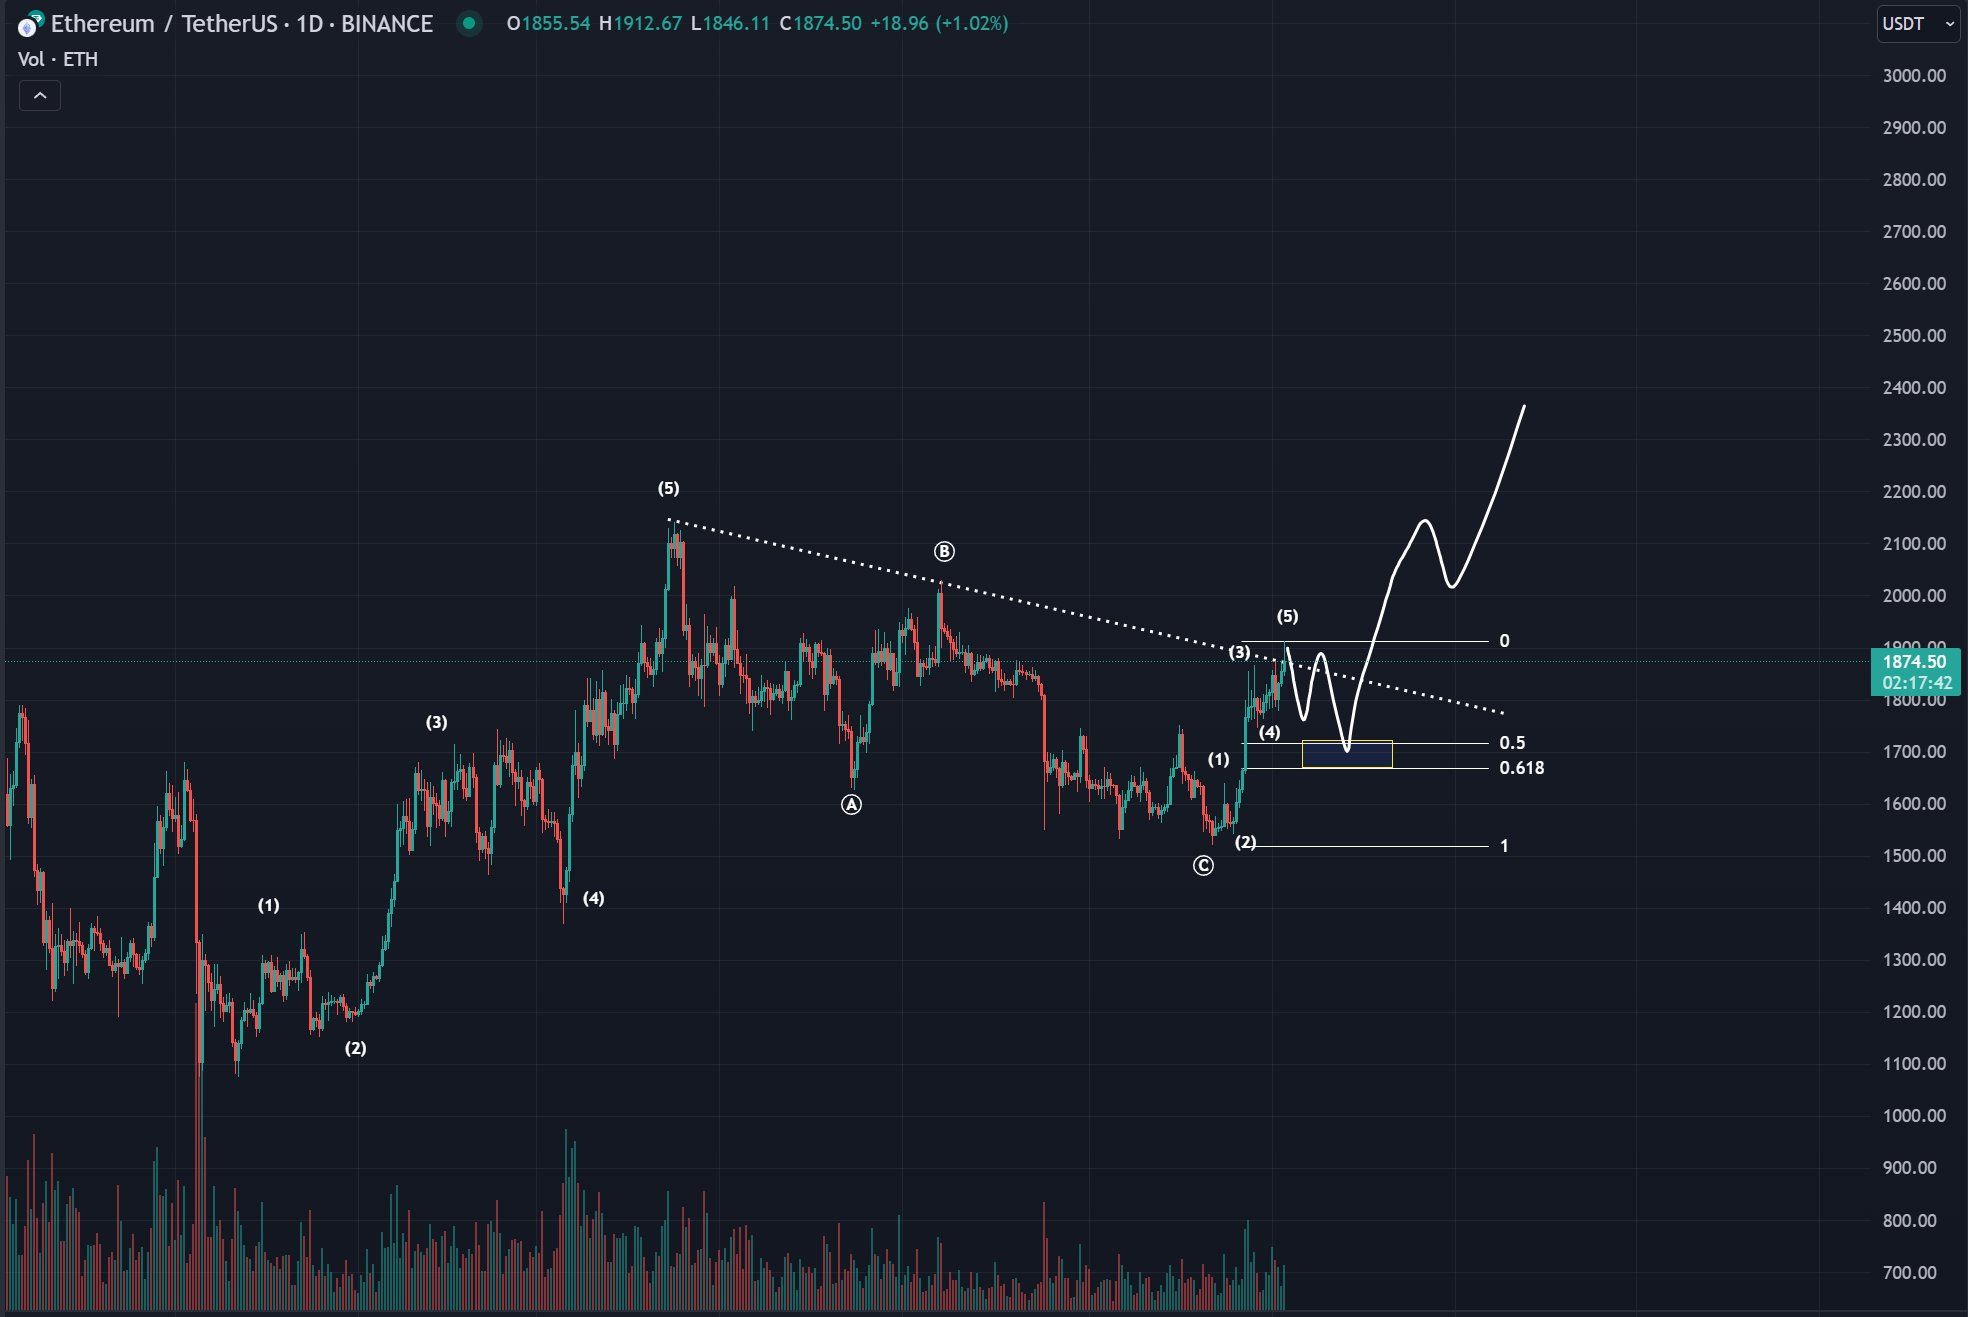
CrediBULL Crypto also posted a very similar count that shows the price will increase above $2,000.
Finally, CryptosBatman believes that an ETH increase will spill over to the rest of the altcoin market, stating that:
Get ready for altseason when $ETH breaks above $2,000. Then it’s time to keep refreshing your portfolio tracker continuously. Only a 5% price increase away now.
ETH Price Prediction: How Long Will Increase Continue?
Utilizing the Elliott Wave theory, technical analysts examine long-term price patterns and investor psychology that recur to determine the direction of a trend.
The weekly analysis presents an overwhelmingly positive outlook, aligning with the Ethereum price breakout from the 200-day resistance trendline.
It indicates that ETH is currently in the third wave of a long-term five-wave upward cycle (black) that commenced back in June 2022.
The sub-wave progression is detailed in white, suggesting that ETH is within the third sub-wave.
Given that the third wave is typically the one most likely to extend significantly, there is potential for a rapid acceleration in the price if this analysis proves accurate.
On the weekly timeframe, the primary hurdle lies at $1,950. Should ETH surpass this level, it could potentially surge by 84% to reach the subsequent resistance point at $3,400.
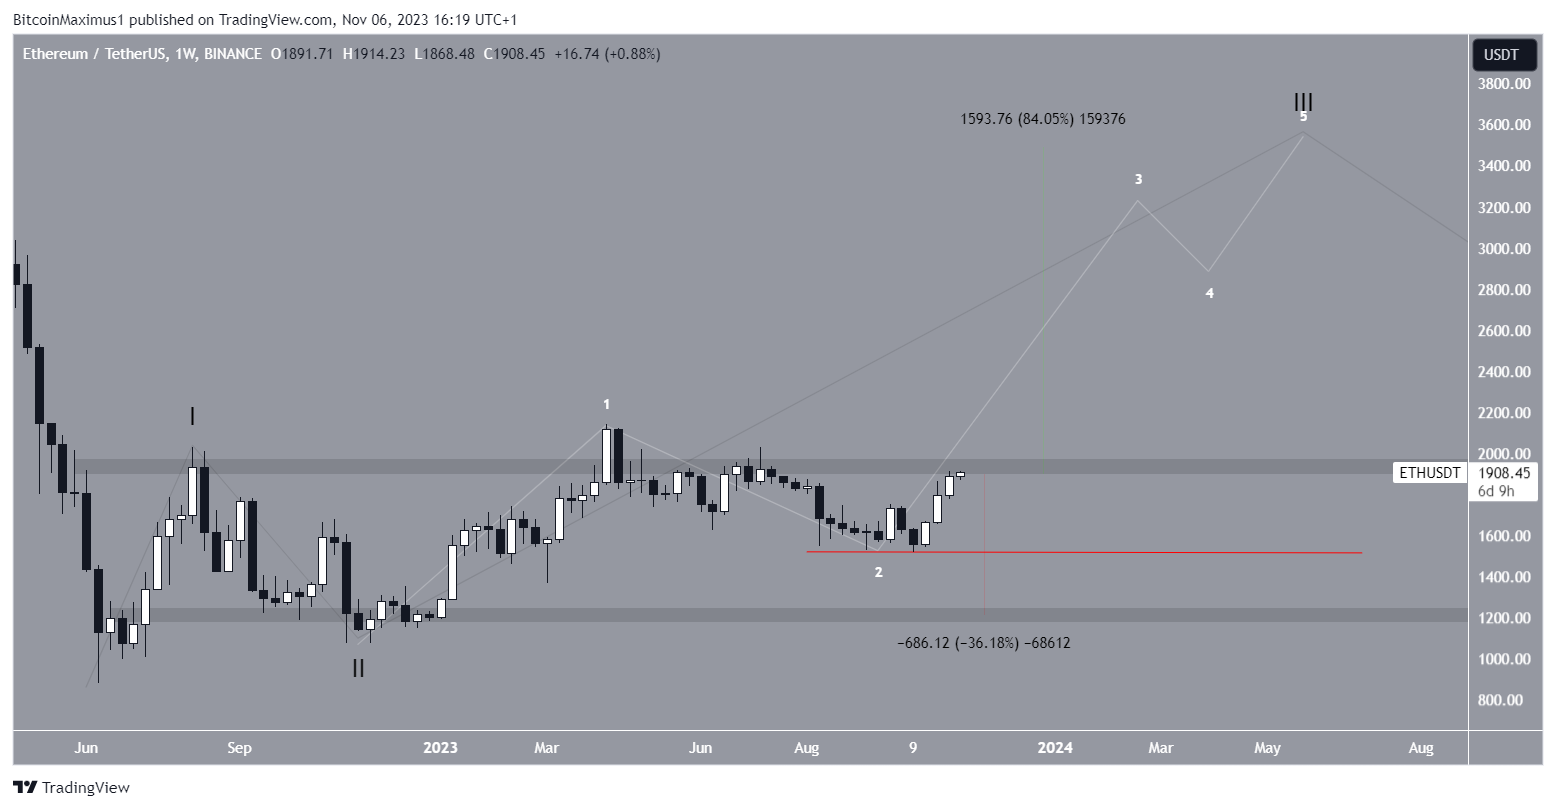
It’s important to note that this bullish ETH price forecast has a caveat. If the price drops below the low of sub-wave two, which is at $1,521, it will negate the current analysis.
In such a scenario, the price of ETH might experience a 36% decline, potentially finding support at the nearest level of $1,200.
Looking to be profitable? Learn how to make money in a bear market.
For BeInCrypto‘s latest crypto market analysis, click here.


