If you want to read a summary of our most recent short-term Cardano (ADA) price analysis and predictions click here!
Is the price of Cardano (ADA) going to go up or down over the next few years?
Regular Price Analysis of Cardano (ADA)
At BeInCrypto, we offer regular price analyses and predictions of the most popular and relevant cryptoassets. We completed a March analysis of Cardano’s price here. In addition, we predicted prices throughout April here. Below is a summary of our most recent short-term price analysis and predictions for Cardano published on Apr 25, 2019:
After reaching highs above $0.1 on Apr 4, the price of Cardano has been on a downtrend.
It is trading inside the descending channel traced below:
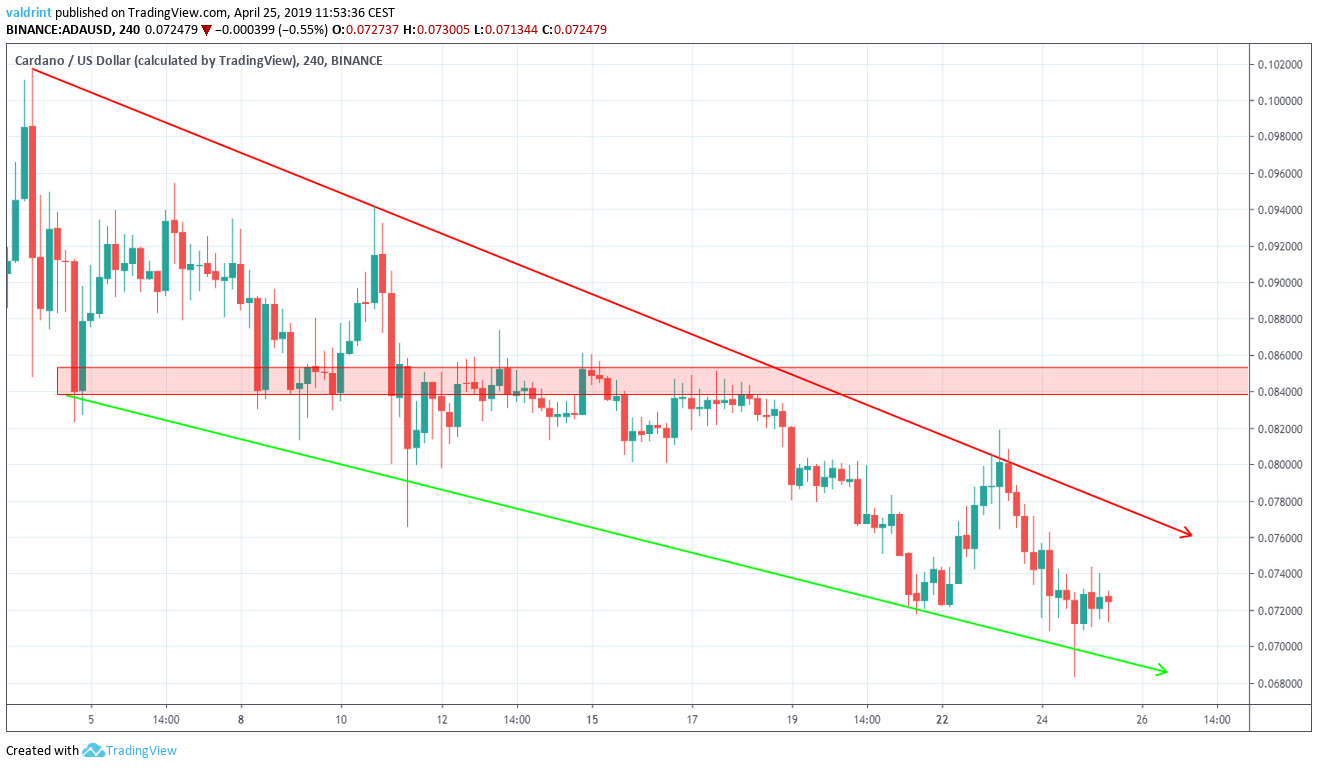 At the time our latest analysis was written on Apr 25, Cardano was trading near $0.072. It’s proximity to the support line and an analysis of several technical indicators led us to predict price increases toward the resistance line.
Over the next several days, our prediction appeared validated. While significant gains were not made, Cardano made a high of over $0.074 on Apr 27.
Price is likely to continue trading within the channel. This would mean continued long-term price losses.
If a breakout were to occur, levels near $0.85 might be reached. We do not expect such an event in the near future.
To read our full Apr 25 ADA/USD and ADA/EUR short-term price analysis, click on the green button below:
At the time our latest analysis was written on Apr 25, Cardano was trading near $0.072. It’s proximity to the support line and an analysis of several technical indicators led us to predict price increases toward the resistance line.
Over the next several days, our prediction appeared validated. While significant gains were not made, Cardano made a high of over $0.074 on Apr 27.
Price is likely to continue trading within the channel. This would mean continued long-term price losses.
If a breakout were to occur, levels near $0.85 might be reached. We do not expect such an event in the near future.
To read our full Apr 25 ADA/USD and ADA/EUR short-term price analysis, click on the green button below:
Fundamental Analysis
Similar to Ethereum (ETH), EOS (EOS), and Tron (TRX), Cardano introduces smart contracts into the blockchain ecosystem. Furthermore, Cardano currently displays centralization in various aspects of its governance like these other digital assets. Nonetheless, one major difference between Cardano and other second-generation digital assets is that Cardano aims to become truly decentralized. It does this in several ways including transparent reporting, regular auditing, and the publication of peer-reviewed papers. Developers are currently creating what purports to be the most advanced and powerful smart contract platform protocol ever created, thanks to a foundation rooted in scientific philosophy and an approach that places research and product before hype and marketing.
Daedalus and Nano Ledger S
Cardano’s native wallet is called Daedalus and is a user-friendly, safe, multi-platform, and hierarchical deterministic wallet for ADA. It is easy to install and easy to use, taking the complication our of setting up an ADA wallet for users inexperienced at ‘being their own bank.’ For a period, Daedalus was the only wallet supporting Cardano (ADA). However, more wallets have begun offering support. Even hard wallets like the Nano Ledger S have recently begun supporting ADA.Three Teams Aiming for Decentralization
Cardano is supported by three separate organizations. They have their own leadership structure and are independent of one another. However, they each work toward the same purpose: the adoption of the Cardano platform, the growth of the Cardano community, and increased usage of ADA. The organizations are:- The Cardano Foundation which oversees the development of the Cardano ecosystem
- Input Output HK (IOHK) which is responsible for developing, building, and maintianing the Cardano platform until at least 2020
- Emurgo: A venture capital firm which seeks to raise funds for the development of Cardano and establish commercial partnerships and ventures between Cardano and other entities
 There is no other digital asset working to do this. On the contrary, Ethereum (ETH), Tron (TRX), EOS (EOS), NEM (NEM), and many other second-generation digital assets have Foundations which maintain centralized control over the respective network, platform, and ecosystem.
The Cardano Foundation does not maintain centralized control or authority over Cardano. Central to the goal of Cardano is growing decentralization.
There is no other digital asset working to do this. On the contrary, Ethereum (ETH), Tron (TRX), EOS (EOS), NEM (NEM), and many other second-generation digital assets have Foundations which maintain centralized control over the respective network, platform, and ecosystem.
The Cardano Foundation does not maintain centralized control or authority over Cardano. Central to the goal of Cardano is growing decentralization.
Academic Papers and Audits
Thanks to its focus on peer-review and academic-level research, Cardano is backed by a library of audits, reports, and academic papers. Unlike many other altcoins, the words printed on the papers describing Cardano are far more than a collection of buzzwords next to pictures of robots and astronauts. IOHK also provides weekly technical reports on Cardano’s development, ensuring that work behind the scenes is indeed continually going on. There are also Haskell library reports, Cardano audit reports, and ADA distribution audits ready for your perusal and are publicly available.
On Dec 8, 2017, ADA reached a low of $0.078. A sharp increase followed and led to a high of $1.39 on Jan 5, 2018. Afterward, the price began a gradual decrease, which led to a low of $0.12 on Mar 18.
Another upward move followed, and price made a high of $0.413 on May 3.
After a long downtrend, the price made the current low of $0.027 on Dec 7.
There are also Haskell library reports, Cardano audit reports, and ADA distribution audits ready for your perusal and are publicly available.
On Dec 8, 2017, ADA reached a low of $0.078. A sharp increase followed and led to a high of $1.39 on Jan 5, 2018. Afterward, the price began a gradual decrease, which led to a low of $0.12 on Mar 18.
Another upward move followed, and price made a high of $0.413 on May 3.
After a long downtrend, the price made the current low of $0.027 on Dec 7.
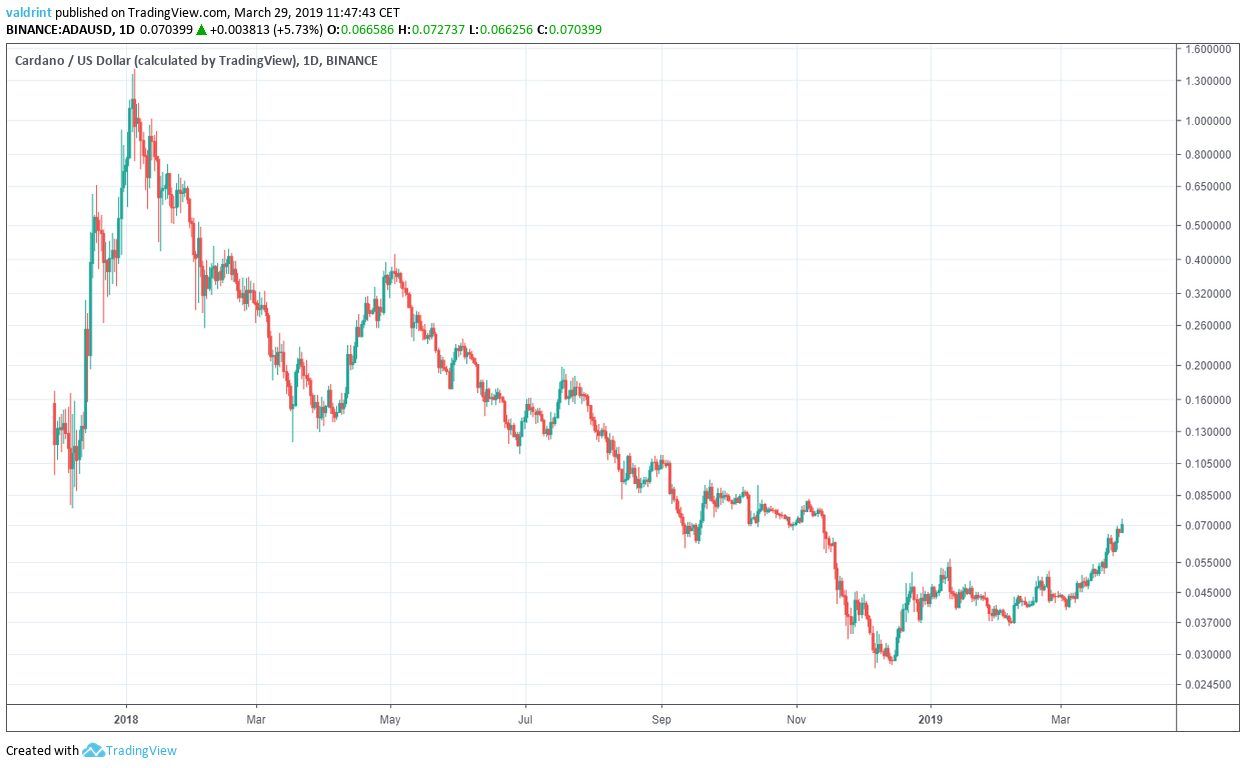 Relevant upward trends are listed below with the lows and highs experienced at the respective beginning and end of each:
| Timeframes For Upward Movement | Low (Date Experienced) | High (Date Experienced) |
| Dec 8 2017-Jan 5, 2018 | $0.078 (December 8, 2017) | $1.39 (January 5, 2018) |
| Mar 18, 2018-May 3, 2018 | $0.12(March 18, 2018) | $0.413 (May 3, 2018) |
| Dec 7, 2018-? | $0.027 (December 7, 2018) | $? |
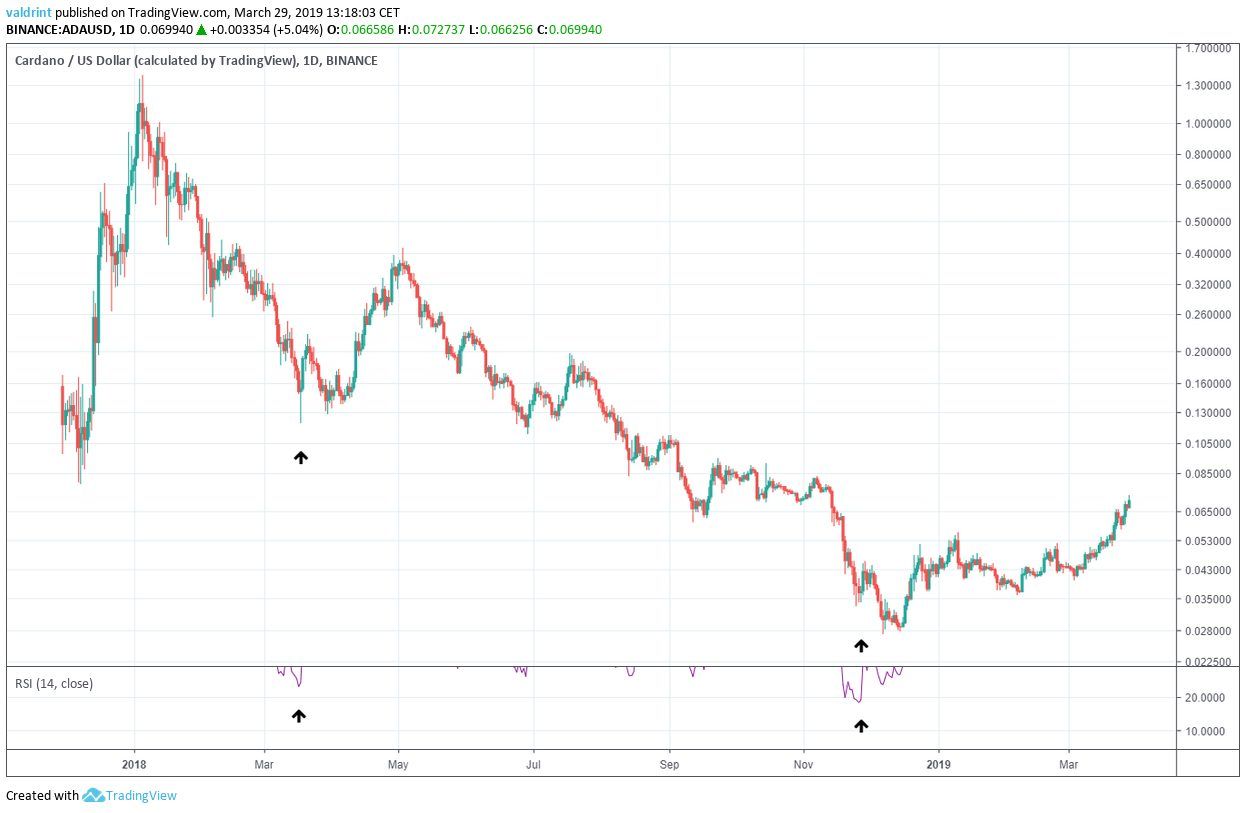 To better visualize large price fluctuations, logarithmic charts are going to be used in this analysis.
Furthermore, an upper limit in the RSI is placed at 30. Therefore, only values lower than 30 are shown in the chart.
The highest RSI recorded during Mar 2018 was 23. This occurred on the low of Mar 18, 2018.
Similarly, a RSI of 19 was reached on Nov 28, 2018, 8 days before the Dec 7 low.
This may suggest that RSI may reach similarly low levels below 25 shortly before or at the date in which it reaches the bottom.
Therefore, we may have the first similarity between the Mar 2018 upward move and the current one. Oversold RSI values(<25) were reached on the days that corresponded with a swing low.
To better visualize large price fluctuations, logarithmic charts are going to be used in this analysis.
Furthermore, an upper limit in the RSI is placed at 30. Therefore, only values lower than 30 are shown in the chart.
The highest RSI recorded during Mar 2018 was 23. This occurred on the low of Mar 18, 2018.
Similarly, a RSI of 19 was reached on Nov 28, 2018, 8 days before the Dec 7 low.
This may suggest that RSI may reach similarly low levels below 25 shortly before or at the date in which it reaches the bottom.
Therefore, we may have the first similarity between the Mar 2018 upward move and the current one. Oversold RSI values(<25) were reached on the days that corresponded with a swing low.
NOTE: While there are no similarities between the Mar and May 2018 bottoms and the Dec 2017 low for the indicators defined, we still believe a pattern may be developing. Cardano was initially released only months before the bottom in Dec 2017 was reached. This means there were many reasons why Cardano may not have yet been following patterns that are being suggested by our analysis of the other two lows. However, two data points are not enough to determine a pattern. Thus, our “price predictions” seek to predict price in order to attempt to validate the patterns defined below. If the predictions are invalidated, the patterns defined will also be invalidated.
Rate Of Change
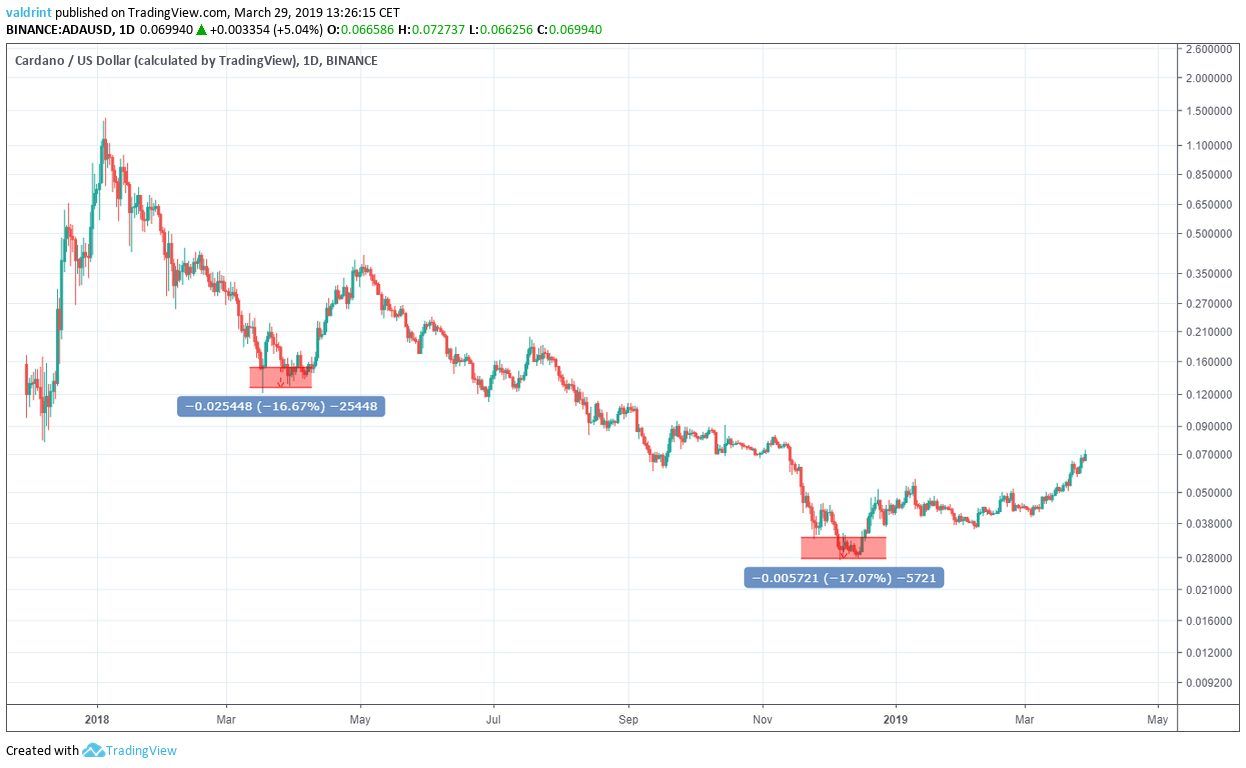 The price made a low of $0.12 on March 28, 2018. It proceeded to close at $0.154. Afterward, it continued to decrease making made another low of $0.128 on Mar 30.
This amounts to a decrease of nearly 17%. The closing price is used instead of the actual low in order to remove any outlier data which may skew the rate of decrease.
The price made a high of $0.33 on Nov 25, 2018. Afterward, a decrease followed. Price made a lower low of $0.272 on Dec 7. This amounts to a decrease of 17%.
Therefore, we have another similarity between the two moves: The rates of decrease from the preceding swing low to the bottom were similar in both movements.
Now that we have a rate of price movements, we can make a prediction on the value of the next high.
The price made a low of $0.12 on March 28, 2018. It proceeded to close at $0.154. Afterward, it continued to decrease making made another low of $0.128 on Mar 30.
This amounts to a decrease of nearly 17%. The closing price is used instead of the actual low in order to remove any outlier data which may skew the rate of decrease.
The price made a high of $0.33 on Nov 25, 2018. Afterward, a decrease followed. Price made a lower low of $0.272 on Dec 7. This amounts to a decrease of 17%.
Therefore, we have another similarity between the two moves: The rates of decrease from the preceding swing low to the bottom were similar in both movements.
Now that we have a rate of price movements, we can make a prediction on the value of the next high.
Swing High
On Mar 18, 2018, the price made a low of $0.012. An increase ensued, and price made a high of $0.413 on May 3. This is an increase of 68% On Dec 7, the price made a low of $0.027. Measuring from the low, a 68% increase would give us prices of $0.088. However, we do not know when that high will occur. In order to do that, we need to find a similarity between the two movements which would give us a ratio of time periods.
Time Periods
To determine what prices might be reached, we must determine the time tables during which the patterns we define might unfold. We do this by examining the times between lows and swing highs of a similar increase. On Apr 21 2018, the price made a swing high of $0.311. Measuring from the $0.12 low, this is an increase of 58%. It took 33 days for the price to reach this level. On Mar 23, 2019, the price made a high of $0.065. Measuring from the $0.027 low, this is an increase of 58%. It took 105 days for the price to reach this level.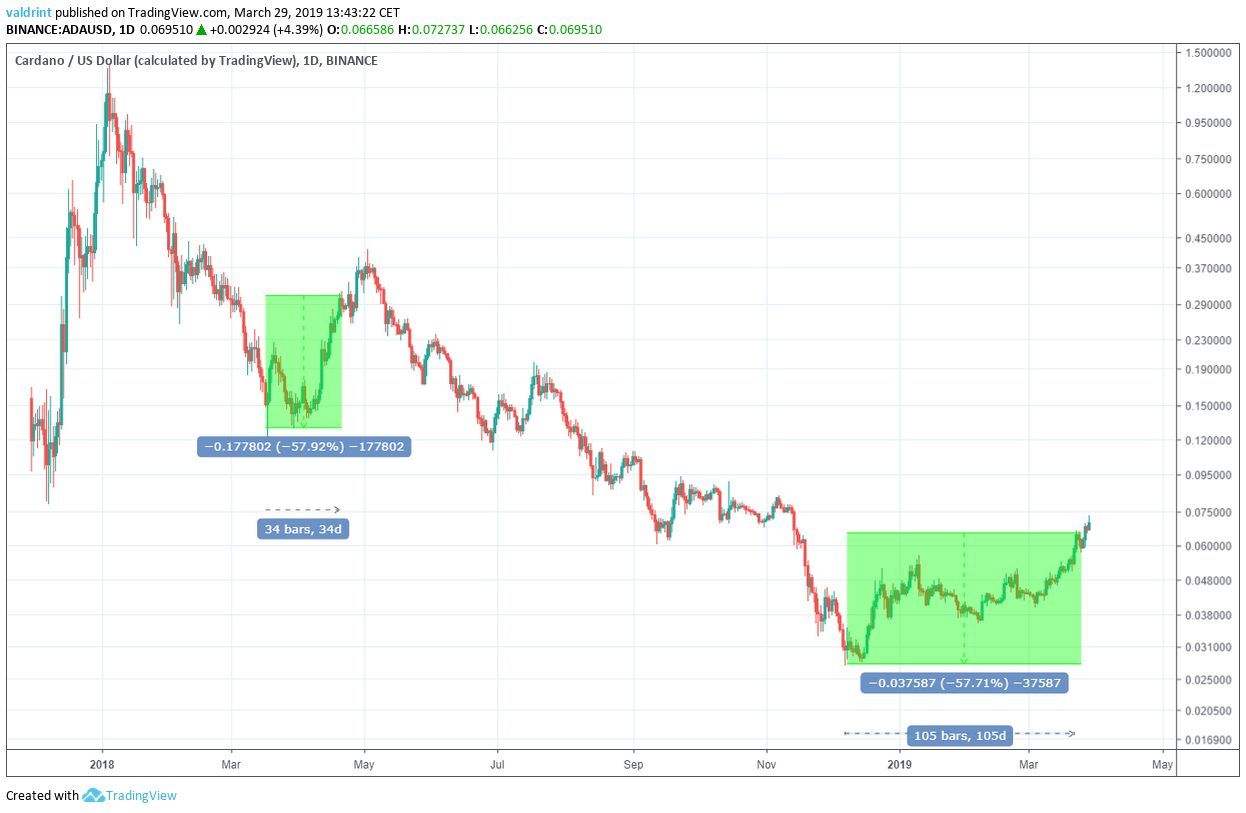 Comparing the length of these movements allows us to generate ratios that may help us in determining future prices and when they will be reached.
The rate between the two movements is 3.08 (105/34). Therefore, we are going to make the assumption that movements in the current upward move take 3.08 times longer to develop than those on the upward move beginning on Mar 2018.
For the sake of convenience, we are going to round up the number to 3 and use it on the rest of the analysis.
Comparing the length of these movements allows us to generate ratios that may help us in determining future prices and when they will be reached.
The rate between the two movements is 3.08 (105/34). Therefore, we are going to make the assumption that movements in the current upward move take 3.08 times longer to develop than those on the upward move beginning on Mar 2018.
For the sake of convenience, we are going to round up the number to 3 and use it on the rest of the analysis.
ADA Price Prediction 2019
In order to figure out the price at the end of 2019, we will use the rate of time (3) and apply it to the date in the 2018 upward move which corresponds to Dec 31, 2019.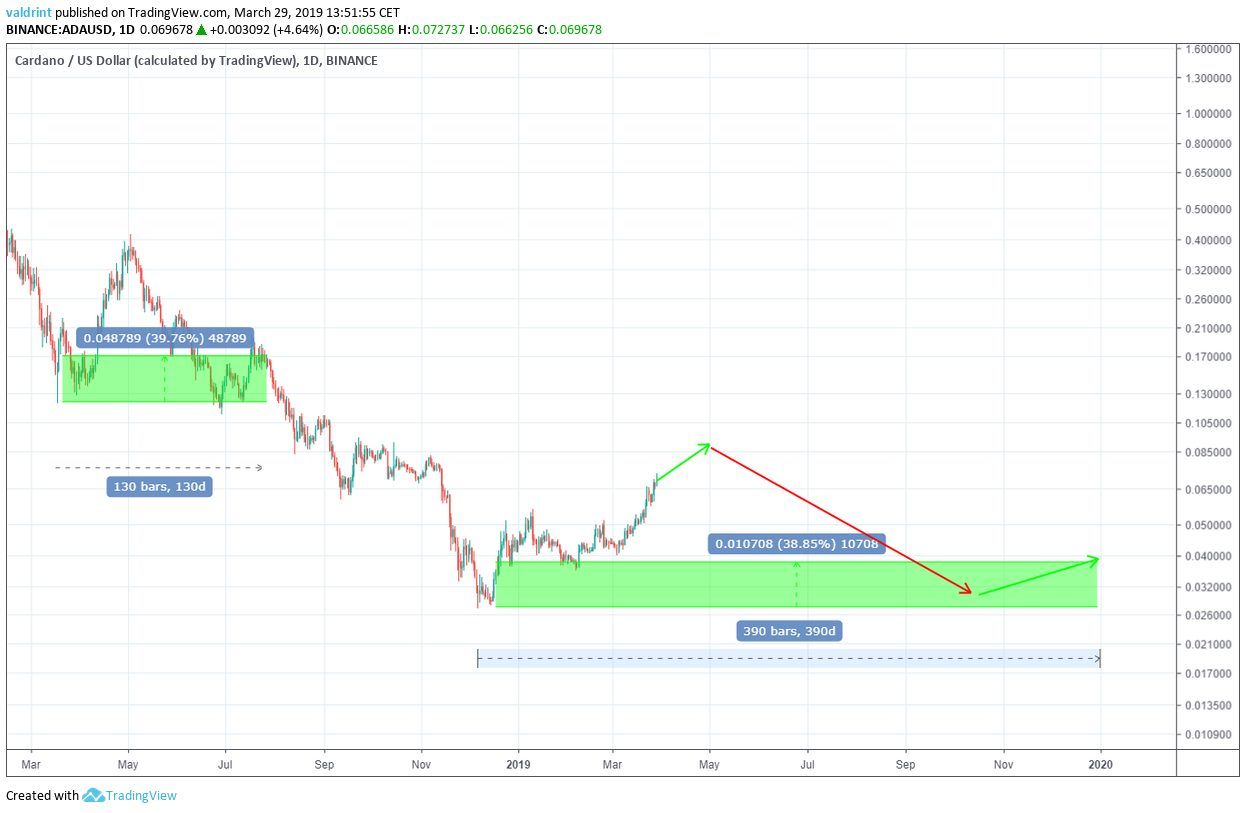 On Jul 25, 2018, 130 days after the $0.12 low, the price closed at $0.171. Measuring from the $0.12 low, this is a 40% rate of increase
Therefore, we will use a 40% rate of increase from the $0.027 low on Dec 7. This gives us a price of around $0.038 on Dec 31, 2019.
In the previous section, we mentioned that we believe that the price will make a high of $0.088. Using the same rate of time, the high should be reached on Apr 29, 2019.
If the price reaches this value, it will give further validation to the pattern we are using.
On Jul 25, 2018, 130 days after the $0.12 low, the price closed at $0.171. Measuring from the $0.12 low, this is a 40% rate of increase
Therefore, we will use a 40% rate of increase from the $0.027 low on Dec 7. This gives us a price of around $0.038 on Dec 31, 2019.
In the previous section, we mentioned that we believe that the price will make a high of $0.088. Using the same rate of time, the high should be reached on Apr 29, 2019.
If the price reaches this value, it will give further validation to the pattern we are using.
ADA Price Prediction 2020
The price of ADA on Binance is analyzed at three-day intervals from Nov 30, 2017 to Mar 29, 2019 In order to figure out the price at the end of 2019, will use the rate of time (3) and apply it to the date in the 2018 upward move corresponds to Dec 31, 2020.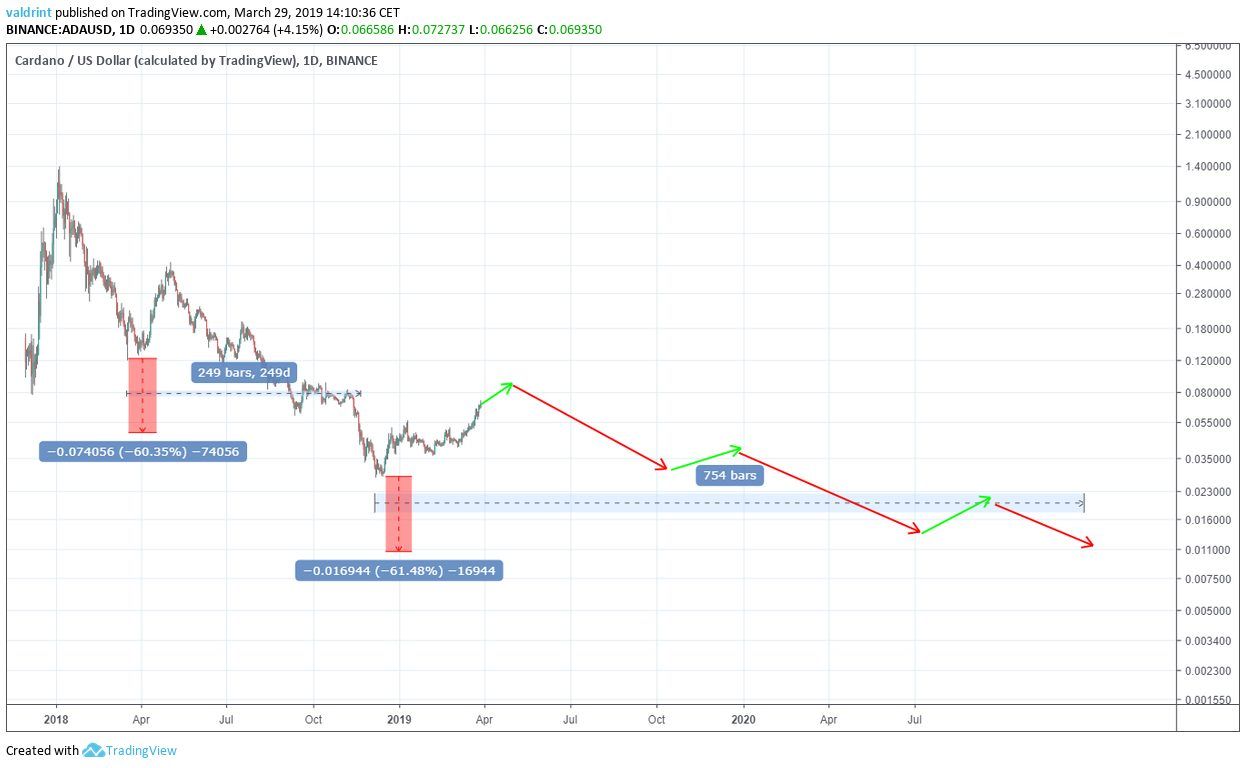 On Nov 21, 2018, 249 days after the $0.12 low, the price closed at $0.048. Measuring from the $0.12 low, this is a 60% rate of decrease.
Therefore, we will use a 60% rate of decrease from the $0.027 low on Dec 7. This gives us a price of around $0.01 on Dec 31, 2020.
On Nov 21, 2018, 249 days after the $0.12 low, the price closed at $0.048. Measuring from the $0.12 low, this is a 60% rate of decrease.
Therefore, we will use a 60% rate of decrease from the $0.027 low on Dec 7. This gives us a price of around $0.01 on Dec 31, 2020.
Summary of Analysis
There are several similarities between the Mar 2018 upward move and the current one in 2019.- Very similar RSI levels are generated at their respective lows.
- Similar rates of decrease between the previous swing low and the actual low
- Possibly the rate of increase between the low and the high.
- The price should make a high of $0.088 on Apr 29, 2018.
- The price should be trading around $0.038 in December 2019.
- The price should be trading around $0.01 in December 2020.
Top crypto projects in the US | May 2024
Trusted
Disclaimer
In adherence to the Trust Project guidelines, BeInCrypto is committed to unbiased, transparent reporting. This news article aims to provide accurate, timely information. However, readers are advised to verify facts independently and consult with a professional before making any decisions based on this content. Please note that our Terms and Conditions, Privacy Policy, and Disclaimers have been updated.

Alexander Fred
Global AI, Data Science, and Blockchain expert. Alexander writes for BeInCrypto where he completes technical analyses of various alt-coins and qualitative commentary and analysis about various cryptoassets and their potential for social integration.
Global AI, Data Science, and Blockchain expert. Alexander writes for BeInCrypto where he completes technical analyses of various alt-coins and qualitative commentary and analysis about various cryptoassets and their potential for social integration.
READ FULL BIO
Sponsored
Sponsored