


On Dec 15, 2018, the price of Cardano (ADA) made a low of $0.027. A sharp upward move was initiated two days later. The price has been on a gradual uptrend since.
A rapid spike occurred at the beginning of April 2019. At the time of writing, Cardano had already reached a high of $0.088 on Apr 2.
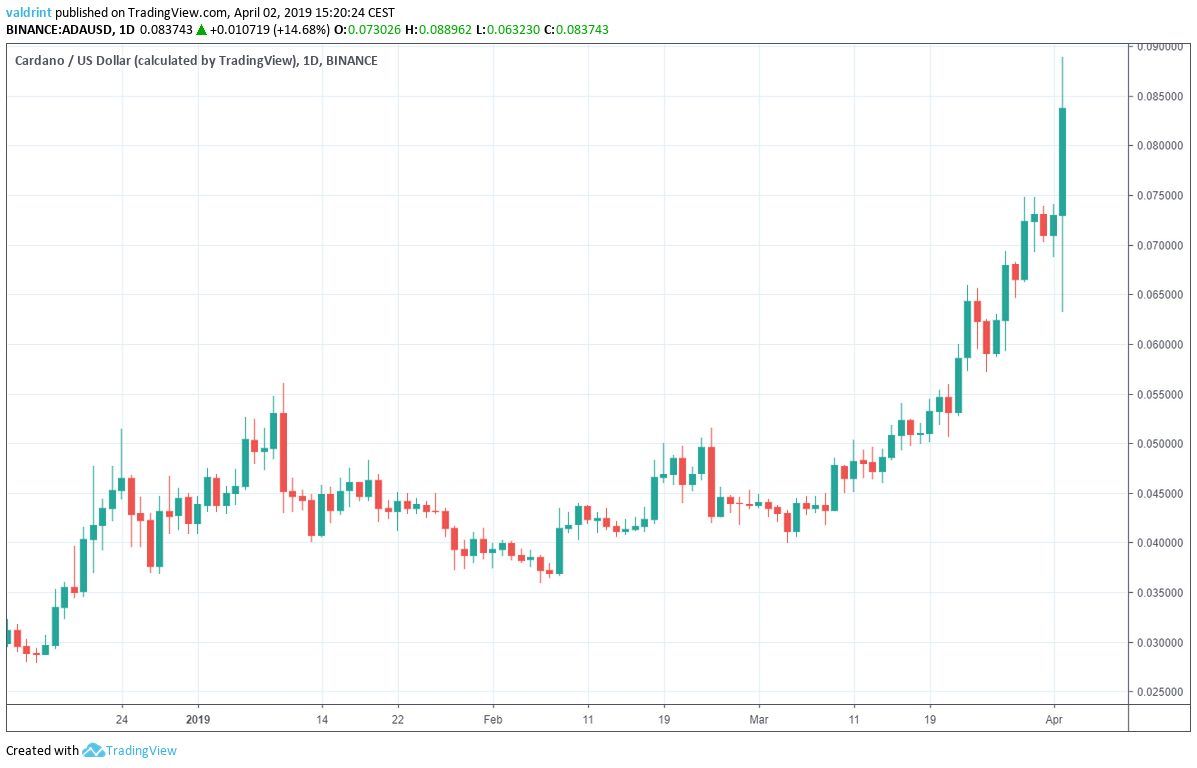
Many other cryptocurrencies experienced a similar spike on Apr 1 and 2. Bitcoin rose to over $5000 while XRP neared $0.40 and Stellar lumens passed $0.135.
Cardano (ADA): Key Trends And Highlights
- The price of ADA began an uptrend on Dec 17, 2018.
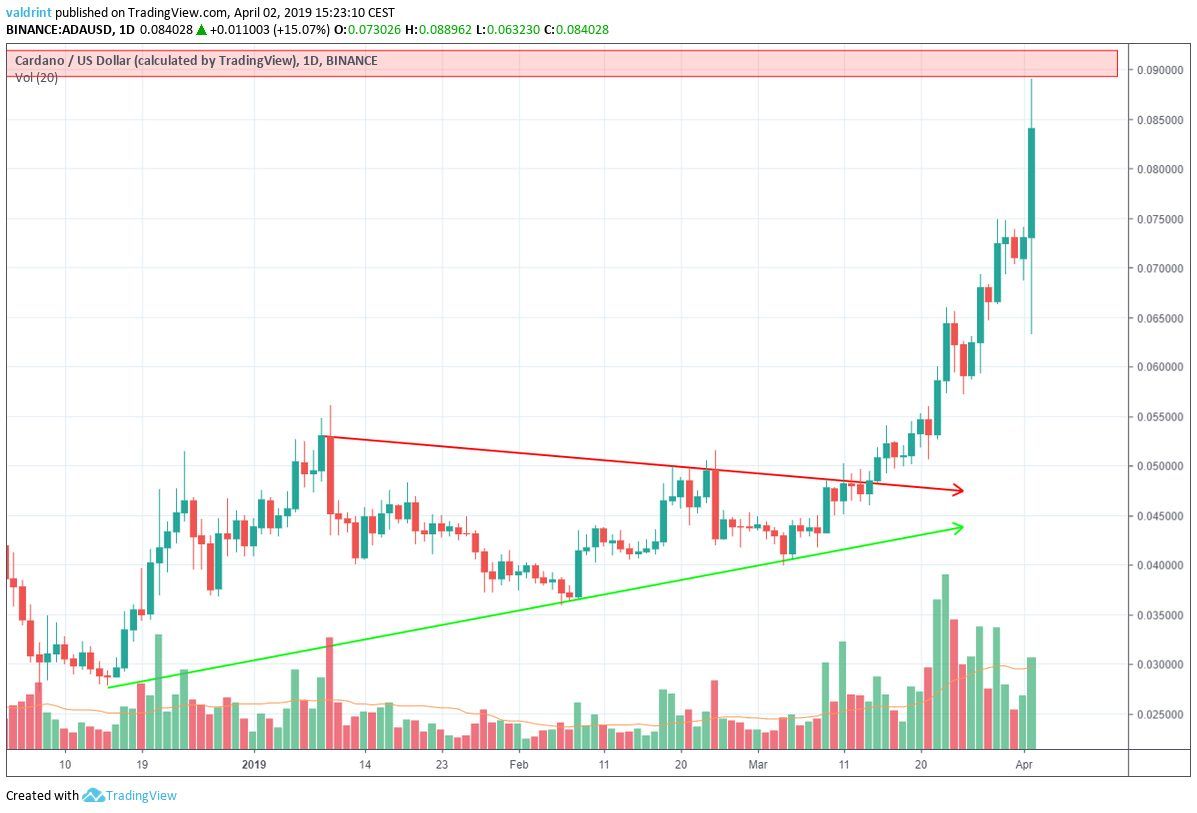
- ADA has been trading inside a symmetrical triangle since Jan 10.
- Cardano broke out from the triangle on Mar 15.
- In addition, Cardano is trading above the daily moving averages.
- There is significant resistance at $0.09.
Symmetrical Triangle
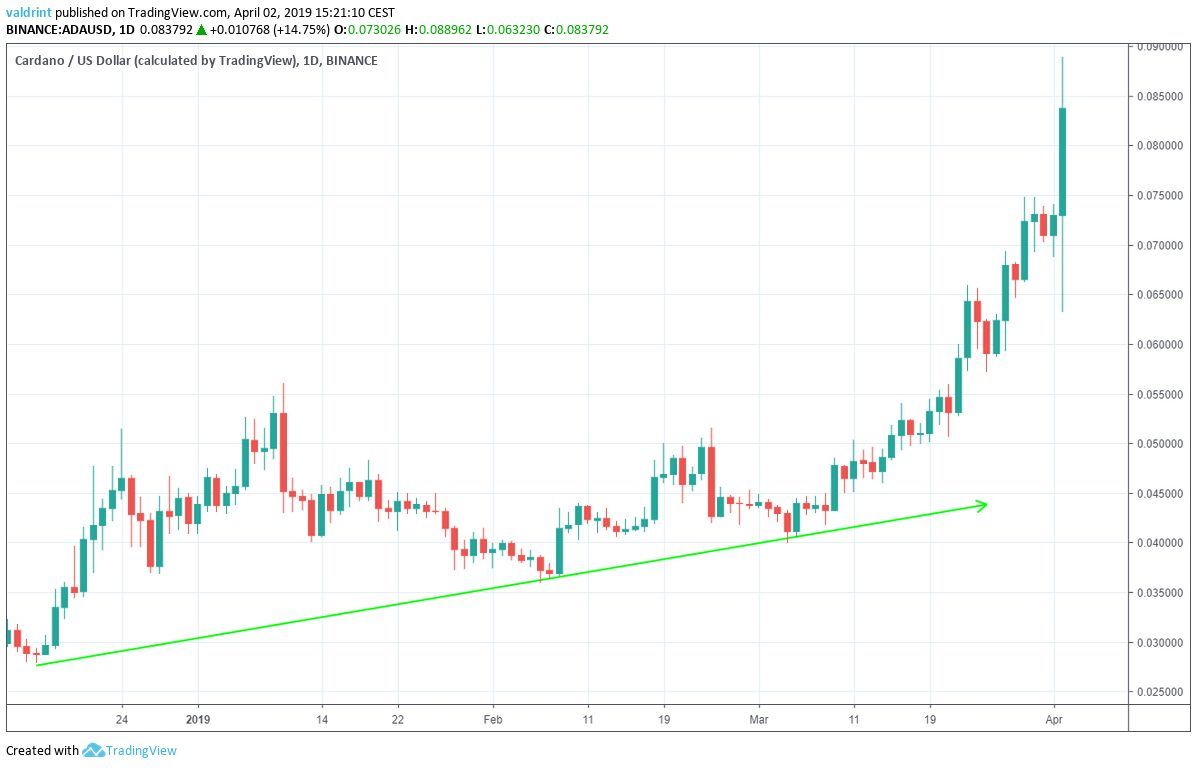
On Dec 15, Cardano reached a made a low of $0.027. Price has been on an upward trend since.
Tracing these lows gives us an ascending support line. In mid-March, Cardano’s price increase accelerated beyond the rate projected by the support line beginning on Mar 15:
On Jan 10, the price reached a high of $0.056. Several market cycles have been completed since, with each high being lower than the preceding one.
Tracing these highs gives us a descending resistance line.
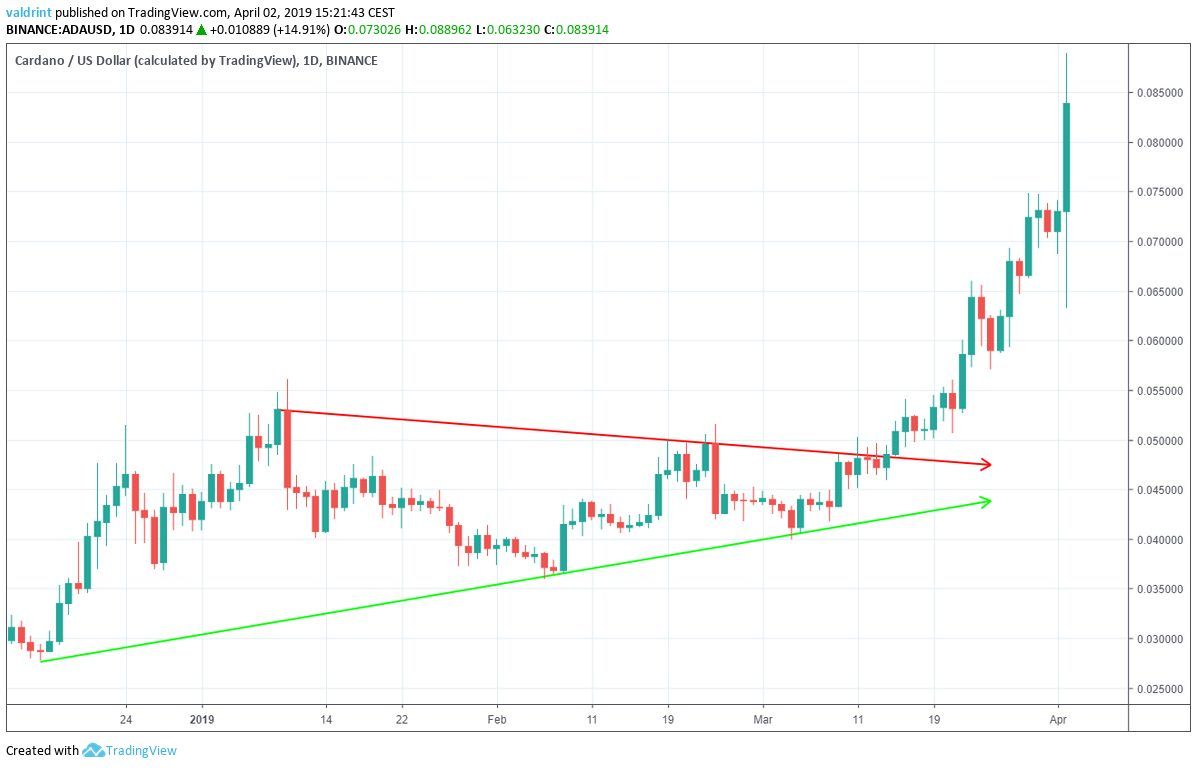
This is a generally neutral pattern. However, at the point of convergence between support and resistance, a breakout above resistance or breakdown below support becomes inevitable.
Cardano broke out from the triangle before convergence. Accelerated price increases followed.
Will prices continue rising throughout April?
To answer this question, we must incorporate technical indicators into our analysis.
A Look at the Indicators
The technical indicators we have chosen to use are moving averages, resistance areas, and volume. Together, these will help us better visualize possible areas of reversal.
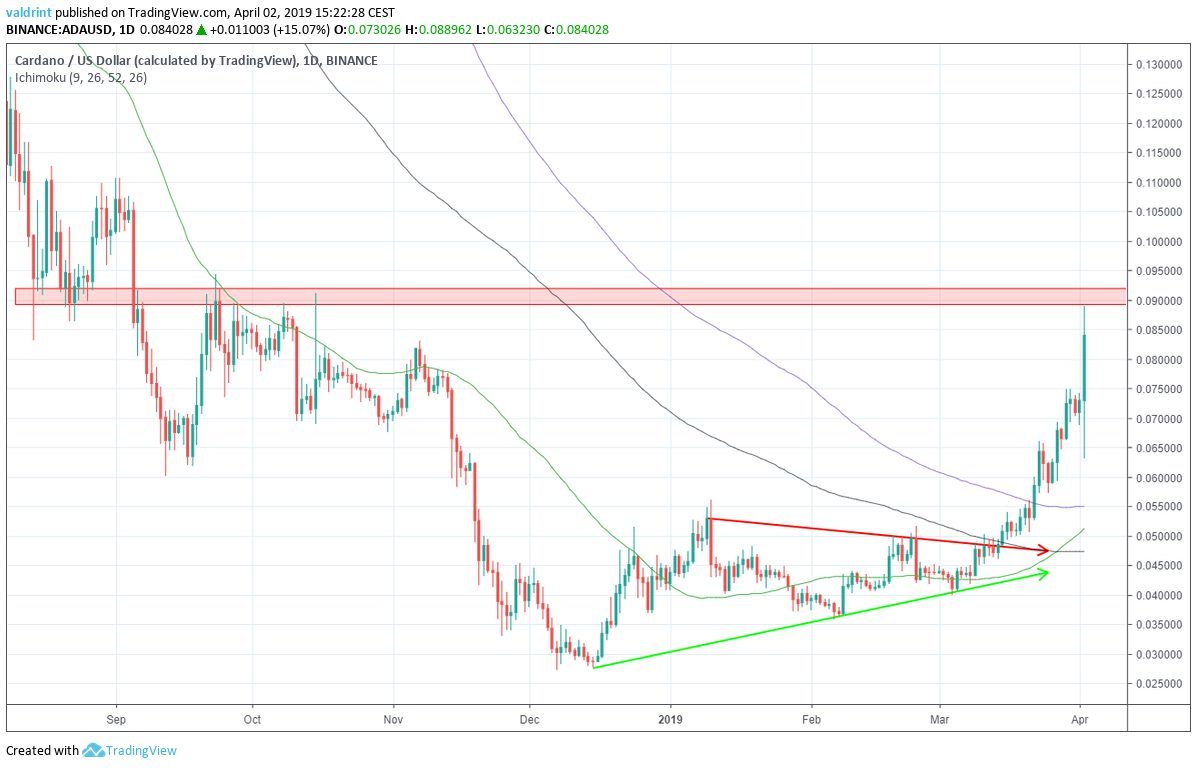
On Mar 15, the price moved past the 100-day moving average (black). On Mar 24, it proceeded to move past the 200-day MA (purple).
Therefore, there is no resistance left provided by the moving averages. This suggests that Cardano may continue experiencing price gains throughout April.
However, there is a significant resistance area near $0.09, created by the lows of Aug 2018. If Cardano can rise above this resistance, it could exceed the $0.1 mark by the end of April.
We can see from the graph that the breakout occurred on slightly above average volume. This was also found with Bitcoin when the price spiked to over $5000 on Apr 2.
April Price Prediction And Summary
The breakout on ar 15 generated a new ascending support line. Recent spikes on Apr 2 pushed Cardano’s rate of increase above that projected by this new support:
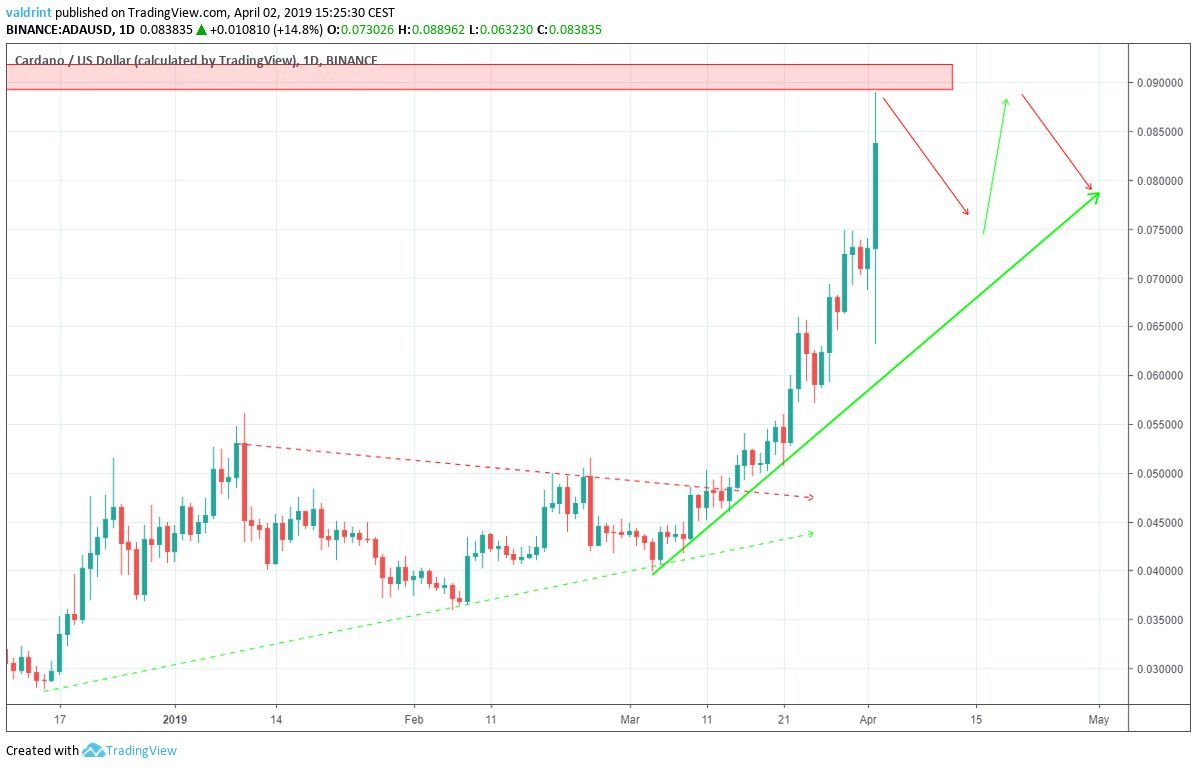
We believe that price will drop back toward this support. Volatility along this line is expected as price gradual increases to a point of consolidation.
By the end of April, it is likely that Cardano will consolidate between $0.075 and $0.09
Do you think the price of ADA will break out above the resistance area? Let us know your thoughts in the comments below!
Disclaimer: This article is not trading advice and should not be construed as such. Always consult a trained financial professional before investing in cryptocurrencies, as the market is particularly volatile.


