

As traders navigate the fluctuations between bullish and bearish forces in the crypto market, they often use indicators like the Relative Strength Index (RSI) and volume analysis to time their trades. However, in an unpredictable field, it is useful to have a tool that analyzes the behavioral phases of crypto trading instead of the price and trend confirmations. This is where the Gator Oscillator comes in handy.
This guide dives into the Gator Oscillator, examining its practical applications, calculation method, and analytical benefits. Here’s why it’s an essential oscillator for those seeking precise trading signals without the overload of multiple indicators.
- What is the Gator Indicator?
- The utility of the Gator Oscillator
- How is the Gator Oscillator calculated?
- How to read the Gator Oscillator?
- How to use it in crypto trading?
- Maximizing the impact of the Gator Oscillator
- Tips for traders using the Gator Oscillator
- Can you use the Gator Oscillator as a standalone indicator?
- Frequently asked questions
What is the Gator Indicator?
The Gator Indicator, also termed the Gator Oscillator, is a derivative or a sourced version of the famous Alligator Indicator. While the alligator indicator is made of moving averages, the Gator Oscillator is made of histograms. This tool helps users visualize and interpret the market’s behavior, helping them make sense of the various phases leading to or following a trend.
Did you know? The Gator Oscillator was created by Bill Williams, a 1932-born trader who also created the trend-following Alligator Indicator, the Market Facilitation Index (MFI), and price pattern-evaluating Fractals.
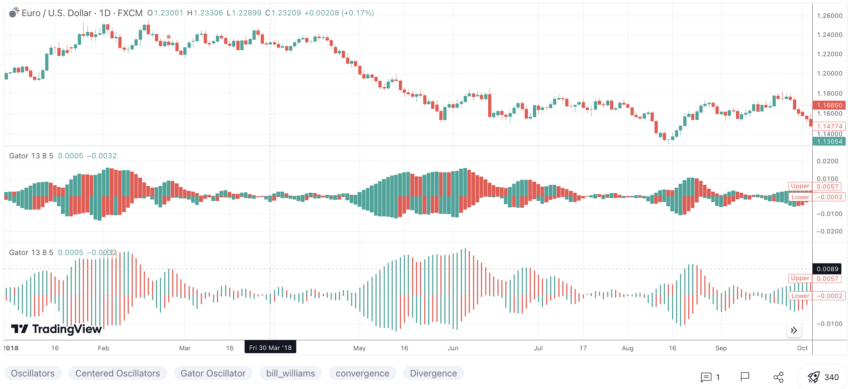
The Gator Oscillator relies on histogram analysis and features two histograms to work with. The histograms above the zero line and below the zero line can be all red, all green, or a mix of both, depending on the state of the market or the cryptocurrency you are analyzing.
The utility of the Gator Oscillator
The Gator Oscillator is a simplified version of the Alligator indicator. The former doesn’t directly identify the trend’s direction but only captures the mood. It helps the traders make sense of market phases by dividing moves into the sleeping, awakening, eating, and weakening phases.
These phases, when viewed in combination with the Alligator Indicator’s moving averages and the price action, help you with decision-making and even risk management. The idea is to look for the histogram analysis patterns to turn green and red from all red before you can consider entering a long position.
The risk management element is taken care of when you start closing your open position, and all the green bars turn green and red, hinting at a sating phase. The Gator Oscillator is still a lagging indicator, showcasing the trend’s strength rather than the direction unless you use it to analyze the trading divergence.
How is the Gator Oscillator calculated?
The calculation principle of the Gator Oscillator is based on how the Alligator Indicator moves. Therefore, it is necessary first to understand the elements of the latter:
- Blue line: Also known as the Jaw of the alligator, it is the 13-period smoothed moving average.
- Red line: Also known as the Teeth of the alligator, it is the 8-period smoothed moving average.
- Green line: Also known as the Lips of the alligator, it is the 5-period smoothed moving average.
Note: These are the lines and moving average levels set by Bill Williams. The TradingView Gator Oscillator settings, like any other TradingView Indicator, could have slightly different values for the moving average.
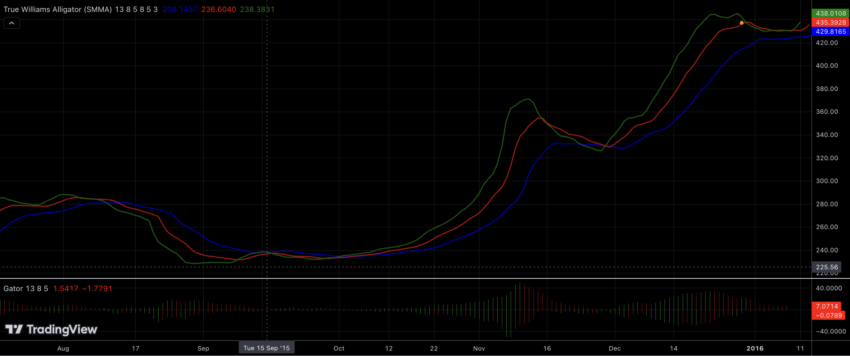
Notice how in the above TradingView Gator Oscillator and Alligator Indicator representation, the 5-period line is green, and the 13-period Jawline is red. In this case, the teeth are the blue line and smoothed as 9-period instead of 8-period of showcase mid-term trends instead of short-term.
Each moving average is shifted forward by 8-period, 5-period, and 3-period to reduce the effects of the lagging indicator and make the Gator indicator more forward-looking. Now that the base is all set, let us focus on the calculation:
Understanding the bars
As mentioned earlier, the Gator Oscillator comprises dual histograms comprising upper and lower bars. Each upper bar is the absolute difference between the 13-period and 8-period/9-period smoothed averages. Each lower bar is the difference between the 8-period/9-period and 5-period moving averages. The bars can be green and red, depending on the nature of the trend. We shall look into this while reading a gator oscillator.
How to read the Gator Oscillator?
Reading the Gator Oscillator is all about understanding the elements. Notably, while this oscillator helps with the entry and exit points, it can signal the trend direction, provided you know how to read the trading divergence.
Element 1
The easiest way to read is to understand the phases of the Gator Oscillator, along with the colors. If both the histogram bars are red, expect the price action to be in the sleeping phase. This shows the market is in a consolidation phase, not rife for entry.
Element 2
If one histogram is in green and the other is in red, or are there multiple green-red bars, you might be looking at the awakening phase. This might reveal clear entry points and the potential start of a forming up trend.
Element 3
If both the histogram bars are green, expect the market to be in the eating phase. This is where traders take most of the profit, capitalizing on the momentum.
Element 4
When, after the eating phase, the bars again start showing mixed colors — red and green, you can expect the trend to lose momentum. This is where most traders exit positions and book profits.
Element 5
The size of the bars also reveals a lot in terms of price action. For instance, if the green and red bars in the awakening phase are smaller than the sleeping phase, you might want to look at other indicators and wait for a different entry point.
Element 6
If the price action and the formation of bars (bar size even) move in different directions, you might be looking at trading divergence. For instance, check the chart below. Despite the formation of red and green histogram bars, the price of BTC corrected instead of rising, as the bars were smallish and not aligned with the price action.
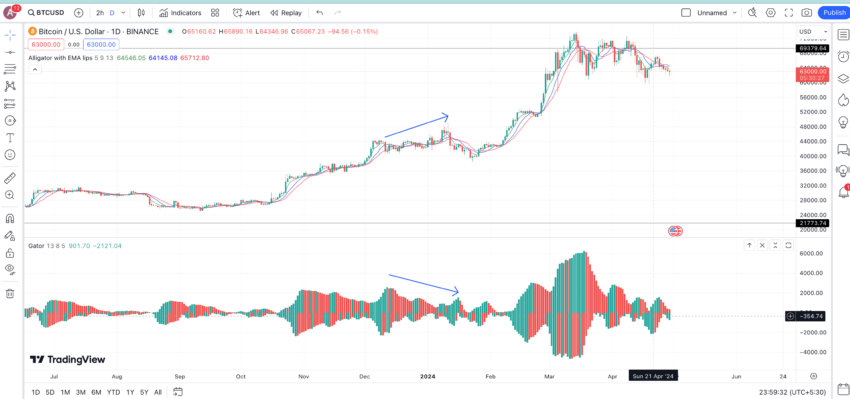
Important: If the bars in the awakening zone are smaller than the ones encountered in the previous phase, the trend is not solid, and the price action might trade sideways for a while.
Now that we know how to read this indicator, let’s take the BTC price chart and try to use the Gator Oscillator in real-time crypto trading.
How to use it in crypto trading?
We shall now look at the historical chart of Bitcoin, starting in 2021 and following all the way till the peak formed towards the end of that year. The first encircled zone hints at a consolidation or sleeping phase with all-red, smallish bars.
Then came the awakening phase with the broadening green bars and occasional red here and there. After this came the price surge, taking BTC to a new high of almost $58,000. Immediately after this high, the Gator indicator started showing green and red bars, hinting a correction and space for traders to exit the trade.
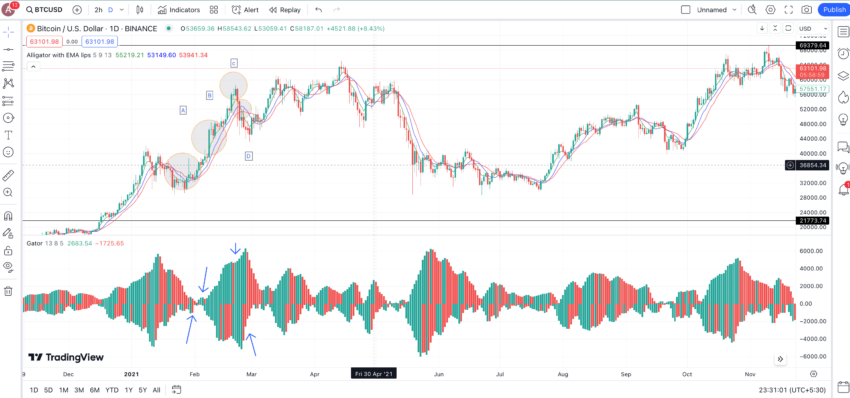
The entire short-term journey is depicted by the A to D pathway.
Note that these phases were between January and February 2021, and BTC embarked on several such journeys to reach a peak of almost $69,000 by the end of the year.
Using the Gator Oscillator with the 2024 BTC chart
In 2024, the price of BTC seems to be trading in the sleeping zone, slowly transitioning to the awakening zone. Yet, it is noticeable that the bars in the awakening zone aren’t as big as the ones in the last sated phase. This shows that BTC might keep moving in a range for now, making short-term highs and lows only from the trading perspective.
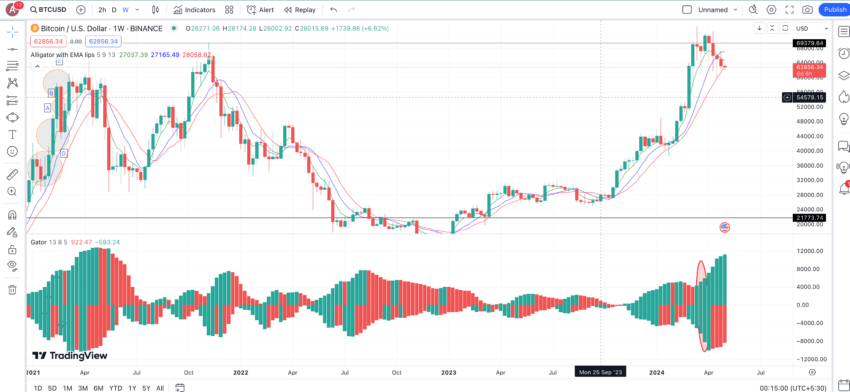
Notice how the weekly BTC chart reveals a more accurate formation of the Gator Oscillator. The ellipse highlighting the oscillator’s specific zone reveals the eating zone, after which the sated zone arrives quickly with sizeable green and red bars.
Based on the historical analysis, we expect the price action to be muted for a while before BTC enters the sleeping zone. After that, we need to look for the color and size of the bars, per the histogram analysis, to locate the next leg of the trend.
However, besides the technical analysis, broader crypto market sentiments also plays a key role in determining BTC’s price action.
“Technical analysis is massively important and should not be ignored. Sentiment is a great way to gauge markets too, and news does move the market in unexpected ways sometimes. But more often than not we can at least get some early indications in the charts.
I.e, Bitcoin at 73k saw seven months of green candles, a near historic run, a correction was coming if you could think without greed and euphoria clouding your mind. A MACD bear cross came the day after hitting the high; an early warning sign of trouble to come.
But while this was happening the market was wildly euphoric, Blackrock ETF buyers bought a billion that day. So, yes, sentiment is important but it works as a counter indicator. Try to think against the herd.”
Lark Davis, Bitcoin Investor and the Founder of Wealth Mastery: BeInCrypto interview
Maximizing the impact of the Gator Oscillator
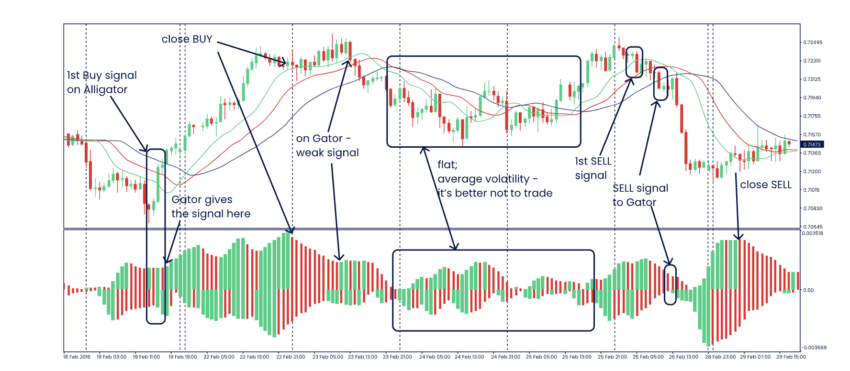
The Gator Oscillator is best read with the Alligator Indicator. This means it is imperative to locate the oscillator’s awakening phase when the Alligator Indicator’s moving averages start diverging in the following order — 5-period, 8-period/9-period, and 13-period. At its heart, the Alligator Indicator is all about finding the golden crossover patterns in relation to the price action. The Gator Oscillator helps validate these patterns.
The Gator Oscillator is a secondary indicator you pair with the Alligator moving averages. The histogram bars take shape depending on the convergence and divergence of the Alligator or the primary indicator.
Trading Indicators to pair with the Gator Oscillator
For near-accurate technical analysis, you might want to pair the Gator Oscillator with the following crypto trading indicators:
MACD
MACD helps locate the potential reversals and trend-based momentum. To use the Gator Oscillator with the MACD indicator, you might want to focus on the convergence and divergence between the two indicators to get the strongest possible trading signals.
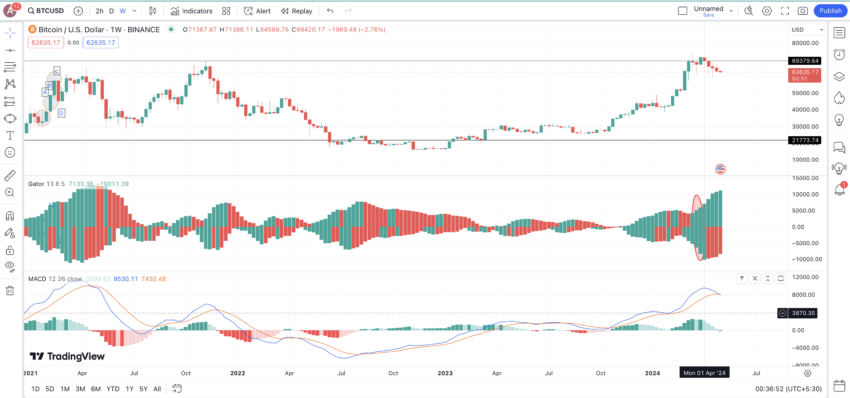
The Bitcoin price action chart shows the blue line of the MACD threatening to drop under the orange line, hinting at bearishness. The sated phase or zone of the Gator Oscillator validates the MACD-specific finding. Both these indicators suggest that BTC might move in a range or even correct a little in the short-to-mid-term.
RSI
The relative strength indicator measures the price change and speed of price action, eventually helping to determine oversold and overbought market conditions. Using it with the gator oscillator is simple. You need to locate an RSI divergence, bullish or bearish, and analyze it with the existing zone of the oscillator is in. Besides these indicators, crypto traders must value fundamental analysis for long-term wealth creation.
Tips for traders using the Gator Oscillator

If you want to use the Gator Oscillator to transform your trading performance, here are the best strategies to follow:
- Always use the Gator oscillator with the Alligator Indicator.
- Consider using the Oscillator in the medium-to-long time frame, as the phases need some time to solidify. (This was why we also referred to Bitcoin’s weekly chart).
- Even though you can use the Gator histogram analysis for day trading or scalping, it might not yield the most accurate results as the bars might change colors too early.
- You can use the phases of the Gator Oscillator to set stop-loss orders.
- When reading Gator-specific charts, consider using multiple timeframes.
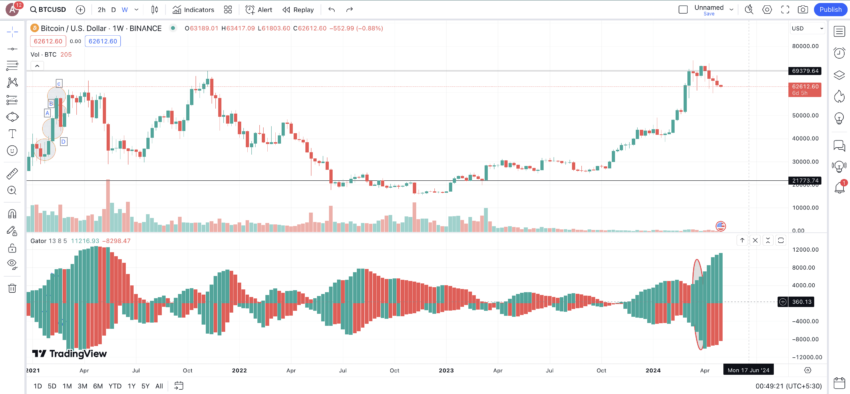
- Always monitor trading volume to validate phases and trends.
Can you use the Gator Oscillator as a standalone indicator?
Even though the Gator Oscillator is a powerful trading tool that helps you identify the sentiment of the trading crowd — calm, excited, or somewhere in the middle — it is best paired with other trading indicators, especially trend-confirming ones like RSI. Additionally, it’s important to note that the Gator Oscillator indicator works best across a longer timeframe. This means it works best with more established/mature cryptocurrencies with discernable historical data to analyze.
Frequently asked questions
Trading with the Gator Oscillator requires you to choose a longer time frame, say weekly. Once you have the weekly chart, look for a phase when the histogram analysis, relative to the mid-line of the histogram, showcases big, red-green bars after a smallish all-red bar phase. This is termed the awakening phase, when most traders enter long positions.
The Alligator strategy does offer reliable trading signals. When paired with the price action, this is one of the trading indicators that uses short-term moving averages for technical analysis. Alligator strategy works well in crypto market analysis as you capture the asset’s volatility without relying on multiple trading indicators.
The Alligator pattern in crypto trading corresponds to the multiple behavioral phases of the alligator — sleeping, waking, eating, and sating — to analyze the inclination of traders. Trading oscillators like the Gator Oscillator are formed using the alligator pattern and are useful for helping traders locate the best times to enter and exit crypto trading positions.
Reading a Gator indicator is easy. Use histogram analysis, keeping the middle or zero lines as a reference. If the bars on both sides of the middle line are red, the price action or trend is expected to be sleeping. You might wish to enter trades if the bars turn green and red.
However, it is important to note that the bar size during the awakening or trade-entering phase shouldn’t be smaller than the sleeping phase. After that comes a phase where all bars are green, relevant to the middle line. This is where you, as a trader, can book most profits. You should exit trades before the histogram bars again turn red-green.
Disclaimer
In line with the Trust Project guidelines, the educational content on this website is offered in good faith and for general information purposes only. BeInCrypto prioritizes providing high-quality information, taking the time to research and create informative content for readers. While partners may reward the company with commissions for placements in articles, these commissions do not influence the unbiased, honest, and helpful content creation process. Any action taken by the reader based on this information is strictly at their own risk. Please note that our Terms and Conditions, Privacy Policy, and Disclaimers have been updated.


