The Cardano (ADA) price has fallen slightly since November 16 but still trades above an important support area.
ADA has been consolidating above this support since the start of November. Will it finally begin an upward movement?
Cardano Reaches Range High
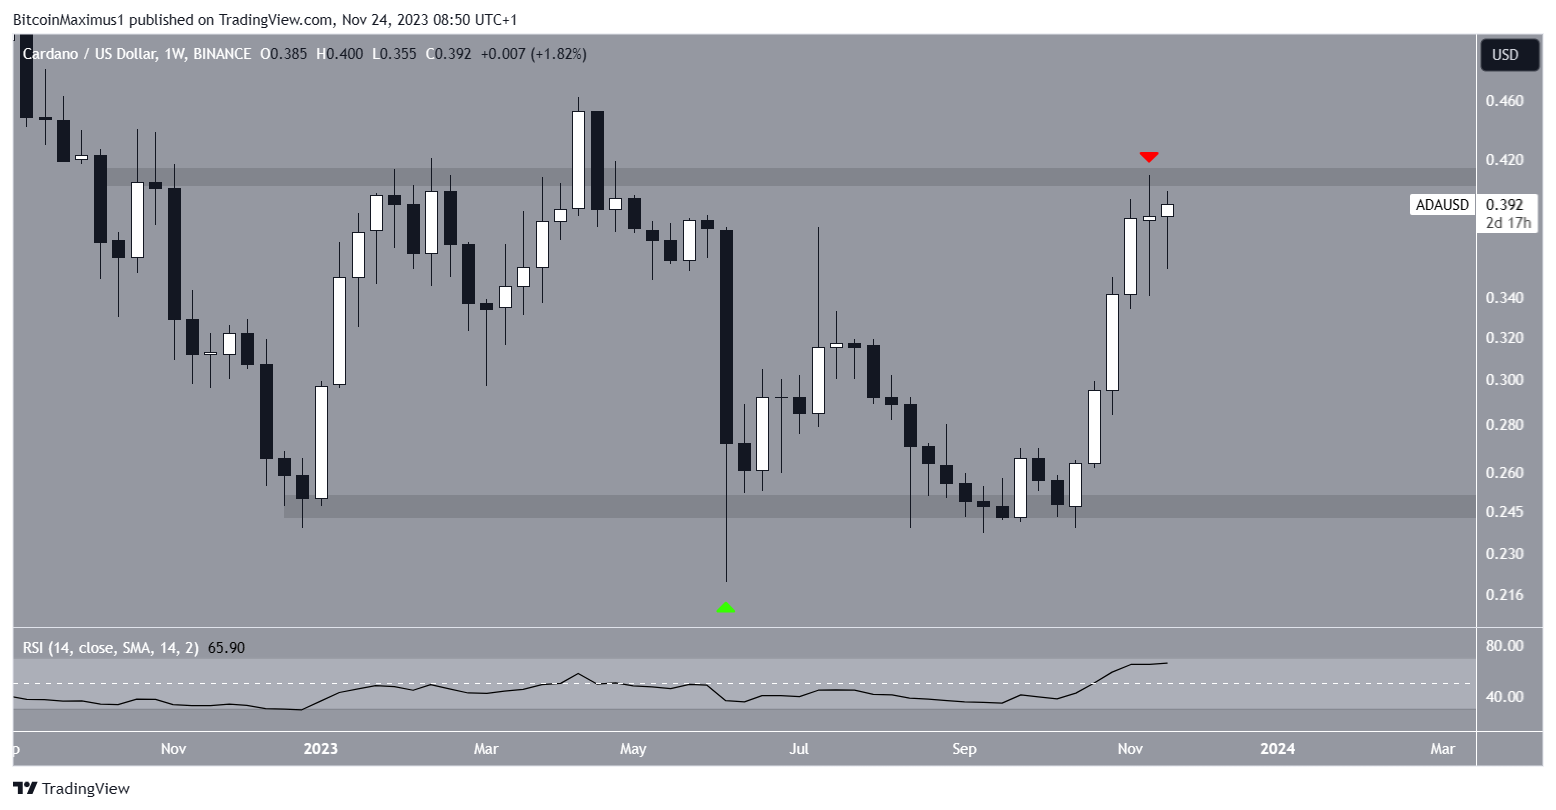
The weekly timeframe technical analysis for ADA shows that the price has traded in a long-term horizontal range since the start of the year.
Initially, the price seemed to break down from the range in June. However, it created a long lower wick (green icon) and reclaimed the range low. Such wicks are considered signs of buying pressure.
ADA created a higher low in October and accelerated its rate of increase. The ADA price created five successive bullish candlesticks, culminating with a high of $0.41 last week. This is only slightly lower than the yearly high of $0.46.

The RSI is a momentum indicator traders use to evaluate whether a market is overbought or oversold and whether to accumulate or sell an asset.
Readings above 50 and an upward trend suggest that bulls still have an advantage, while readings below 50 indicate the opposite.
The RSI is above 50 and increasing, both signs of a positive trend.
Read More: 9 Best Crypto Demo Accounts For Trading
What Do the Traders Say?
Cryptocurrency traders and analysts on X have a mixed outlook for the ADA price.
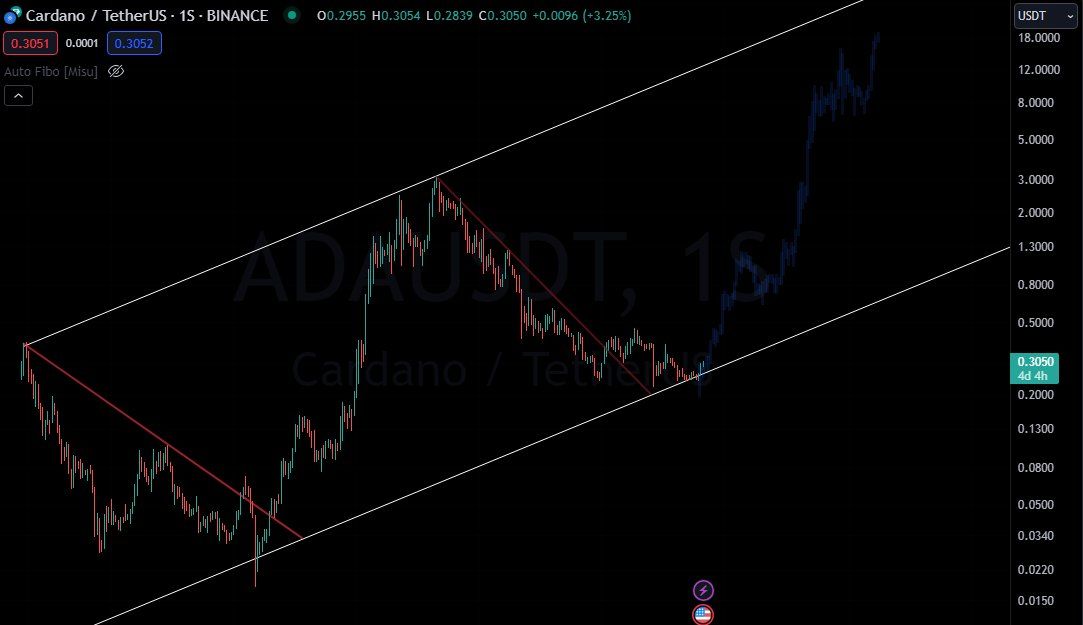
Crypto Merlin tweeted a fractal that predicts the current cycle movements by using data from the previous cycle. According to the fractal, the rate of increase will accelerate soon, the ADA price can go well into the double digits.

CryptoBusy is uncertain about the future trend’s direction since the price faces strong resistance at $0.40. He stated that:
#Cardano $ADA is facing a major resistance level! This price level has been flipping between support and resistance zones for more than 2000 days.. And just one of the technical reasons why $ADA‘s price is not going higher right now. If the price breaks through this resistance, we could see a massive move to the upside! Just be ready!
SatoshiClub is also cautious about the trend due to the failure to break out from the $0.40 resistance area. As a result, he does not consider the trend bullish until a breakout from the level occurs.
ADA Price Prediction: Will ADA Break Through $0.40?
While the weekly chart is still undetermined, the daily one is bullish. This is because of both the RSI and the price action.
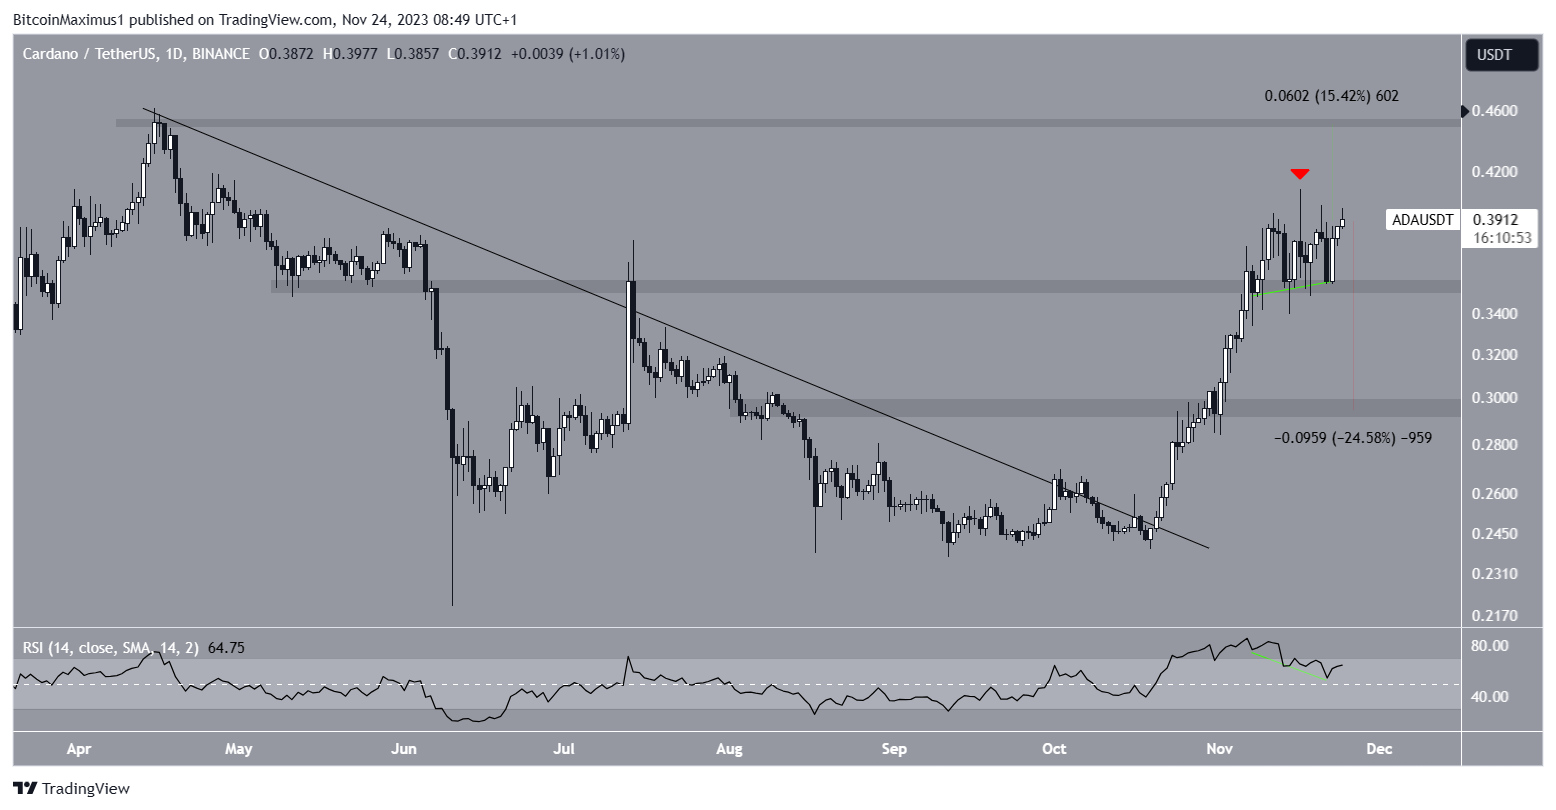
The daily chart shows that the ADA increase has accelerated since the price broke out from a descending resistance trend line on October 20.
ADA cleared the $0.30 and $0.35 horizontal resistance areas during the ascent. It is currently consolidating above the latter.
More importantly, the daily RSI has generated a significant amount of hidden bullish divergence above this support area.
This hidden divergence is a strong sign of trend continuation.
Therefore, the ADA price is expected to increase toward the next closest resistance at $0.45. This would be an upward movement of 15%.

Despite this bullish ADA price prediction, a daily close below the $0.35 horizontal support area would risk the entire upward movement. In that case, a 25% drop to the $0.30 support will be expected.
How to Stake Cardano? A Complete Guide for Beginners – YouTube
For BeInCrypto’s latest crypto market analysis, click here.
Disclaimer
In line with the Trust Project guidelines, this price analysis article is for informational purposes only and should not be considered financial or investment advice. BeInCrypto is committed to accurate, unbiased reporting, but market conditions are subject to change without notice. Always conduct your own research and consult with a professional before making any financial decisions. Please note that our Terms and Conditions, Privacy Policy, and Disclaimers have been updated.


