April was an interesting month for the cryptocurrency market, characterized by high volatility, new yearly highs, and a sharp drop. BeInCrypto looks at the crypto predictions for the upcoming month of May
The month is drawing to a close and the volatility has nearly dissipated completely. However, the month of May could bring excitement back to the cryptocurrency market.
Below are the biggest crypto predictions for May, relating to Bitcoin, the cryptocurrency market, and other popular cryptocurrencies.
Bitcoin (BTC) Price Will Reach Its First Bearish Monthly Close in 2023
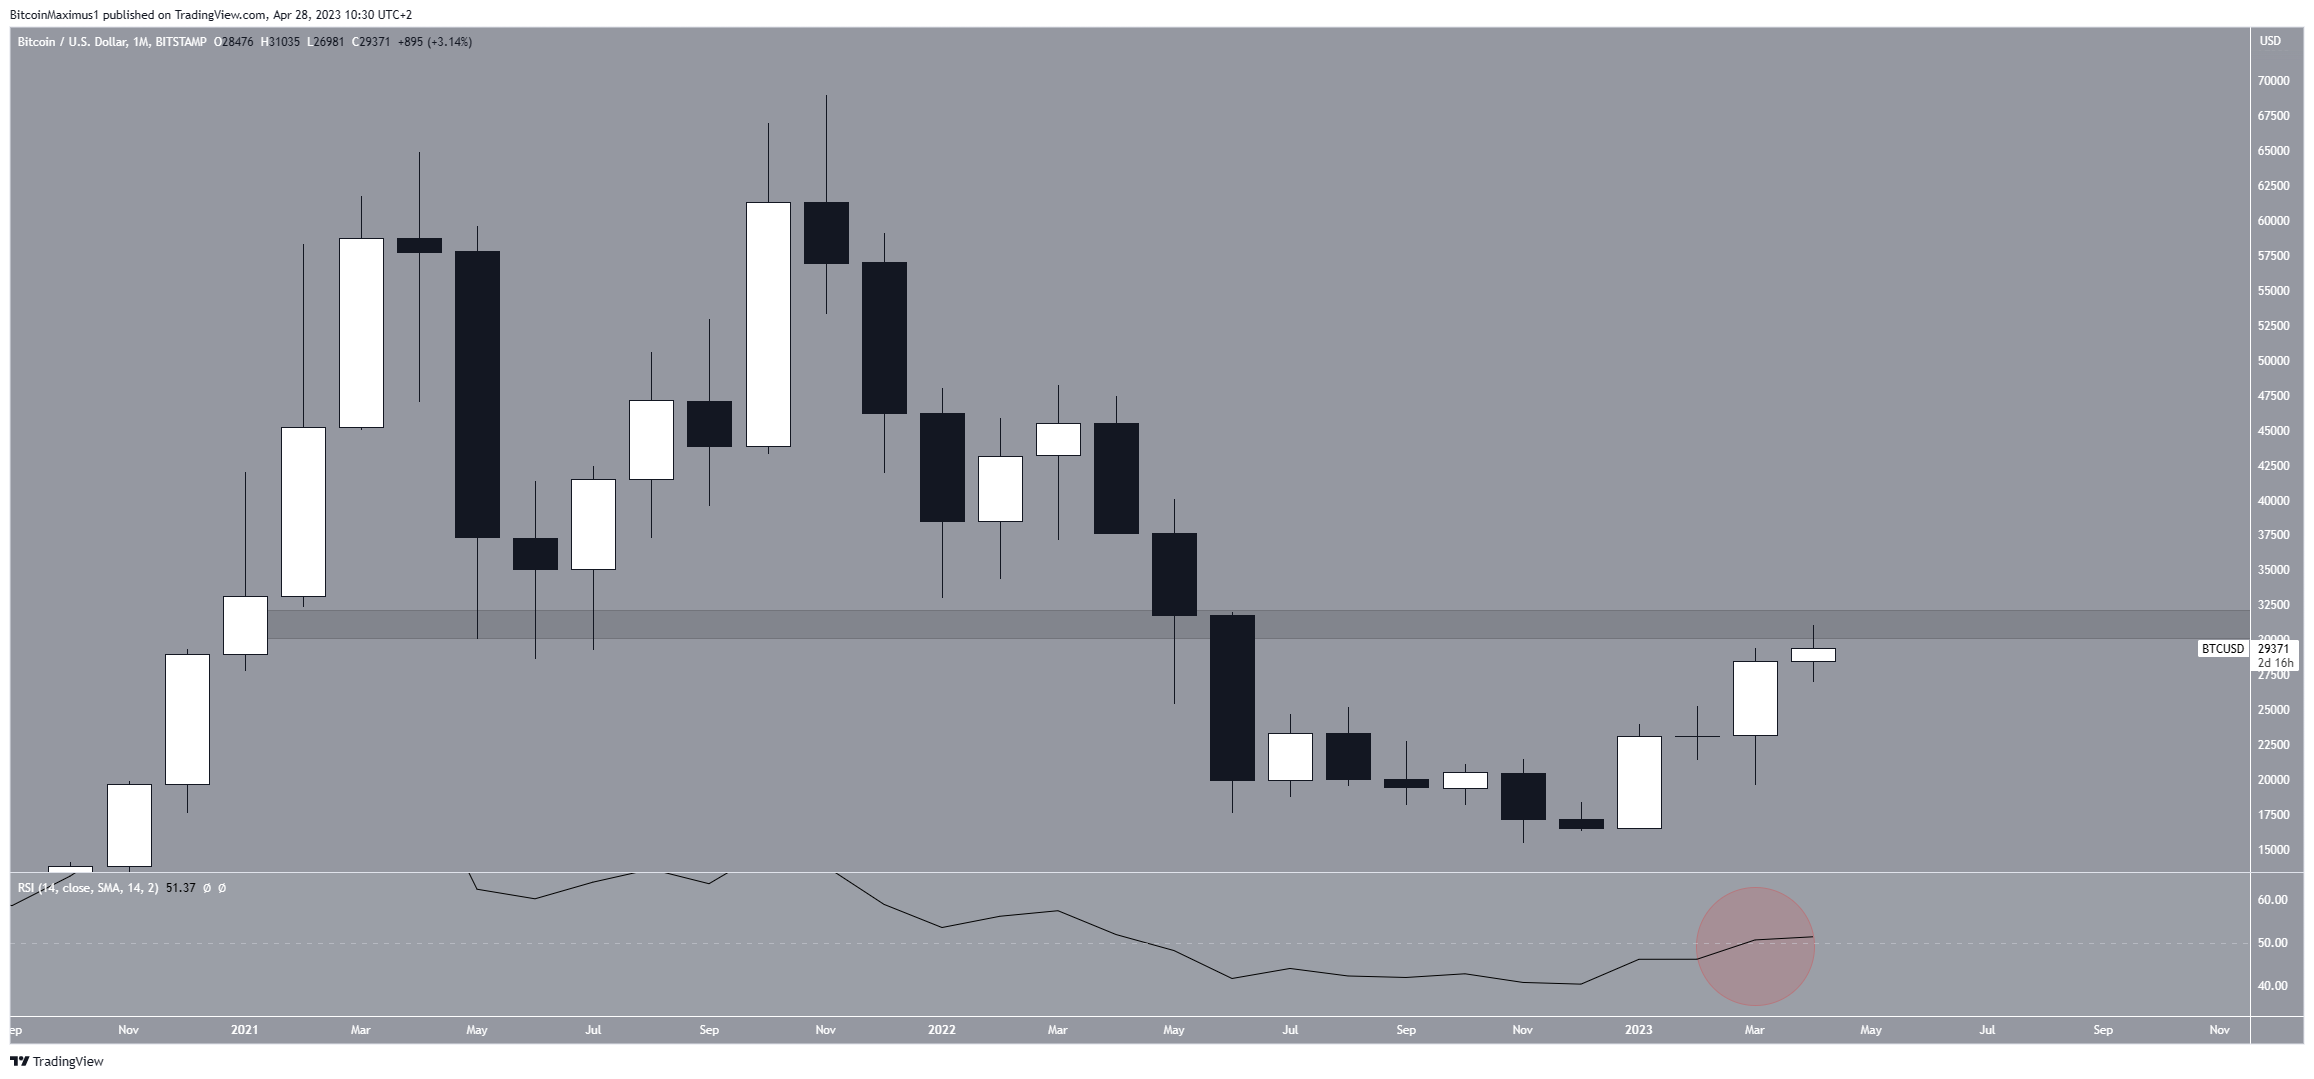
The Bitcoin price has created three successive bullish monthly candlestick closes. Unless the price closes below $28,476 in the last two days of April, the monthly candlestick will also be bullish, leading to the fourth successive such candlestick.
However, the future outlook for May does not look so bright. The main reason for this is the negative reaction to the $31,000 horizontal resistance area.
While the BTC price initially moved above it, it was rejected sharply, initiating a short-term drop. The area is crucial since it has intermittently acted as both support and resistance since the beginning of 2021.

Additionally, the weekly Relative Strength Index (RSI) looks ripe for rejection. Traders utilize the RSI as a momentum indicator to assess whether a market is overbought or oversold, and to determine whether to accumulate or sell an asset.
If the RSI reading is above 50 and the trend is upward, bulls still have an advantage, but if the reading is below 50, the opposite is true.
Since the RSI has reached the 50 line from below (red circle), it is possible that the indicator will cause rejection, aligning with the rejection from the horizontal resistance area.
If the BTC price reaches a close above the $31,000 resistance area, it will invalidate this bearish forecast and could cause a pump to $42,000.
The Bitcoin Dominance Rate (BTCD) Will Decrease Considerably
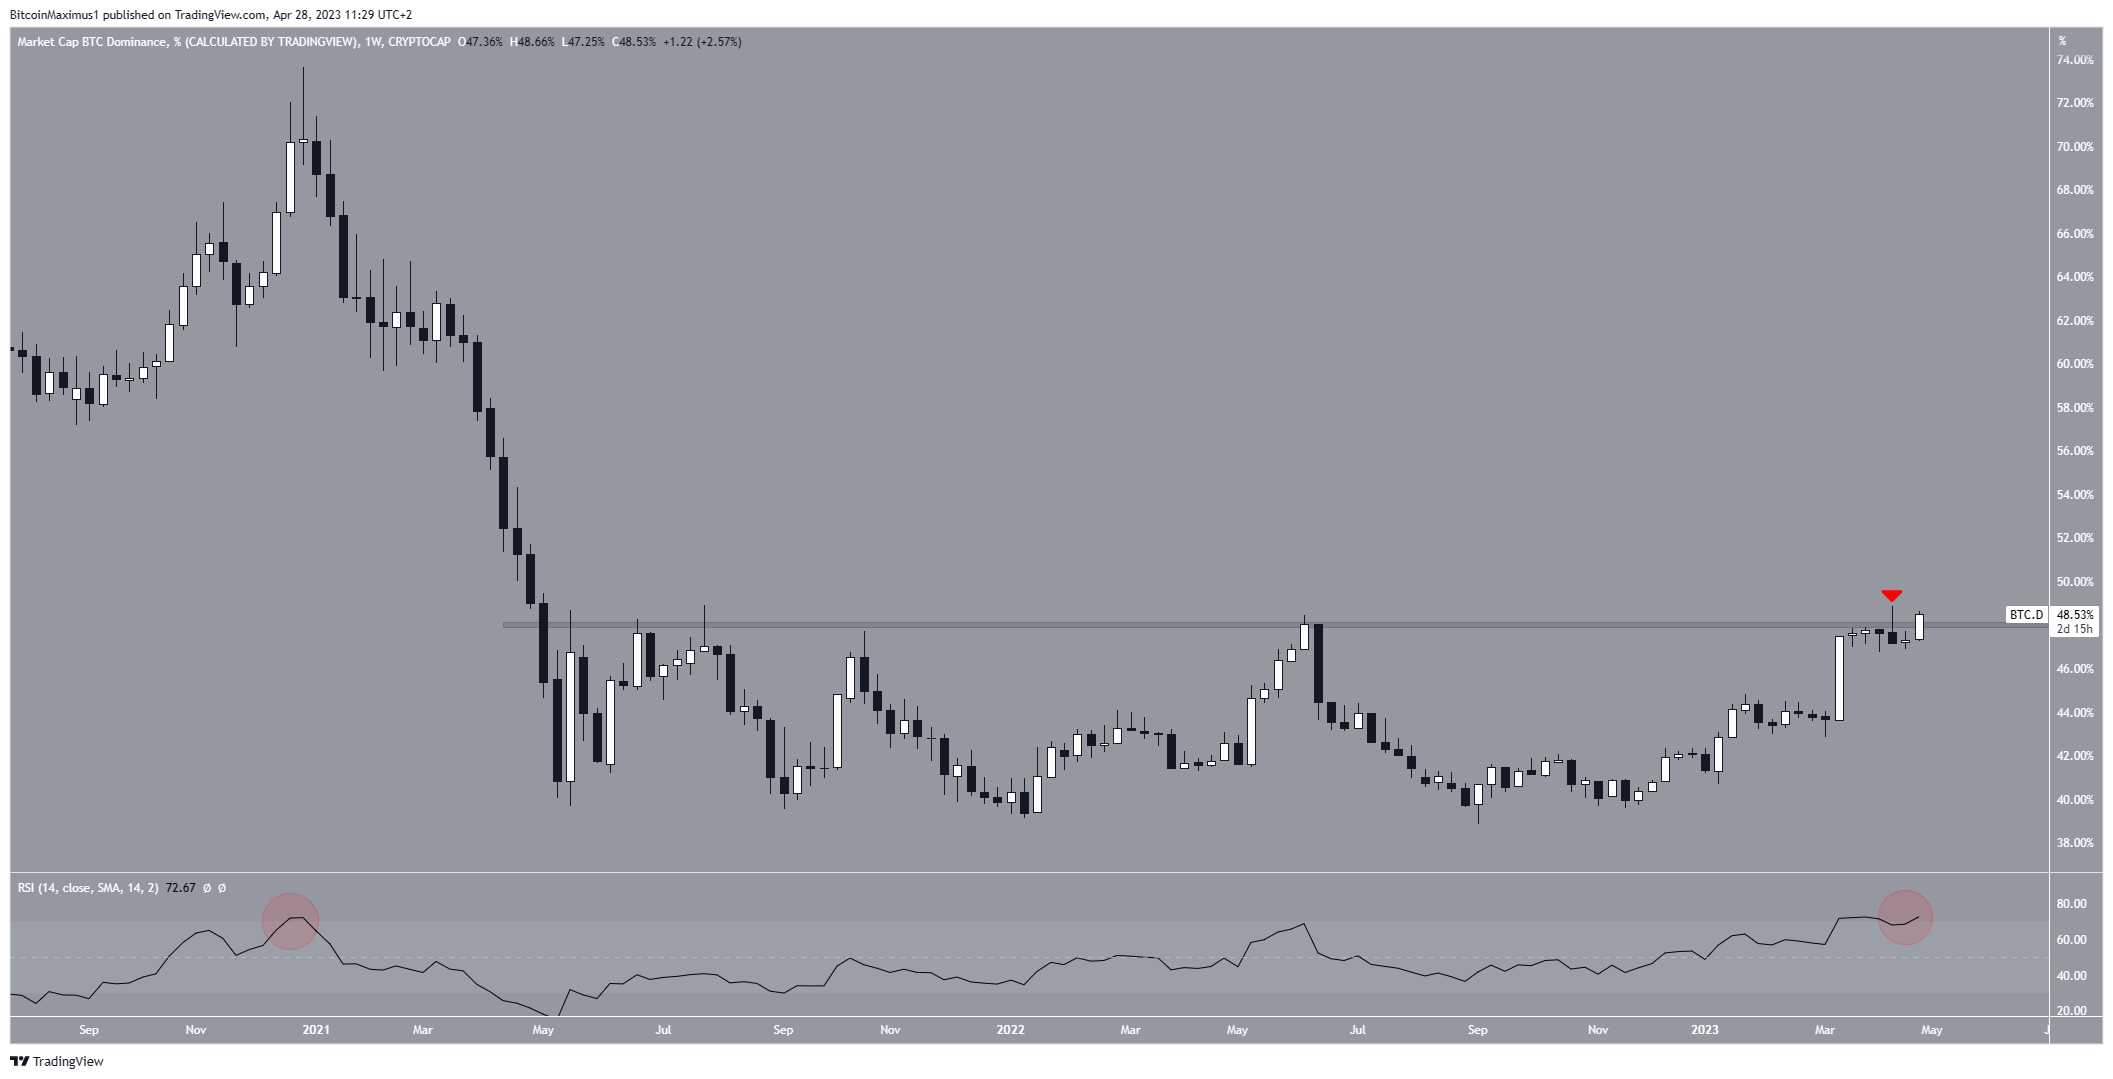
The Bitcoin dominance rate shows the relationship between the market capitalization of Bitcoin and the rest of the cryptocurrency market. a BTCD value of 48.50% means that 48.50% of the entire cryptocurrency market capitalization comes from Bitcoin.
Even though BTCD is close to a new yearly high, it shows several bearish signs. Firstly, it created a shooting star candlestick in the weekly time frame (red icon).
A shooting star is a type of bearish candlestick that is characterized by a long upper wick and a bearish close. It means that the upward movement could not be sustained, and sellers pushed the price down below the period opening.

Next, the weekly RSI is overbought. The last time it was this overbought was at the beginning of 2021 (red circle), preceding a very sharp fall.
So, it is likely that the BTCD will decrease by 42%. This forecast will be invalid by a weekly close above the 48% resistance area. In that case, BTCD could move to 62%.
Polygon (MATIC) Price Will Fall out of the Top 10
Looking at altcoins in May, crypto predictions do not favor Polygon (MATIC). Currently, MATIC is ranked in the top 10 cryptocurrencies based on its market capitalization and has been in the top 10 for a long period of time.
However, the price action shows several bearish signs that suggest the next few months will not be positive for the MATIC token price.
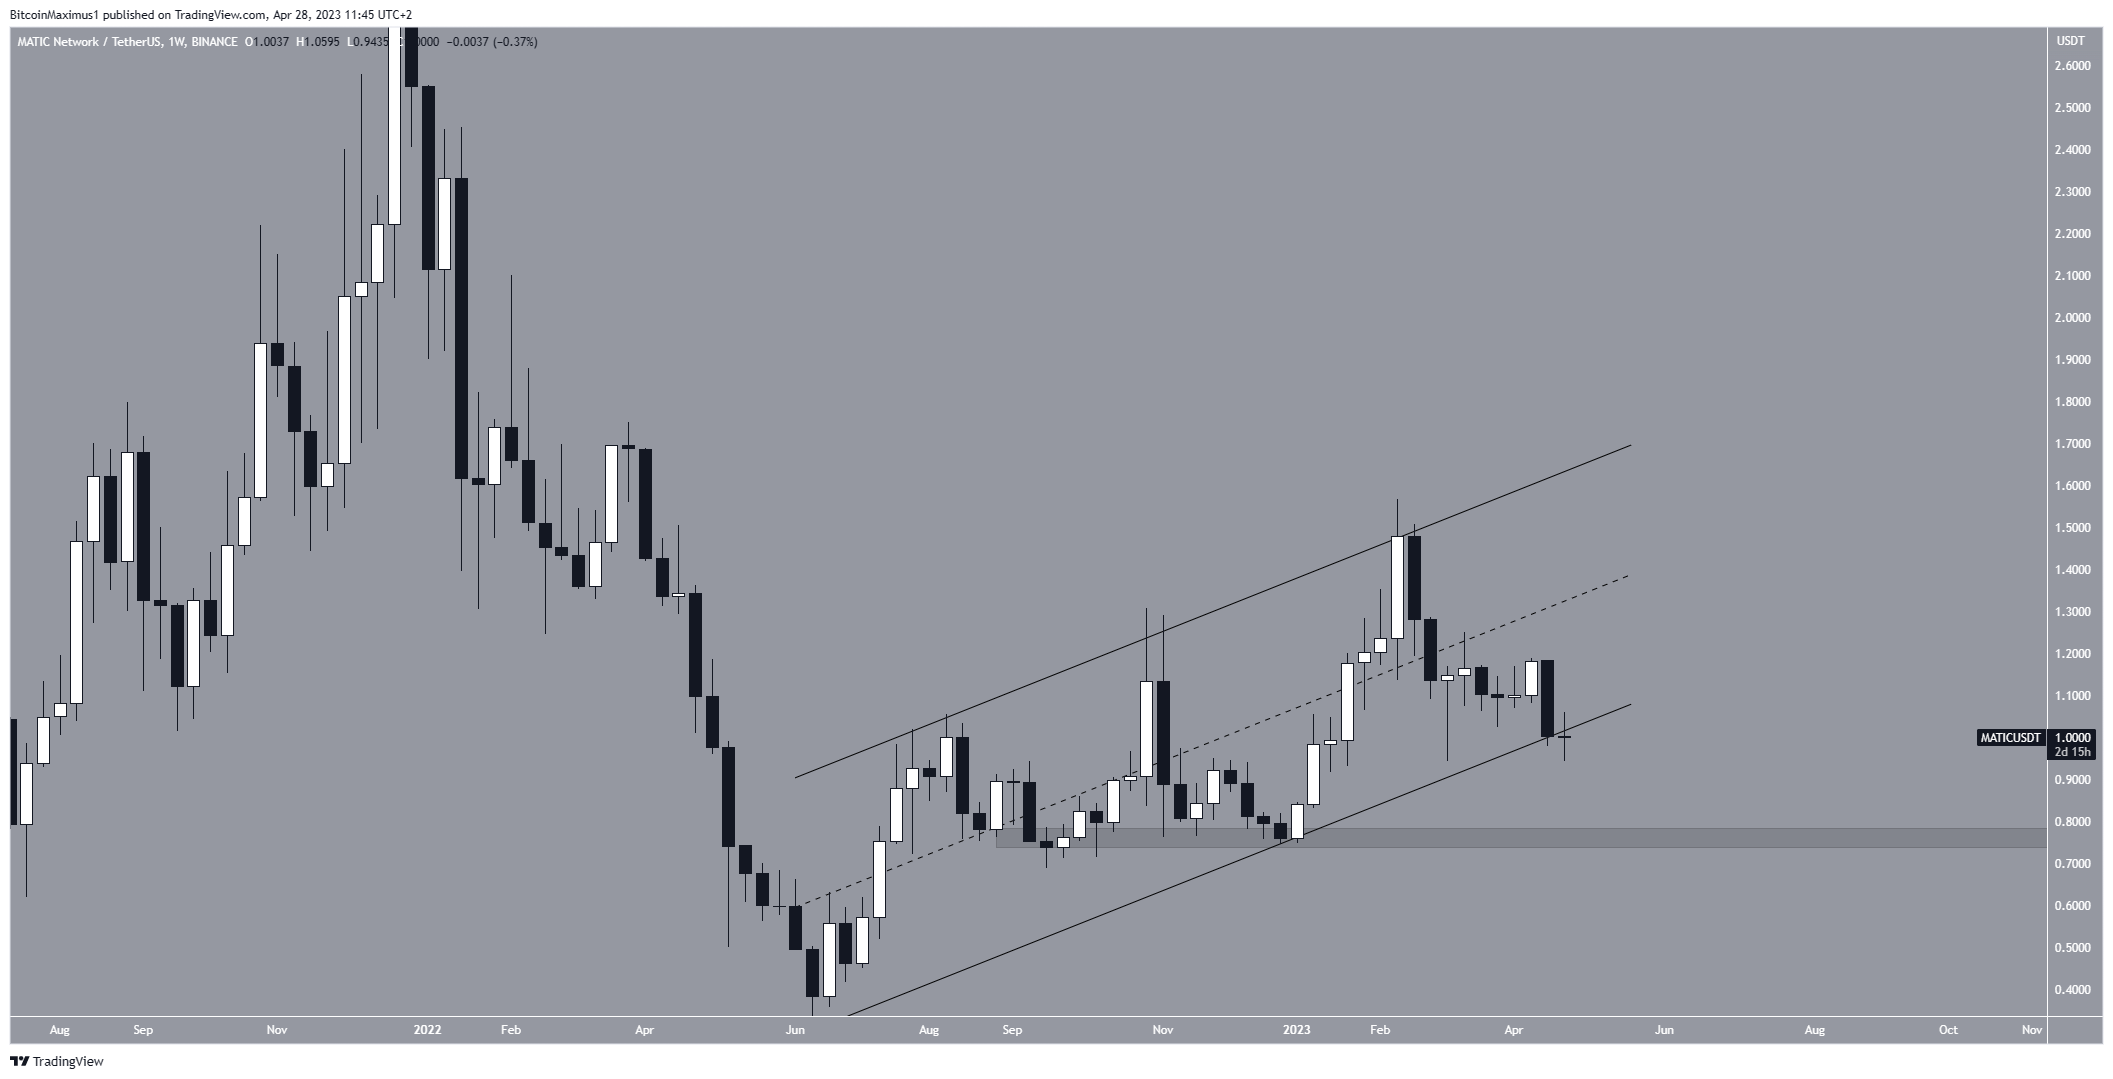
The main reason for this is the fact that the digital asset is trading slightly below the support line of a long-term ascending parallel channel.
Such channels usually contain corrective patterns, meaning that an eventual breakdown from it is the most likely scenario. If one occurs, the Polygon price could decrease toward the $0.75 support area and potentially break down below June 2022 low at $0.32.

A close back above the support line will invalidate this bearish forecast. In that case, the MATIC price can move toward the channel’s midline at $1.45.
For BeInCrypto’s latest crypto market analysis, click here
Disclaimer
In line with the Trust Project guidelines, this price analysis article is for informational purposes only and should not be considered financial or investment advice. BeInCrypto is committed to accurate, unbiased reporting, but market conditions are subject to change without notice. Always conduct your own research and consult with a professional before making any financial decisions. Please note that our Terms and Conditions, Privacy Policy, and Disclaimers have been updated.


