


On Mar 26, 2019, Zcash reached a low of $53. Since then, the price has gradually increased.
At the time of writing on Mar 27, ZEC was trading at over $57.
Is Zcash going to push forward and pass the $60 barrier or will price crashes bring new lows to the privacy coin?
Based on today’s analysis, we predict that higher prices for Zcash may be expected. However, it is possible that price losses may occur before the upward move begins.
Learn more About Privacy Coins Here!
Zcash (ZEC): Trends and Highlights for March 27, 2019
- The price of Zcash has been on a gradual uptrend since Mar 26.
- ZEC has been trading in an ascending channel.
- It is possibly moving above a long-term resistance line.
- There are resistance areas near $64 and $59.
- There is support near $55 and $53.50.
Ascending Channel
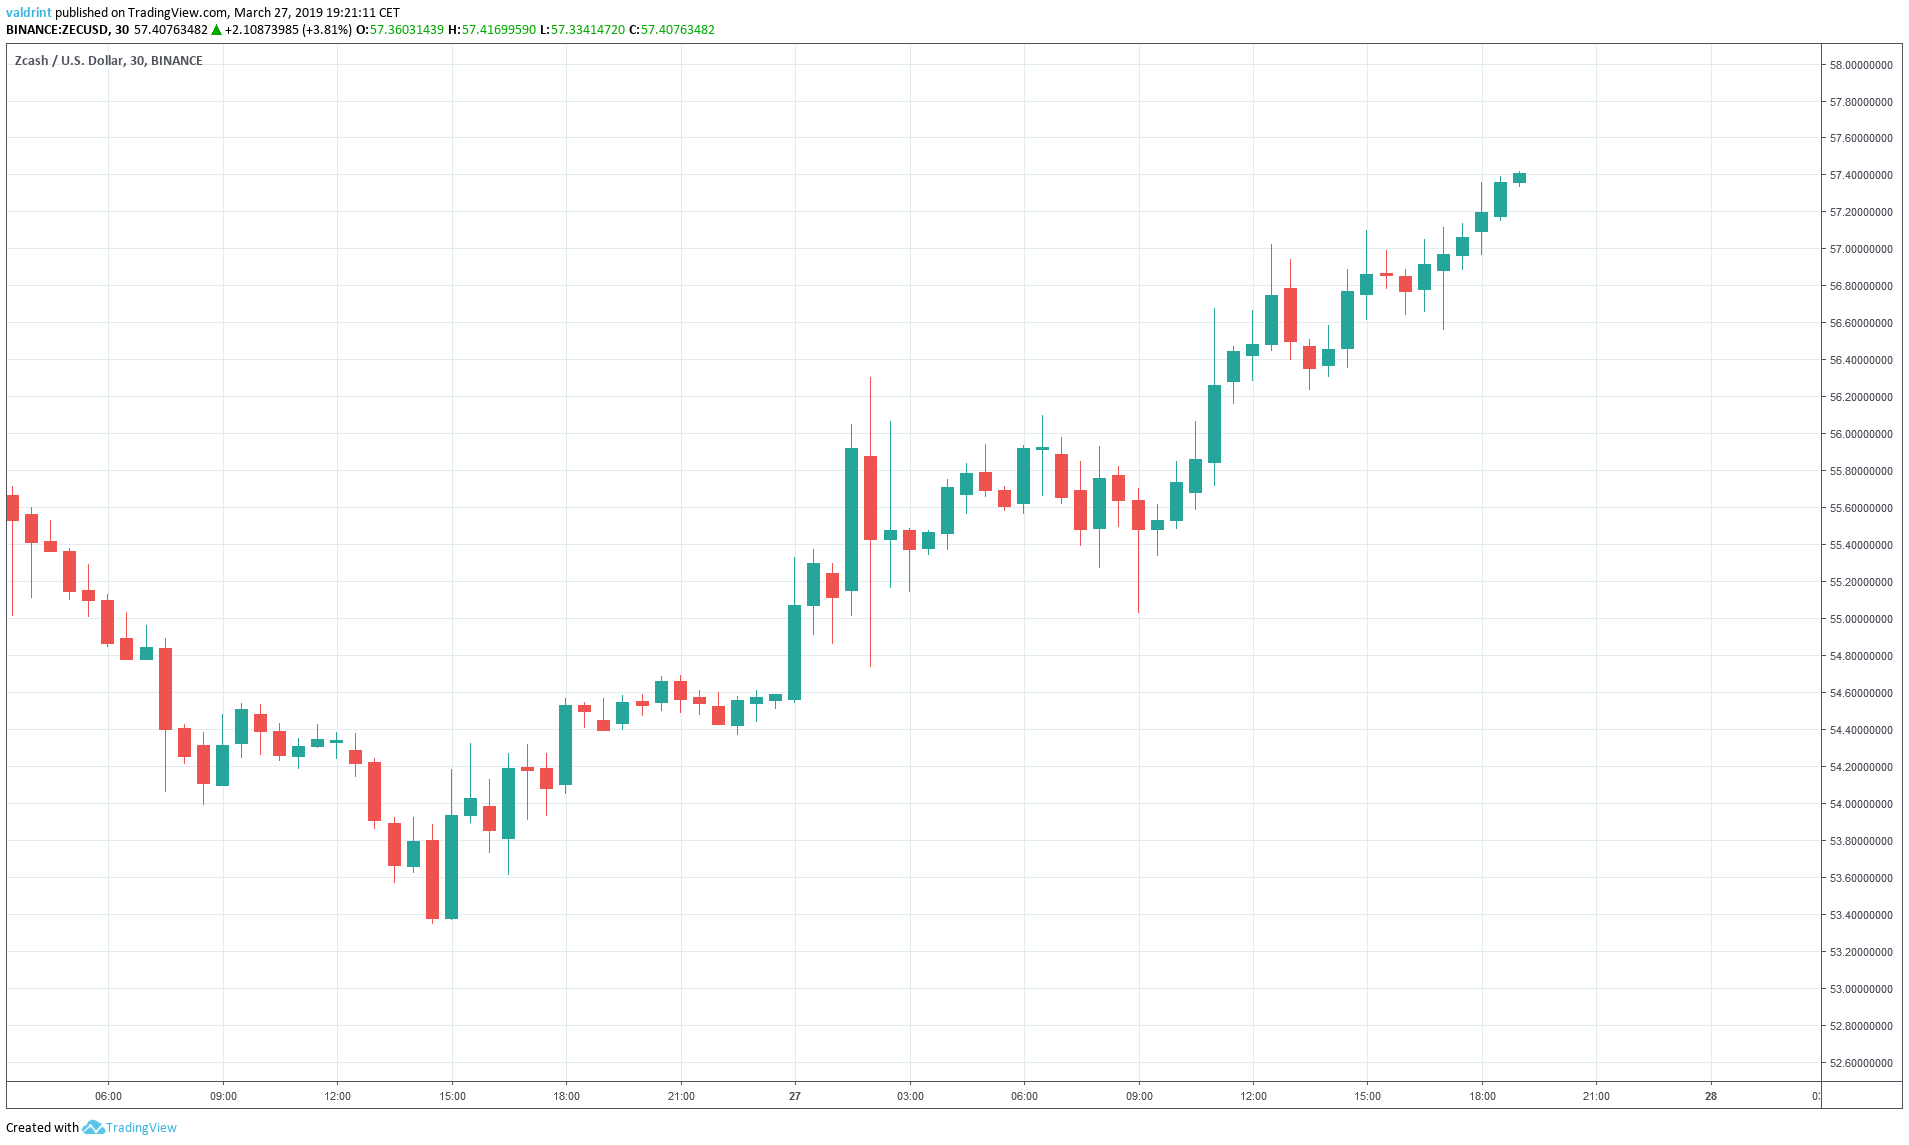
To begin, we trace Zcash’s current trading pattern by defining resistance and support lines. To do this we examine the price of ZEC on Binance is analyzed at thirty-minute intervals from Mar 26 to Mar 27.
The price made a low of $53.60 on Mar 26. A gradual upward move followed. Several market cycles have been completed since and after each one the lows have been higher than the preceding ones.
Tracing these lows gives us an ascending support line:
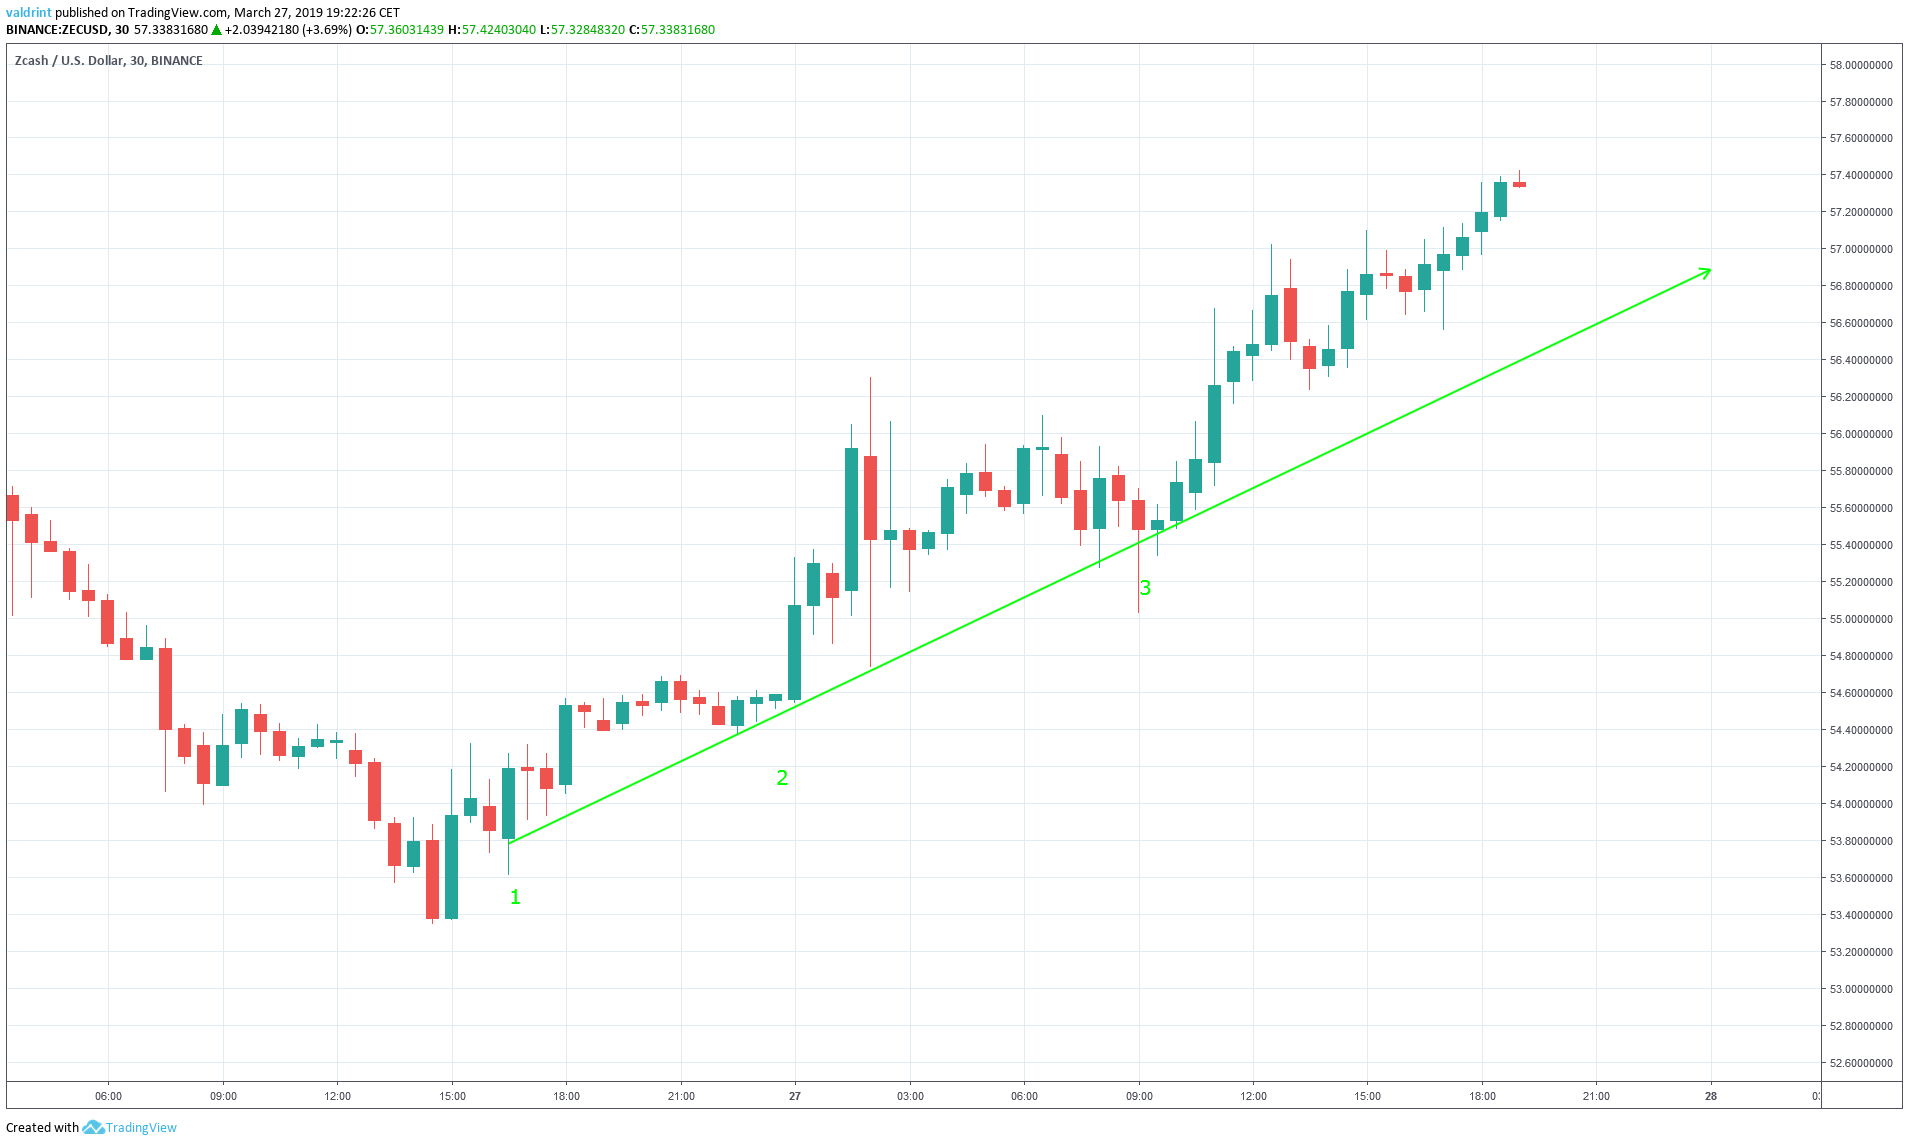
The support line can act as a floor to price, preventing further downward movement. It theoretically traces the lower limits of price over a given period of time.
Furthermore, the price made a high of $54.50 on Mar 26. A gradual uptrend followed.
During this period, several market cycles were completed. At the peak of each, a higher high was made. Tracing these highs gives us an ascending resistance line:
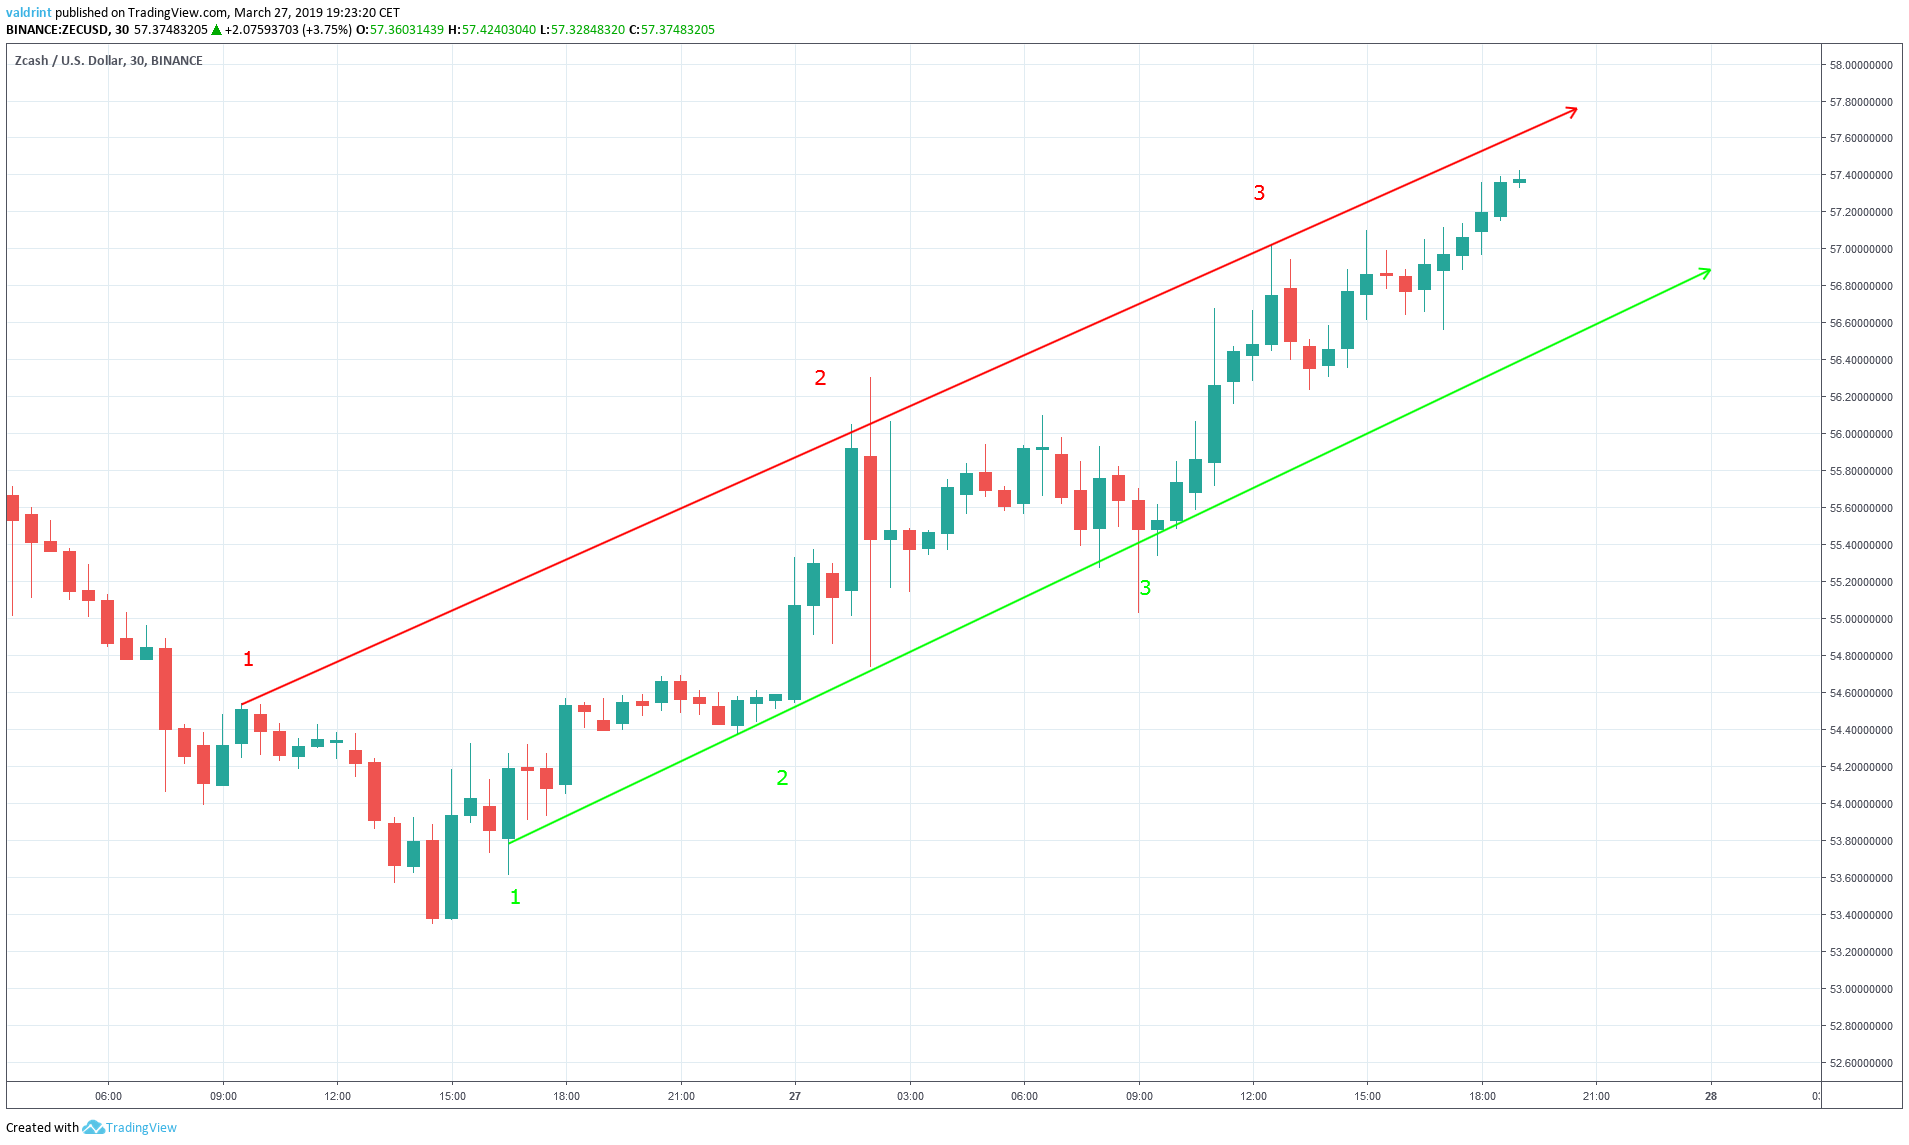
Similar to the support line, the resistance line can act as a ceiling to price, preventing further upward movement. Together, the resistance and support lines combine to create an ascending channel. This is a generally neutral trading pattern. Prices are likely to increase and decrease within the channel over time.
However, the channel is upward facing. This means that despite short-term highs and lows, long-term growth should be expected.
Because Zcash is currently trading near the resistance, a drop back toward support appears likely. The next low may validate the resistance line for the fourth time.
At some point, a breakout above support or breakdown below resistance remains possible. To determine future movements within, above, or below the channel, we must incorporate technical indicators into our analysis.
RSI Divergence
We begin our analysis by examing the relative strength index (RSI). Combining RSI bullish/bearish divergence with support/resistance essentially predicts price fluctuations.
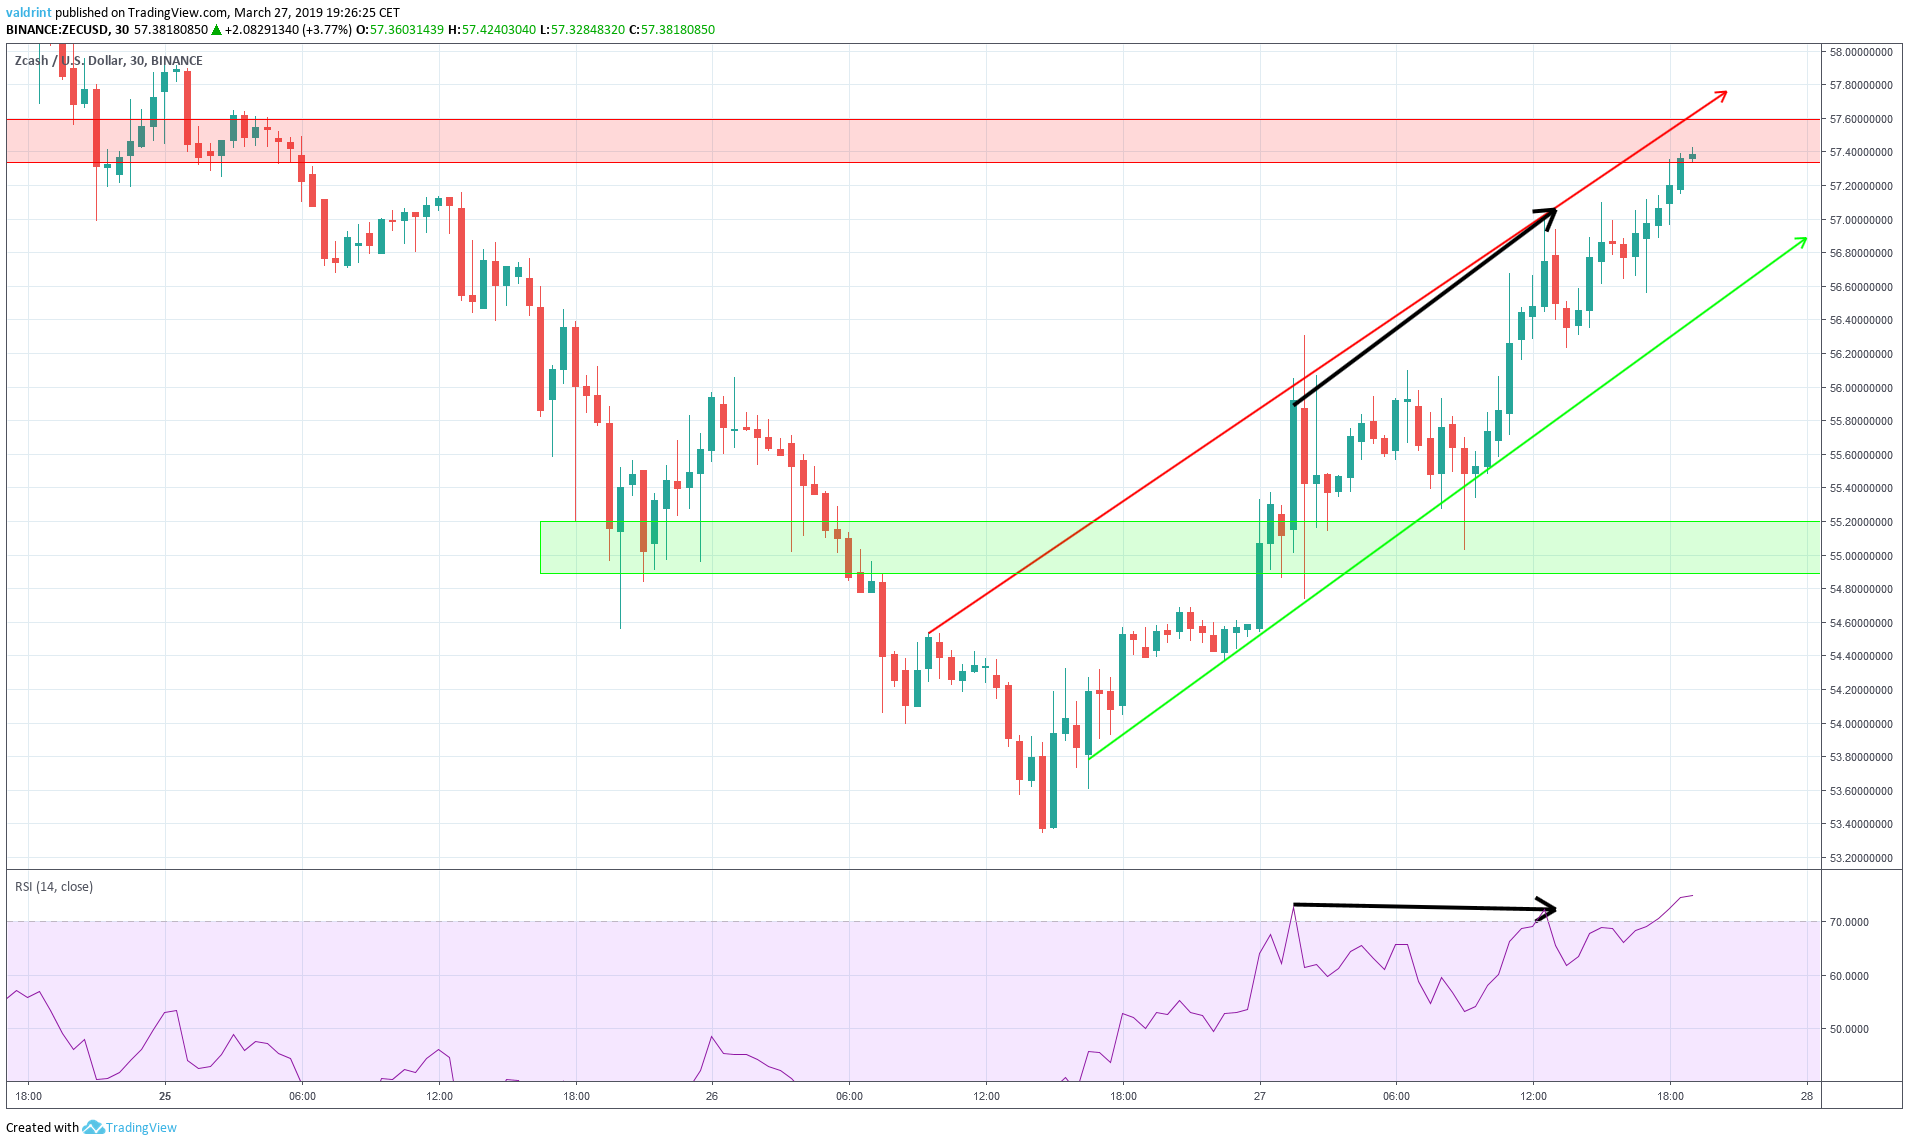
On Mar 27, the price made a high of $56.30. It reached a higher high of $57 later that day. Similarly, the RSI made its first high during the same interval. However, it proceeded to create a similar, slightly lower high.
This is known as bearish divergence and often precedes price decreases.
However, it is not significant in value and is occurring in a neutral pattern, reducing its validity.
The use of this indicator is not sufficient in predicting whether or not a breakout or breakdown will occur. It also does not aide in determining whether price will move up or down within the channel.
Possible Breakout?
To further assess future price fluctuations, we must analyze Zcash on a longer times frame. In order to do that, we need to take a look at a longer time frame.
We now examine the price of ZEC on Binance is analyzed at two-hour intervals from Mar 18 to Mar 27 in order to better visualize previous market movement. In addition, we incorporate trading volume into this part of the analysis.
Tracing the highs during this period gives us a descending resistance line:
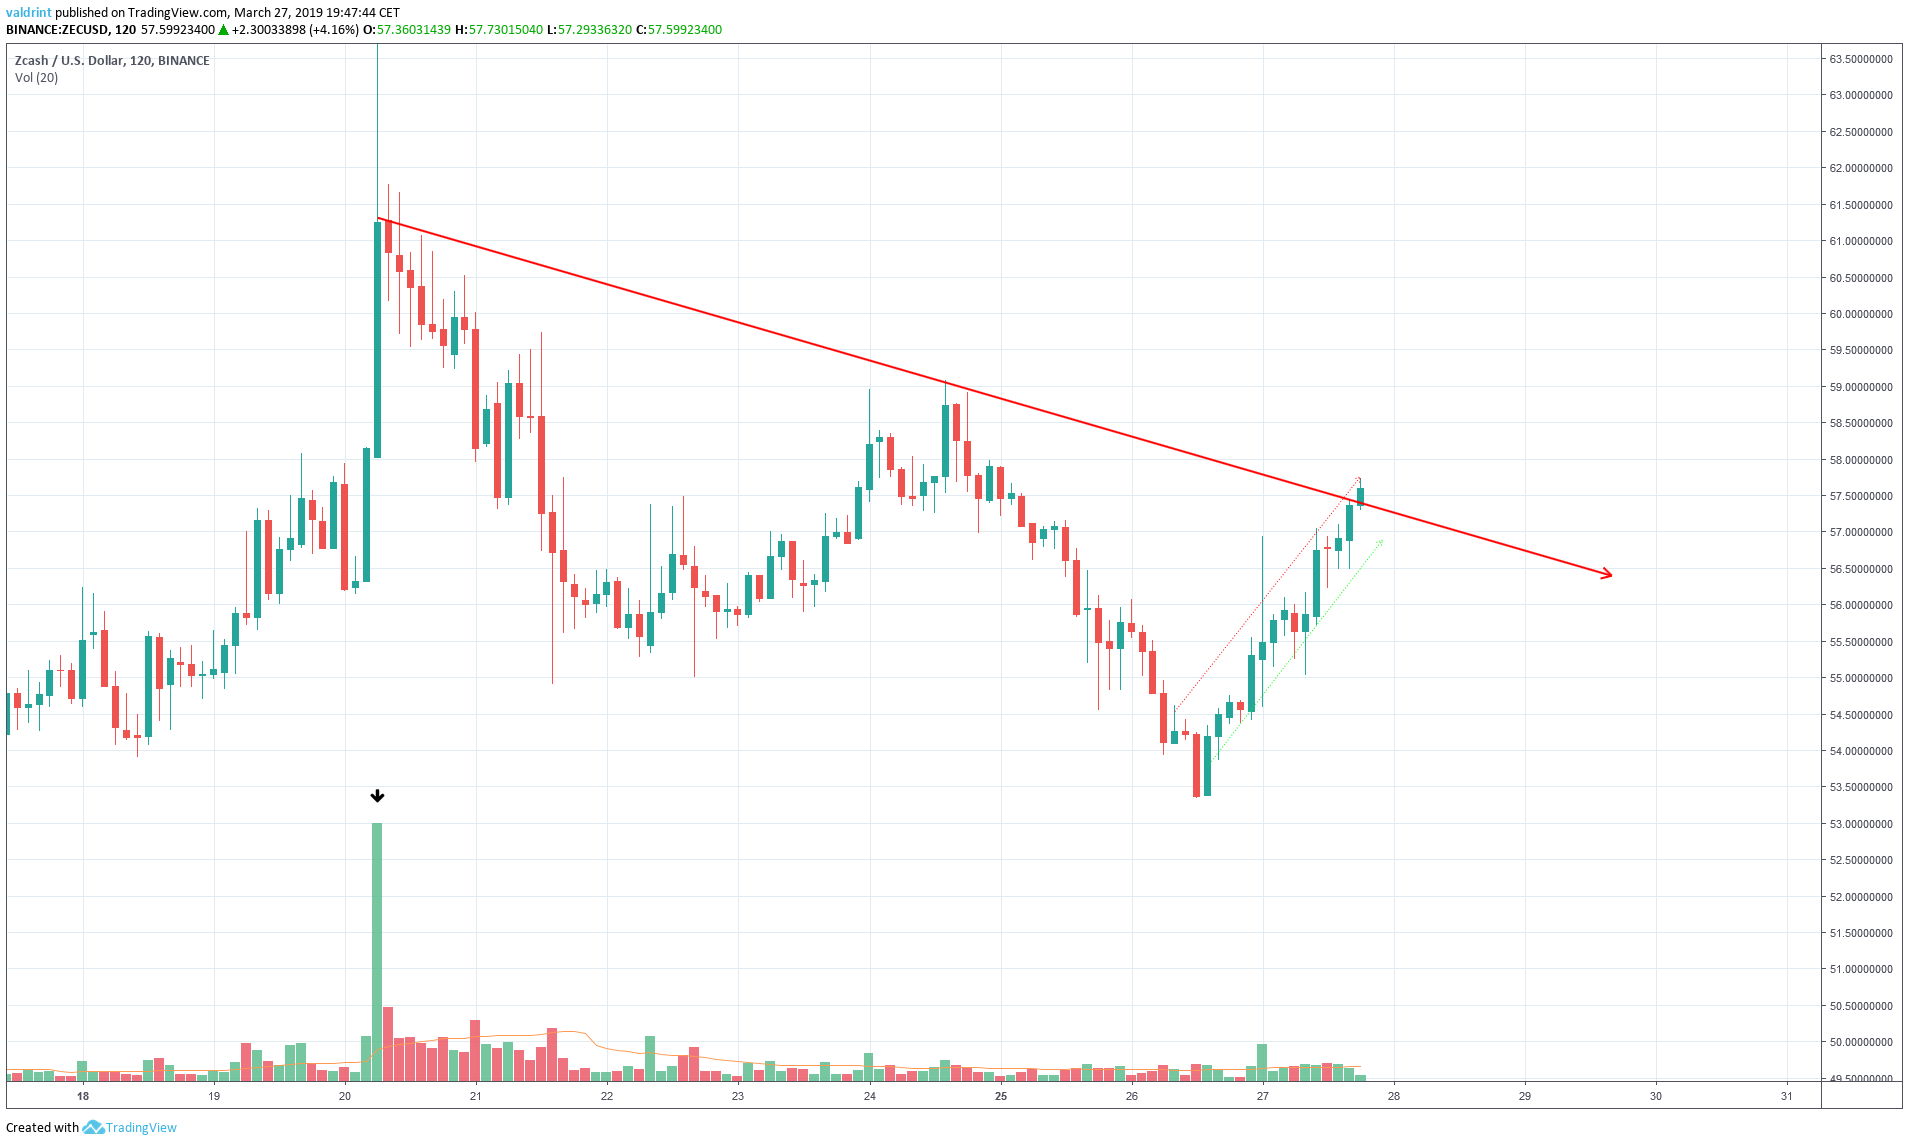
On Mar 20, the price made a high of $63.70. Around the time that this high was reached, there was a significantly higher volume. Susbequently, trade volume dropped and so did prices.
Such an occurence does not now appear to be occuring. Volume appears to be near normal levels. While it appears that Zcash may in the process of a breakout, it is too early to be certain.
The level of volume—which otherwise could be an indicator—is only partially helpful. Given that the level of trading is significantly lower than before the Mar 20 and subsequent decline, we can predict a different sort of behavior.
A crash seems unlikely as long as volume continue trading at normal levels. Because these levels of volume have been carrying Zcash to higher highs, we might expect this to continue. However, sudden shifts in volume might cause sudden shifts in price—either up, down, or both.
We are currently predicting increases based on the current pattern. It is possible that Zcash will break
Reversal Areas
Now we will attempt to determine possible resistance and support areas for Zcash. These are formed when the price reaches a certain level several times. They can act as a ceiling/floor that prevents the price from moving further in that direction.
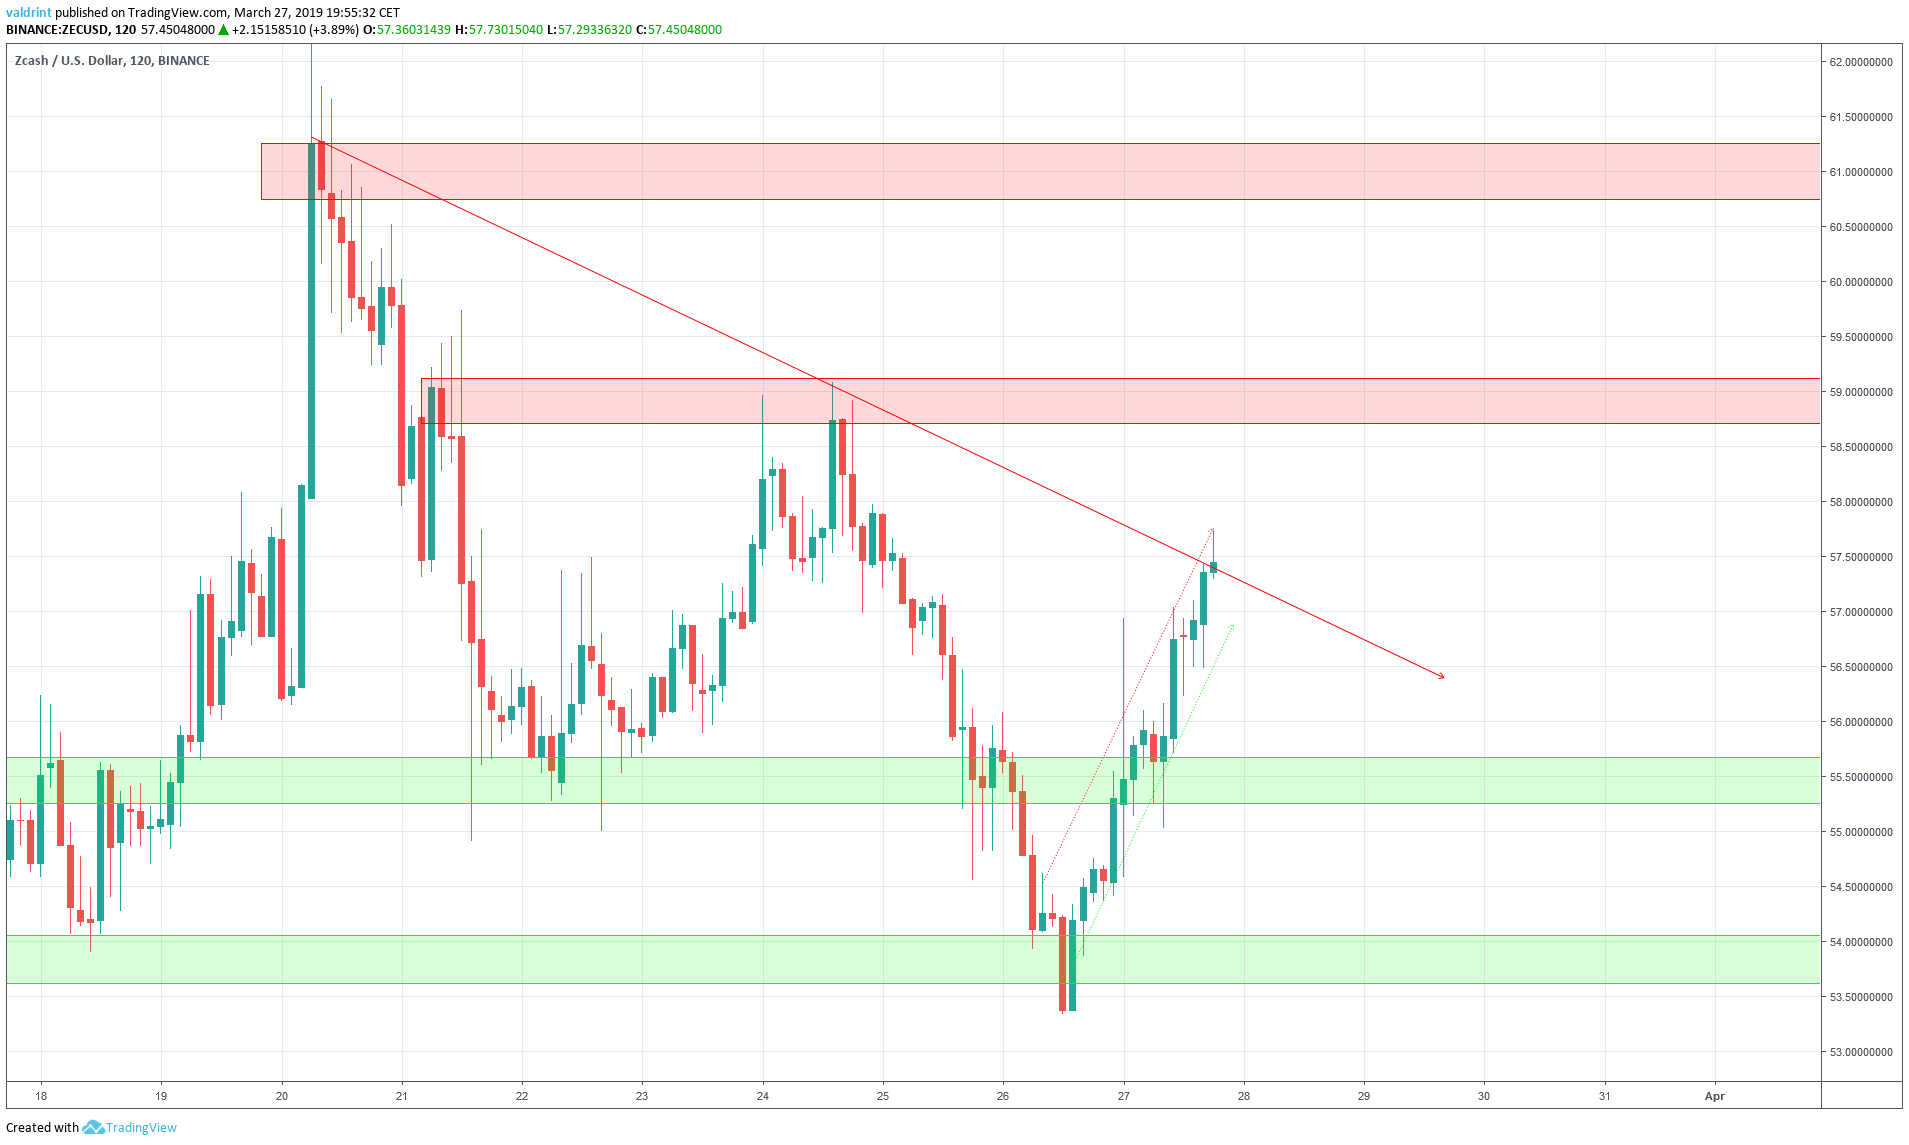
The first resistance area is found near $59. The second one can be found near $64. If the price keeps moving upward, they will provide likely reversal areas. Based on our analysis, it is likely that the price reaches at least one of these areas. If the $59 level is breached, we may see Zcash reach $60; however, it might subsequently drop before reaching the second support of $64.
The closest support area is found near $55, followed by the second one near $53.5. Based on our analysis, it is unlikely that the price will stabilize around this area unless there are significant fluctuations in the volume of ZEC traded. However, prices may drop toward these support areas before a susbequent rise toward $60.
Summary of Analysis
Based on this analysis, the price will likely continue increasing in the near future. However, it is possible that it first drops to the temporary support of around $55 before prices rise toward $60. If the price reaches the first resistance area near $59 without a prior drop, our prediction will be partially validated. However, a drop toward the support followed by a rise toward the resistance would fully validate the prediction. A breakdown below $54 would invalidate the prediction.
Do you think the price of ZEC will increase to the second resistance level of $64? Let us know in the comments below.
Disclaimer: This article is not trading advice and should not be construed as such. Always consult a trained financial professional before investing in cryptocurrencies, as the market is particularly volatile.


