


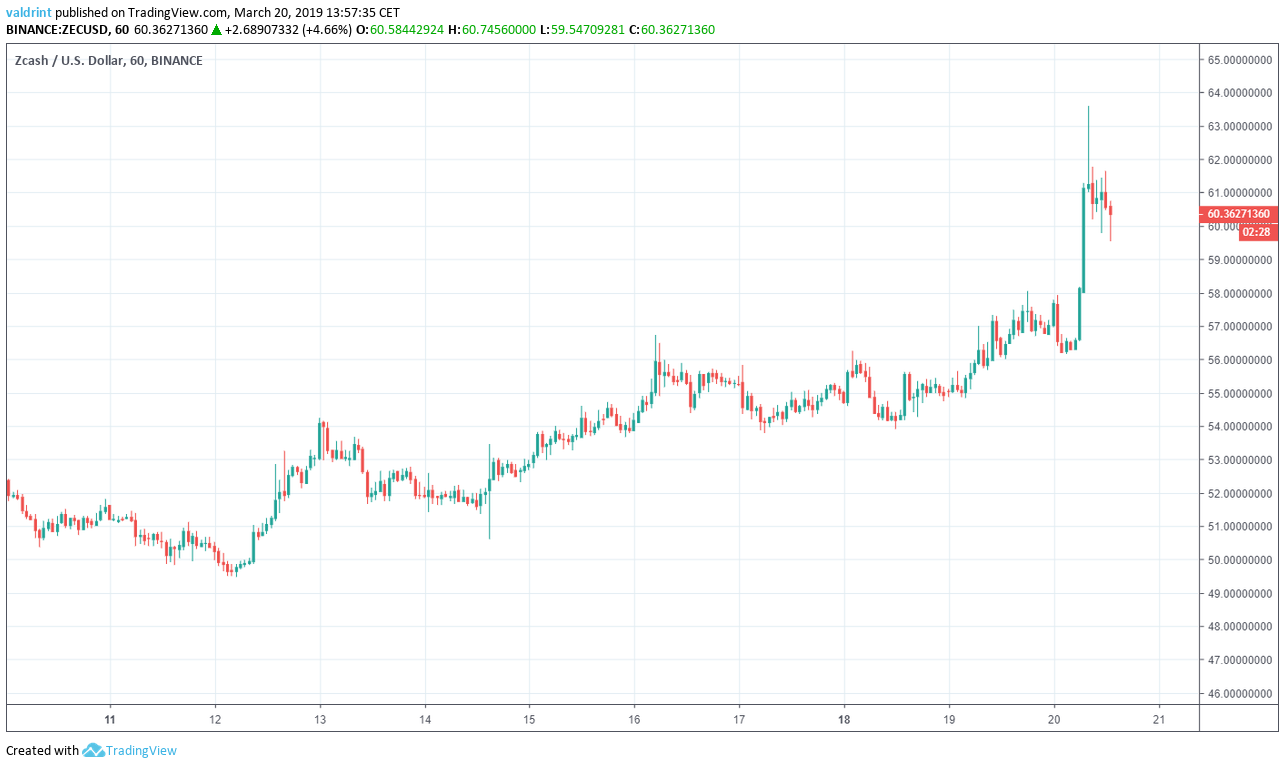
On Mar 12, 2019, the price of Zcash (ZEC) reached a low of nearly $50. A gradual uptrend followed with a rapid upward movement initiated on Mar 20. At the time of writing, ZEC had already exceeded $60.
How high will the prices going? Should we expect a correction in the near future?
Before we answer these questions, let’s take a look at the price of Zcash between Mar 11 and Mar 20.
In our Mar 14 analysis, we predicted that the price would increase past support. By the highs on Mar 16, our prediction had been sufficiently validated.
Read Our Mar 14 Zcash Price Analysis Here!
Based on today’s analysis, we predict that future prices for Zcash may be expected. However, prices losses may occur to correct for the recent spike before prices rise again.
Do you want to know how we derived this prediction? Find out in our detailed Zcash analysis below:
Zcash (ZEC): Trends and Highlights for March 20, 2019
- The price of Zcash has been on a gradual uptrend since Mar 12.
- ZEC had been trading in an ascending channel prior to this point.
- A breakout occurred on Mar 20 leading to prices over $60.
- The breakout was done in significant volume.
- There are resistance areas near $64 and $72.
- There is support near $56.
Tracing Support
The price of ZEC on Binance is analyzed at one-hour intervals from Mar 12 to Mar 20, 2019.
The price made a low of $49.46 on Mar 12. A gradual upward move began. Several market cycles have been completed since and after each one the lows have been higher than the preceding ones. Tracing these lows gives us an ascending support line.
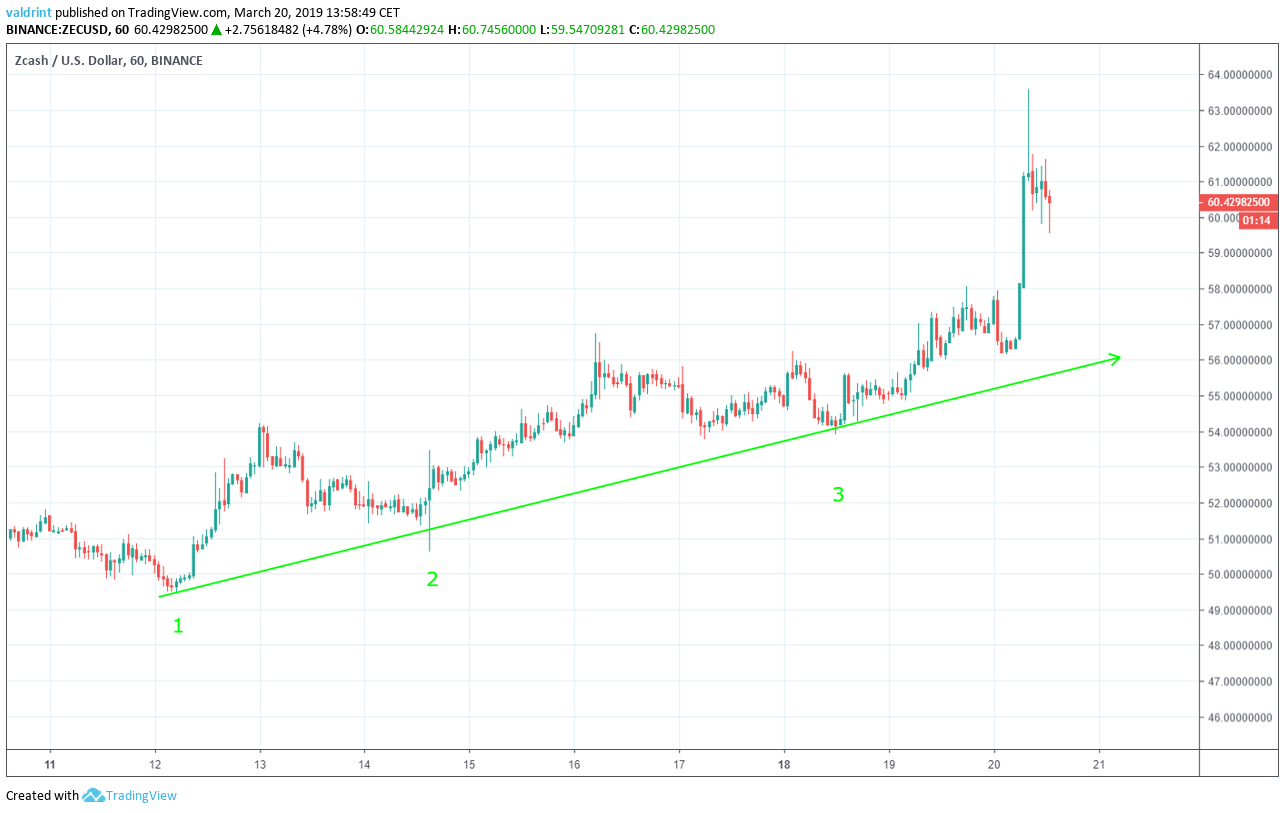
The support line can act as a floor to price, preventing further downward movement. It theoretically traces the lower limits of price over a given period of time.
Initially, the price increased at the same rate as predicted by the support line before accelerating on Mar 20.
Wick breakdowns below the support line can be considered insignificant if they are not succeeded by continuous price decreases. This was the case with the wick low of $50.61 on Mar 14 since the price immediately rebounded to above the support line.
Price increases at the rate predicted by the line or faster were to be expected until the rapid breakout that occurred on Mar 20. At the current time, prices have dropped and decreases may continue for a short while to correct for some of these unexpected gains. However, prices are likely to stabilize above current support. At that time, new support will likely be generated.
Ascending Channel And Breakout
The price made a high of $54.22 on Mar 13. A gradual downward move followed the same day and into Mar 14. Later in the day, a subsequent reversal occurred with steady price increases following until the current time.
During this period, several market cycles were completed. At the peak of each, a higher high was made. Tracing these highs gives us an ascending resistance line.
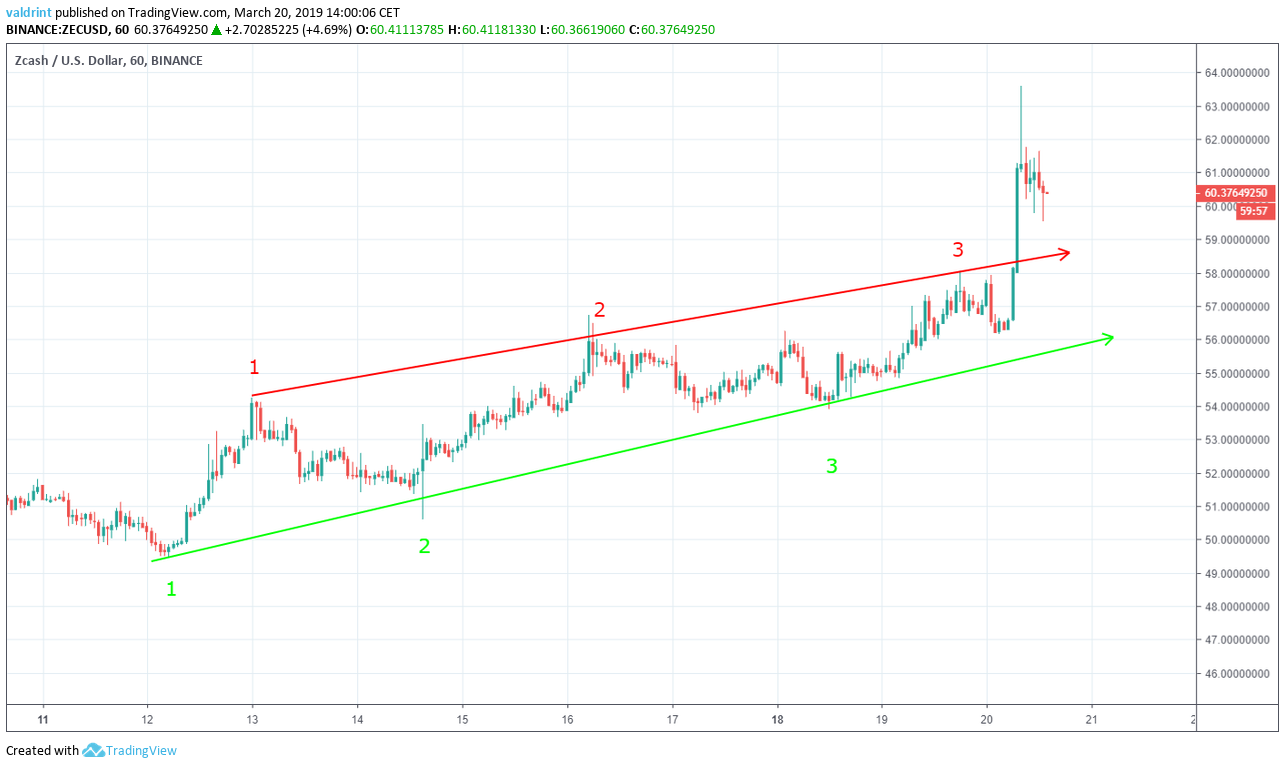
The resistance and support lines combine to create an ascending channel, which is a neutral pattern, making price increases and decreases equally likely.
A breakout occurred on Mar 20.
Based on the breakout from this pattern, it is likely that the price of ZEC will continue to increase and create different support and resistance lines. However, it is possible that it initially drops to validate the resistance line before moving upward.
Breakout Validity
Volume is a measure of how much of a certain asset is traded in a certain period of time.
Combined with breakouts and breakdowns from patterns, it can be used as a confirmation tool about the validity of a movement.
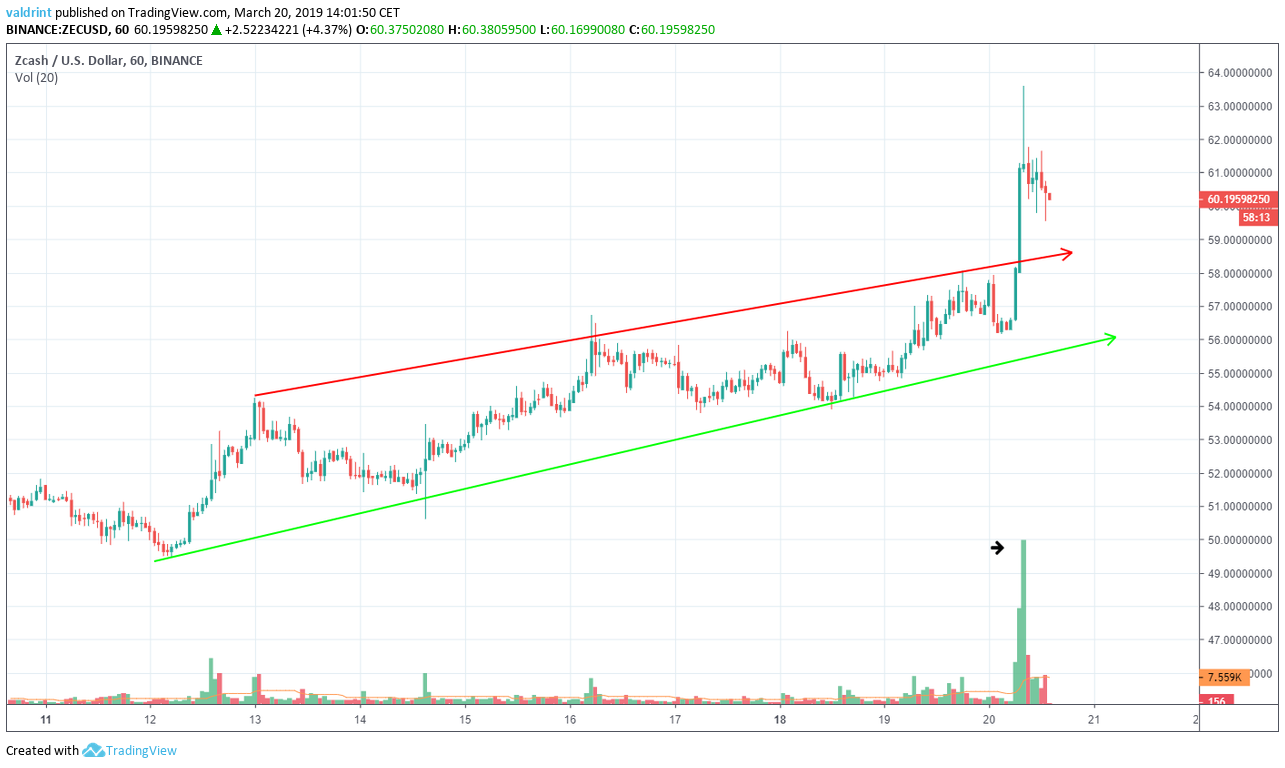
We can see that on the two candles in which the breakout occurred, the volume was close to ten times as large as the average volume from Mar 12 to Mar 20.
Based on this indicator, it is likely that the breakout will lead to new support and resistance lines. The current channel does not any longer appear an accurate indicator of future prices. It is likely that prices will still drop toward the resistance but unlikely that it will reach support. Prices are likely to stabilize above resistance and generate a new trading pattern.
Reversal Areas
The price of ZEC on Binance is analyzed at six-hour intervals from Dec 24, 2018 to Mar 20, 2019 in order to better visualize possible reversal areas.
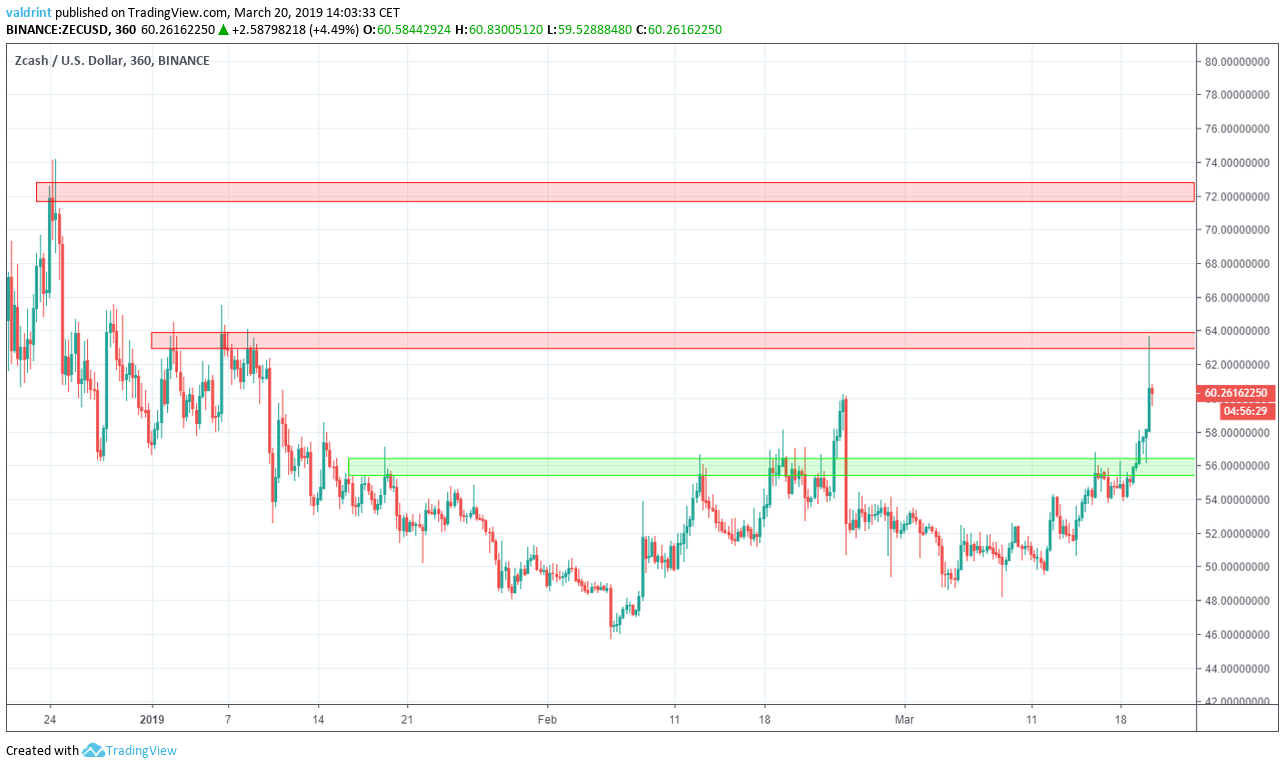
Resistance and support areas are formed when the price reaches a certain level several times. They can act as a ceiling/floor that prevents the price from moving further in that direction.
The first resistance area is found near $64. The second one can be found near $72. If the price keeps moving upward, they will provide likely reversal areas. Based on our analysis, it is likely that the price reaches at least one of these areas.
The closest support area is found near $56. Based on our analysis, it is unlikely that the price will stablize around this area. However, prices may reach this point before a subsequent rise toward the resistance areas of either $64 or $72.
Summary of Analysis
Based on this analysis, the price will likely continue increasing in the near future. However, it is possible that it first drops to validate the resistance line and possibly temporary support of around $56. A temporary breakdown below this point may also be possible before a reversal.
If the price drops toward support before a subsequent, rise to resistance levels of $64 or $72 will fully validate this prediction. Continued rises without losses would also validate the prediction. If a drop below $56 occurs with prices stabilizing at or below that level, then the prediction will be invalidated.
Do you think the price of ZEC will increase to the second resistance level of $72? Let us know in the comments below.
Disclaimer: This article is not trading advice and should not be construed as such. Always consult a trained financial professional before investing in cryptocurrencies, as the market is particularly volatile.


