


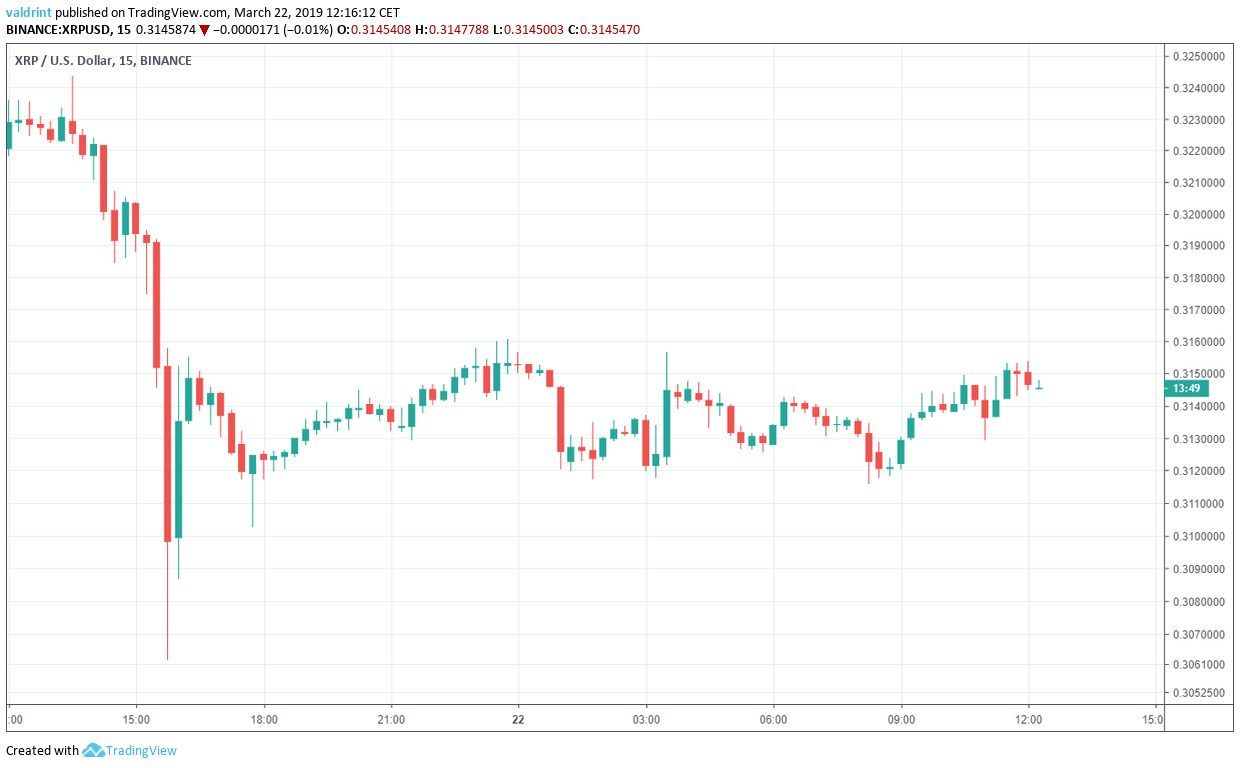
On March 21, 2019, the price of XRP (XRP) made a high of $0.324. A rapid decrease followed, and a low of $0.306 was experienced later in the day. XRP since appears to have begun a slow uptrend.
Was this rapid decrease a sign of things to come?
In our Mar 21 XRP analysis, we predicted that XRP—still known widely as Ripple— would soon touch the resistance line of the triangle again. Our prediction was invalidated later that day when XRP broke down from the triangle.
It is worth mentioning that the flash crash was not limited to XRP. It seems to have affected a large portion of the entire cryptocurrency and digital asset market.
Based on today’s analysis, we believe that XRP may experience near-term losses before price begin to rise further.
XRP (XRP): Trends and Highlights for March 22, 2019
- The price of XRP experienced a flash crash on Mar 21.
- XRP was trading within an ascending wedge, but a new horizontal channel appears to have emerged recently.
- There is bullish divergence developing in the RSI and the MACD.
- There are resistance areas near $0.345 and $0.33.
- There is support near $0.310 and $0.304.
Previous Breakdown
The price of XRP on Binance is analyzed at one-hour intervals from Mar 4 to Mar 22.
The price reached a high of $0.328 on Mar 5. A rapid upward move ensued. Several market cycles have been completed since. The $0.328 level was reached four times total. Tracing these highs gives us a horizontal resistance line.
On March 4, there was a rapid price spike that lasted through Mar 5. Though prices subsequently dropped, a gradual uptrend can be observed. Eight successively higher lows are used to trace the ascending support line.
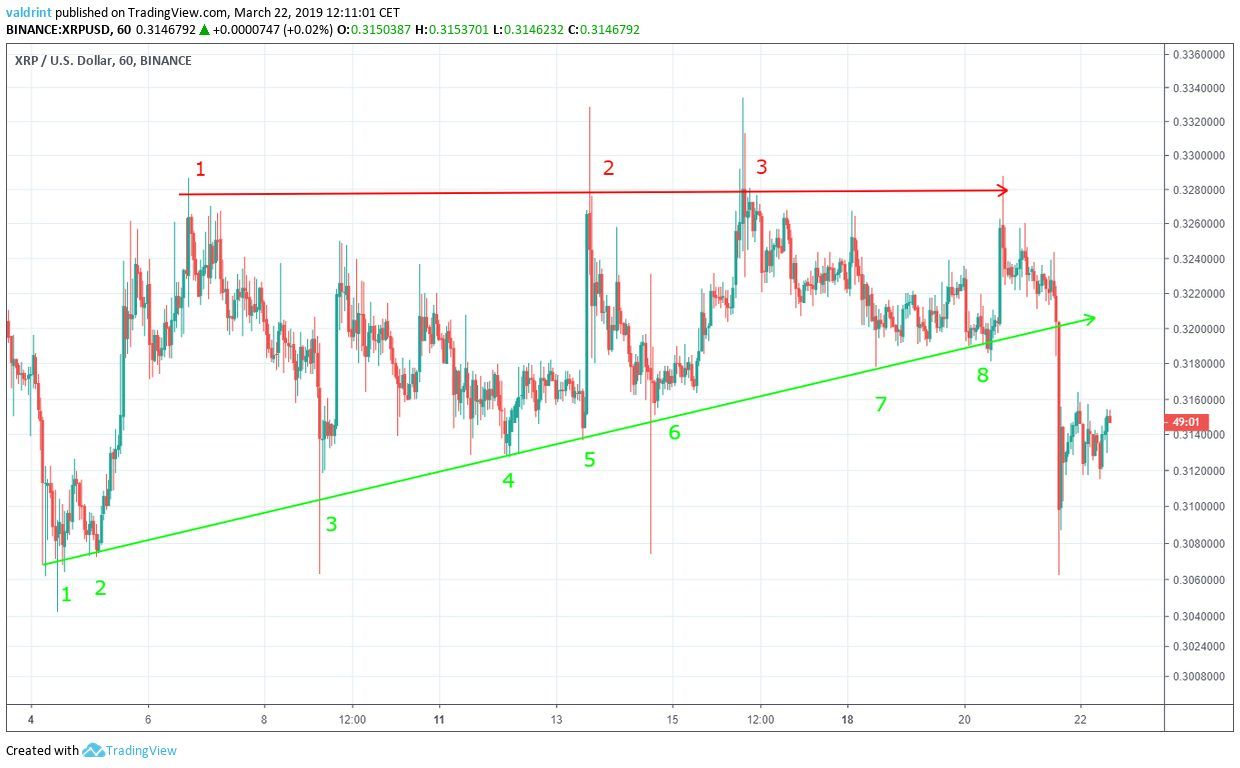
Together, The resistance and support lines create an ascending triangle—a more accurate indicator of future price fluctuations than either line alone.
We would expect price to continue trading within this pattern until an eventual breakout above support. This would be justified by the upward trend toward resistance. However, a breakout below support occured on Mar 21.
This has led to subsequently rapid price losses for XRP. Unless price can return above support, this current trading pattern will no longer be an accurate indicator of future price values. As support pushes closer to resistance, a point of convergence. At a point of convergence, it will become impossible for XRP to return to the wedge.
These factors suggest new support and resistance are emerging. They are unlikely to follow the same pattern as the ascending wedge traced here.
Support Line
To determine new trading patterns, we must examine XRP on a short time-table. For this reason, the price of XRP on Binance is analyzed at 15-minute intervals from Mar 21 to Mar 22.
XRP reached a low of $0.306 on Mar 21. It immediately rebounded and closed at $0.312 on the same day. Since the, it has revisited the same level three more times. Tracing these lows gives us a horizontal support line.
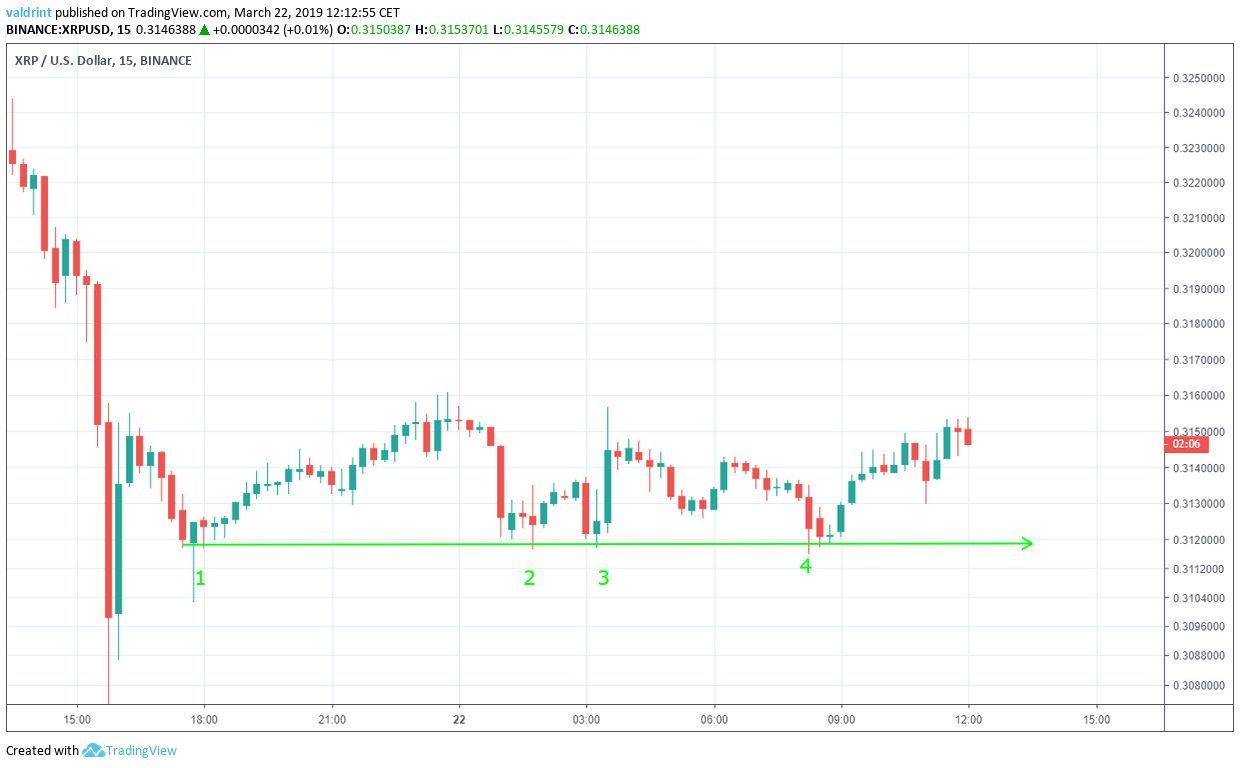
A breakdown below the support line such as the wick low of $0.31 on Mar 21 is considered insignificant since it was not succeeded by continuous price decreases.
It is unlikely that the price will move below this line unless a breakdown occurs. As prices increase above support, a decline toward support is possible. This could lead to a breakdown and subsequent price losses, but we believe that XRP will more likely touch the line—validating it for the fifth time—before another rise.
Horizontal Channel
On Mar 21, the price made a high of $0.316. A sharp drop ensued. However, the price has reached the same level three times since. Tracing these highs gives us a horizontal resistance line.
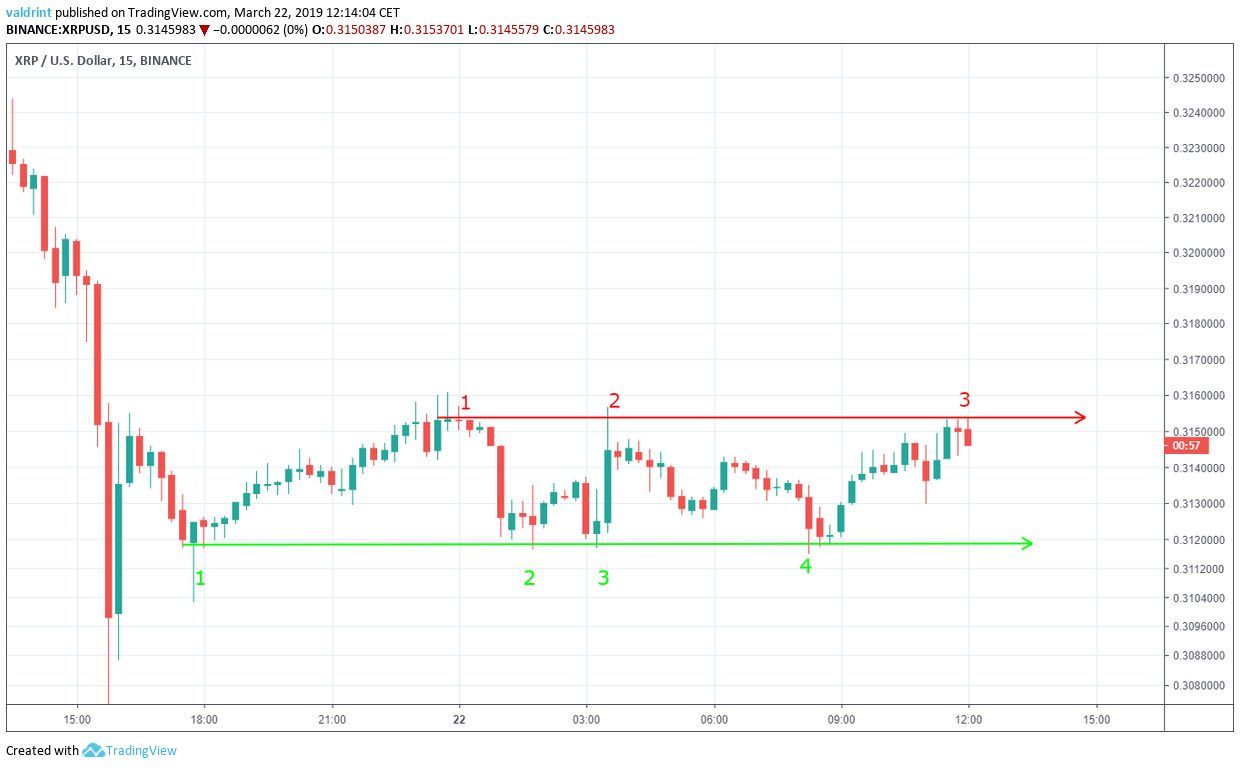
The resistance and support lines create a horizontal channel. This is a neutral pattern which makes price increases and decreases equally likely within the confines of the channel.
Because XRP is currently trading near the resistance, a drop within the confines back toward support may be expected. Price may drop toward the $.0312 mark in the near-term.
Future Movement
Combining MACD and RSI bullish/bearish divergence with support/resistance essentially predicts price fluctuations.
The moving average convergence divergence (MACD) is a trend indicator that shows the relationship between two moving averages (long and short-term) and the price. It is used to measure the strength of a move. The relative strength index (RSI) is an indicator which calculates the size of the changes in price in order to determine oversold or overbought conditions in the market.
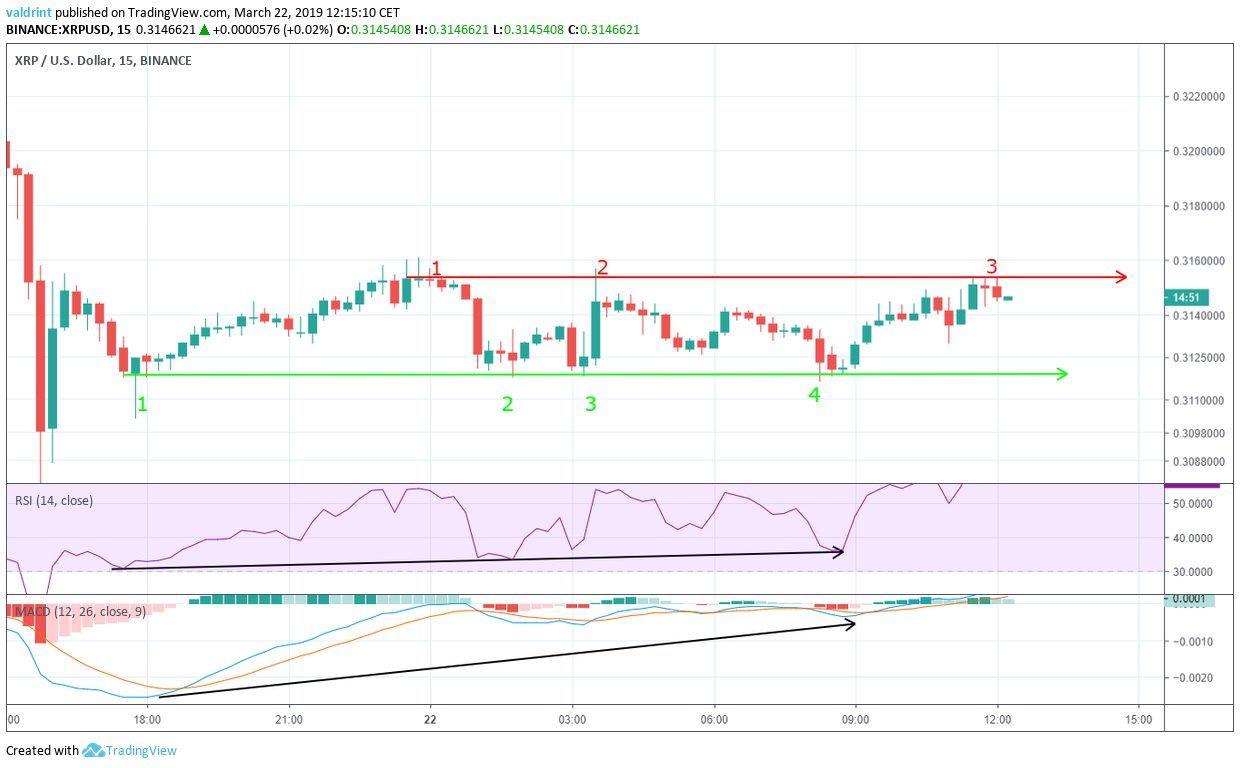
The price closed at $0.312 on Mar 21. Since, it has revisited the same level four times.
Similarly, the RSI and the MACD made a low on Mar 21. However, they have generated higher values since.
This is know as bullish divergence and often precedes price increases.
However, the level of divergence is not very significant and it has occurred in a neutral pattern—reducing its validity.
Using this indicator, it is likely that price trades inside the channel without experiencing significant volatility. Price drops toward resistance may still be expected. The miminimal significant level of bullish divergence does not force us to deviate from this assessment.
Resistance and Support
The price of XRP on Binance is analyzed at two-hour intervals from Feb 24 to Mar 22 to better visualize future possible resistance and support levels.
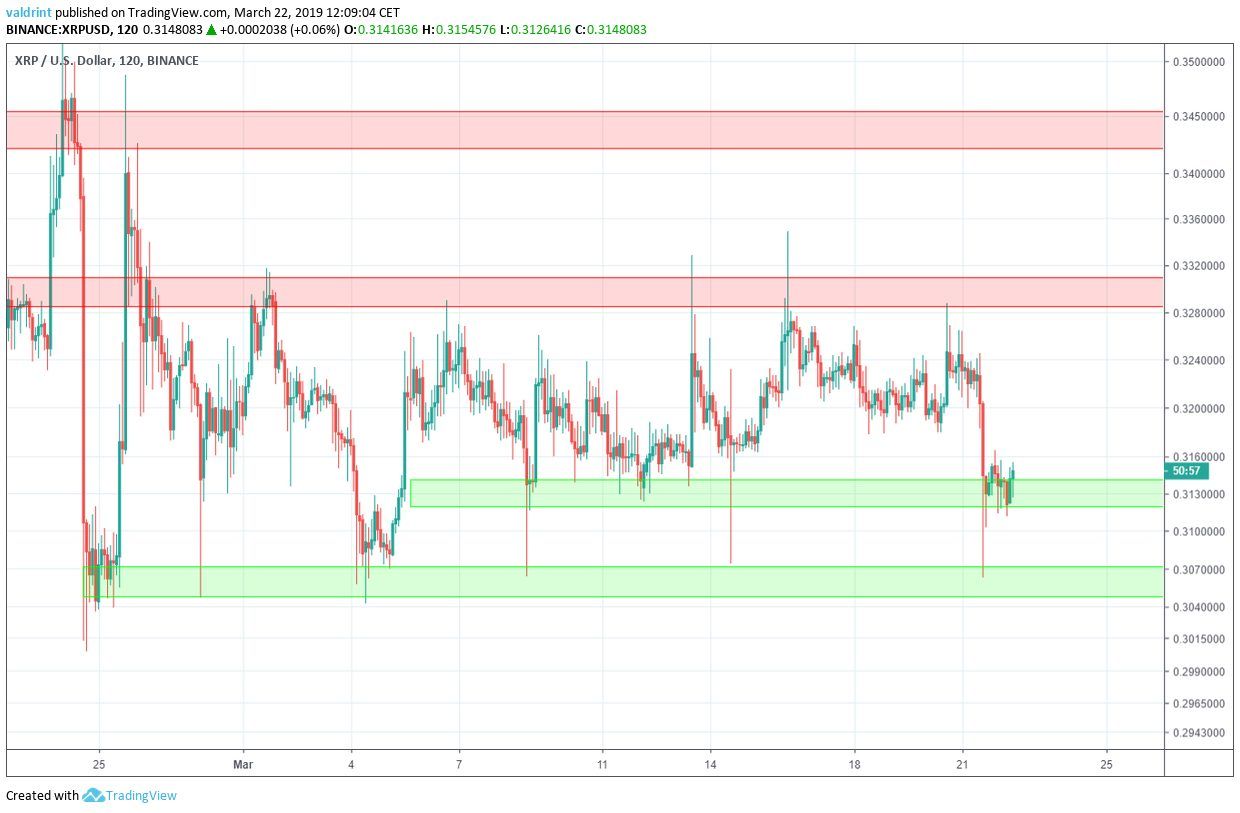
Resistance and support lines are created when the price revisits the same level several times.
There are two visible resistance areas, near $0.329 and $0.345 respectively. This means that in the case of a breakout, they would provide likely reversal areas. This was visible in the breakout of Mar 13 and Mar 15, since the price reached a highs $0.3328 and $0.3333 before ultimately breaking down.
The closest support area is found near $0.313, where the price is currently trading. The second one is found near $0.304. If a breakdown occurs, this is a likely reversal area. According to our analysis, price may reach this level in the near future if a drop toward resistance within the horizontal channel does in fact occur.
Summary of Analysis
Based on this analysis, the price of XRP is likely to trade inside the confines of the horizontal channel, dropping to resistance—and possibly break out.
If the price keeps trading inside the channel and drops in the near future before a subsequent rise, the prediction will be fully validated. A drop below support would invalidate the prediction. An immediate breakout would partially validate the prediction.
Do you think the price of XRP will reach similar prices as before the crash? Let us know in the comments below.
Click Here To Read More About xrp!
Disclaimer: This article is not trading advice and should not be construed as such. Always consult a trained financial professional before investing in cryptocurrencies, as the market is particularly volatile.


