


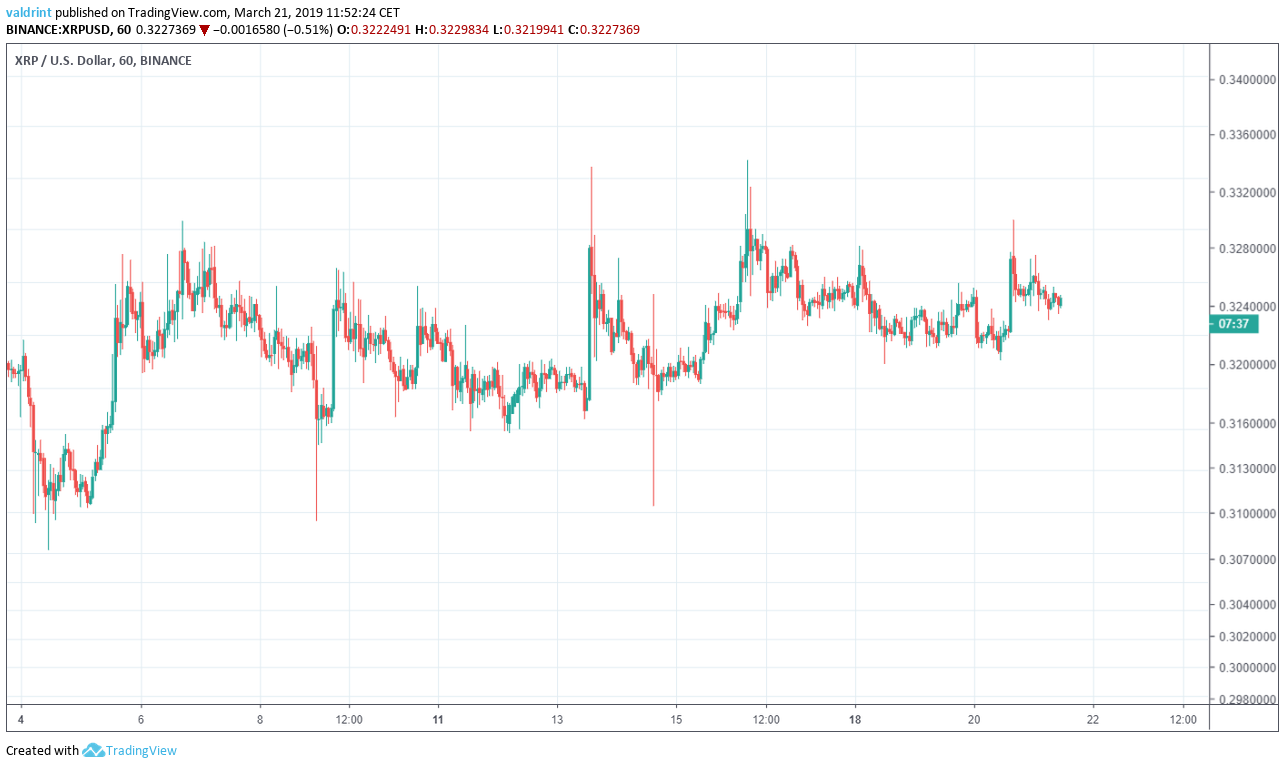
On March 4, 2019, the price of XRP (XRP) reached a low of around $0.30. A gradual uptrend ensued. While there have been some fluctuations, the rate of increase has remained constant.
Is XRP’s price going to keep rising? When will it make a decisive move?
Before we answer those questions, let’s first take a look at the prices between Mar 4 and Mar 21:
In our Mar 20 XRP analysis, we predicted that XRP—still known widely as Ripple— would initiate an upward move and eventually break out of the resistance. An upward move followed later that day.
Based on today’s analysis, we believe that XRP will soon touch the resistance line again and eventually break out.
Do you want to know how we came up with this prediction? Check out our daily analysis of XRP below:
XRP (XRP): Trends and Highlights for March 21, 2019
- The price of XRP has been on a gradual uptrend since Mar 4.
- It is trading inside a medium-term ascending triangle.
- It is trading inside a short-term descending wedge.
- There is bullish divergence developing in the RSI and the MACD.
- There are resistance areas near $0.345 and $0.33.
- There is support near $0.304.
Ascending Support
The price of XRP on Binance is analyzed at one-hour intervals from Mar 4 to Mar 21.
The price reached a low of $0.304 on Mar 4. Since then, the price has been gradually increasing. Moreover, several market cycles have been completed with every low being higher than the preceding one. Tracing these lows gives us an ascending support line.
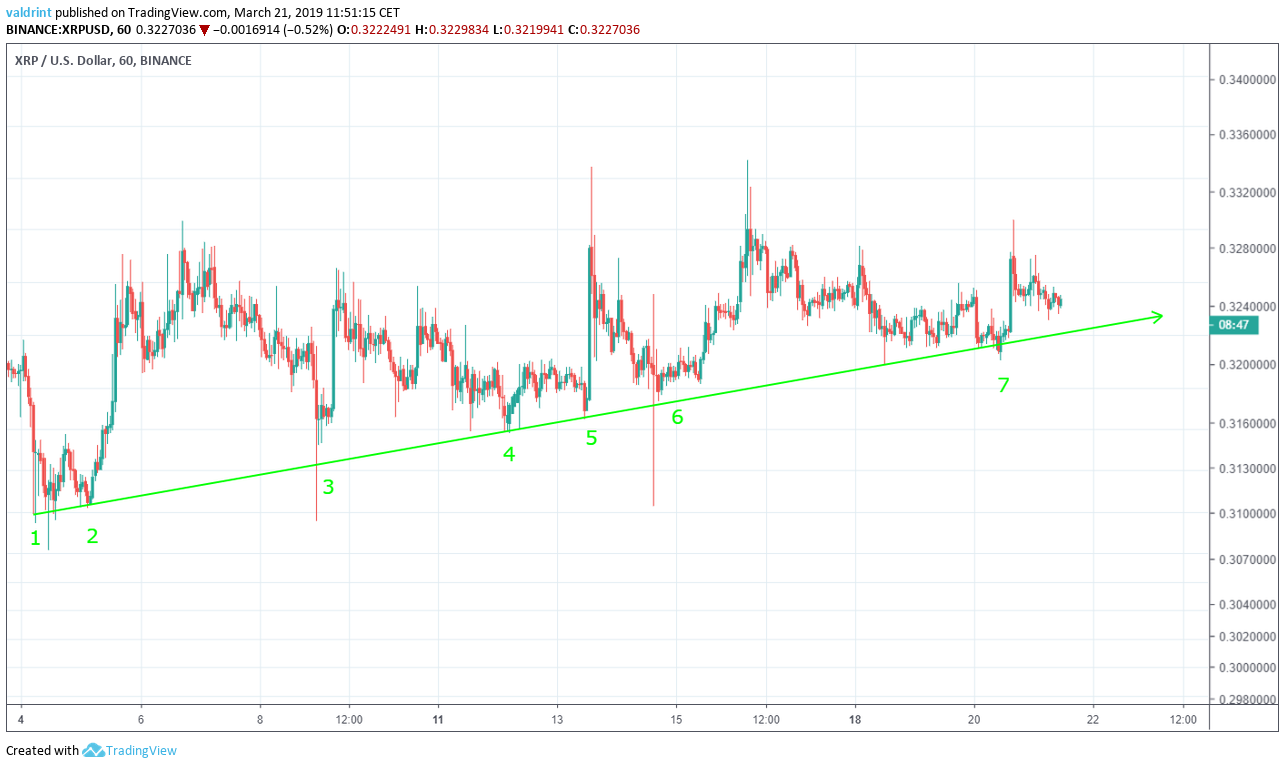
The support line acts as a floor to price, preventing further downward movement. It theoretically traces the lower limits of the price over time. Furthermore, It serves to measure the price’s rate of growth.
The price of XRP has been increasing at the same rate as predicted by the support line since Mar 4.
A breakdown below the support line such as the wick lows of $0.306 and $0.307 on Mar 8 and Mar 14 respectively are considered insignificant since they were not succeeded by continuous price decreases.
It is likely that the price will continue to increase following this line. However, the support line alone is not sufficient in estimating if a breakout or breakdown will occur.
Ascending Triangle
The price reached a high of $0.328 on Mar 5. A rapid upward move ensued. Several market cycles have been completed since. The $0.328 level was reached four times total. Tracing these highs gives us a horizontal resistance line.
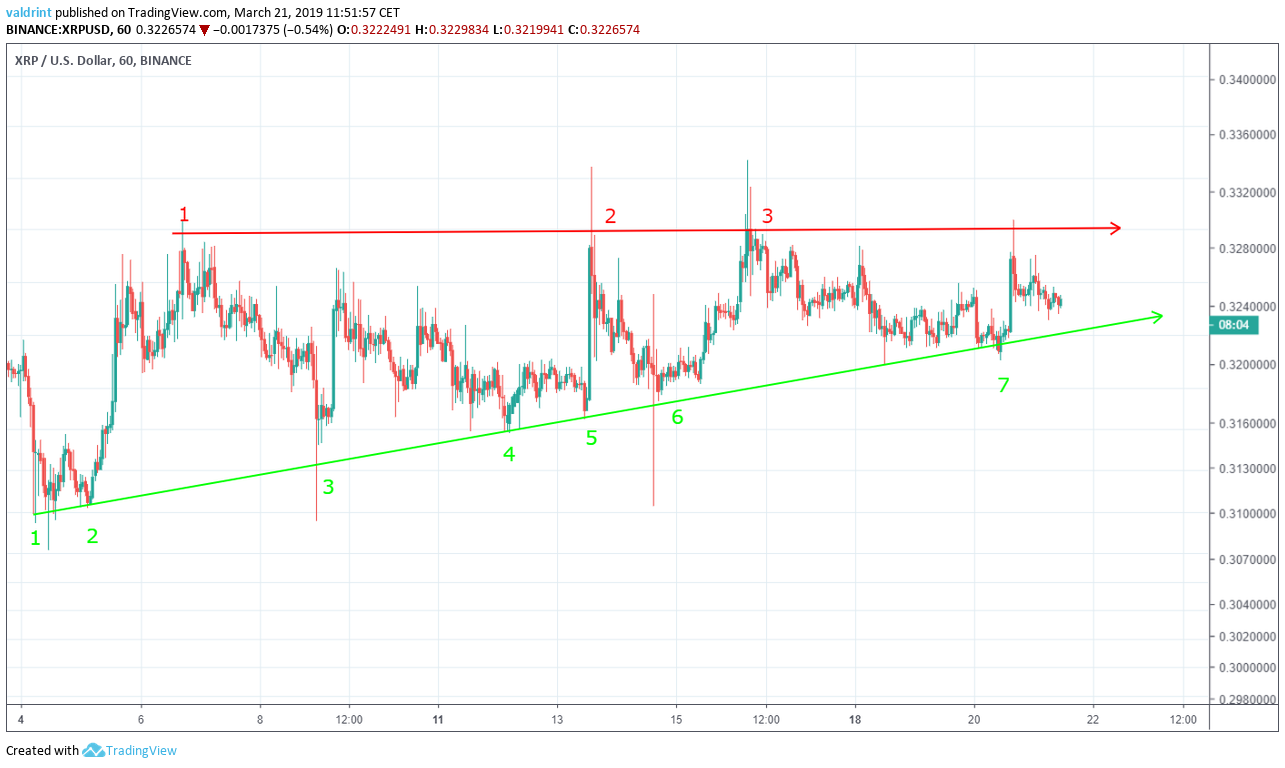
Similar to the support line, the resistance line effectively acts as a ceiling to price, theoretically preventing further upward movement. Highs above the resistance line such as the wick high of $0.3328 on Mar 13 and $0.3333 on Mar 15 can be considered insignificant since they were not succeeded by sustained movement above the line.
The resistance and support lines create an ascending triangle. This is a bullish pattern that suggests future price increases. The use of the triangle pattern better predicts price fluctuations than support or resistance lines alone.
On Mar 20, the price made the fourth unsuccessful attempt at breaking out above the resistance.
If this pattern proves to be a reliable predictor of price, the overall upward trend should continue as the price fluctuates between the resistance and support. Eventually, a breakout from this bullish pattern is likely to occur. This might not occur until a point of convergence between the resistance and support lines, which is quickly approaching and could occur in several days.
Future Movement
The price and rSI of XRP on Binance is analyzed at fifteen-minute intervals from Mar 20 to Mar 21.
Combining RSI bullish/bearish divergence with support/resistance essentially predicts price fluctuations.
The relative strength index (RSI) is an indicator which calculates the size of the changes in price in order to determine oversold or overbought conditions in the market.
The price made a high of $0.3287 on Mar 20. A sharp drop ensued. It has made lower highs since. Tracing these highs gives us a descending resistance line.
Price made a low of $0.322 on Mar 20. It has been steadily decreasing and making lower lows since.
Tracing these lows gives us a descending support line.
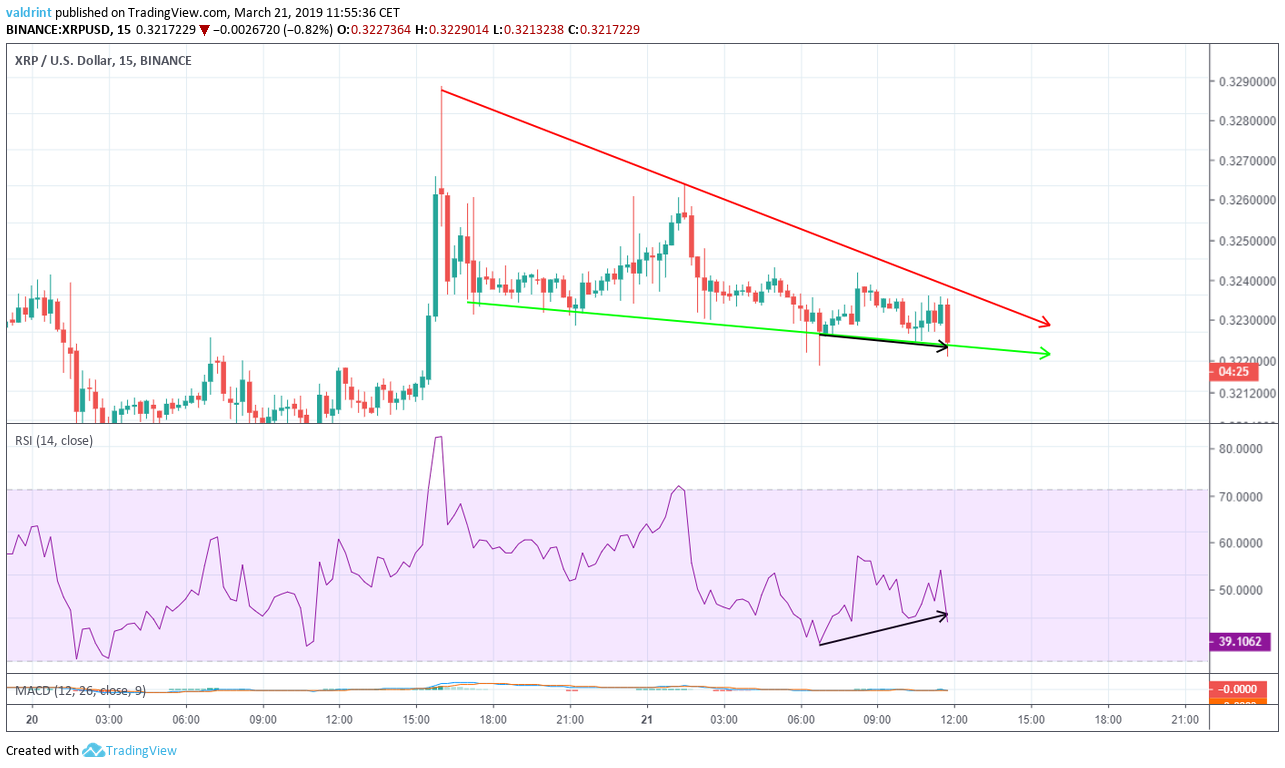
The support and resistance lines combine to create a descending wedge, which is a bullish pattern, making price increases more likely.
The price reached a low of $0.321 on Mar 21. It made the same low several hours later.
Similarly, the RSI made the first low on Mar 21. However, instead of making another lower low, it continued to increase. This is known as bullish divergence and often precedes price increases.
It is especially effective if it occurs in a bullish pattern. This is the case with XRP since the bullish divergence has occurred close to the support line of the bullish descending wedge.
Using this indicator, it is likely that the price will initiate another short-term upward move and break out from the wedge.
Resistance and Support
The price of XRP on Binance is analyzed at two-hour intervals from Feb 22 to Mar 21 to better visualize future possible resistance and support levels.
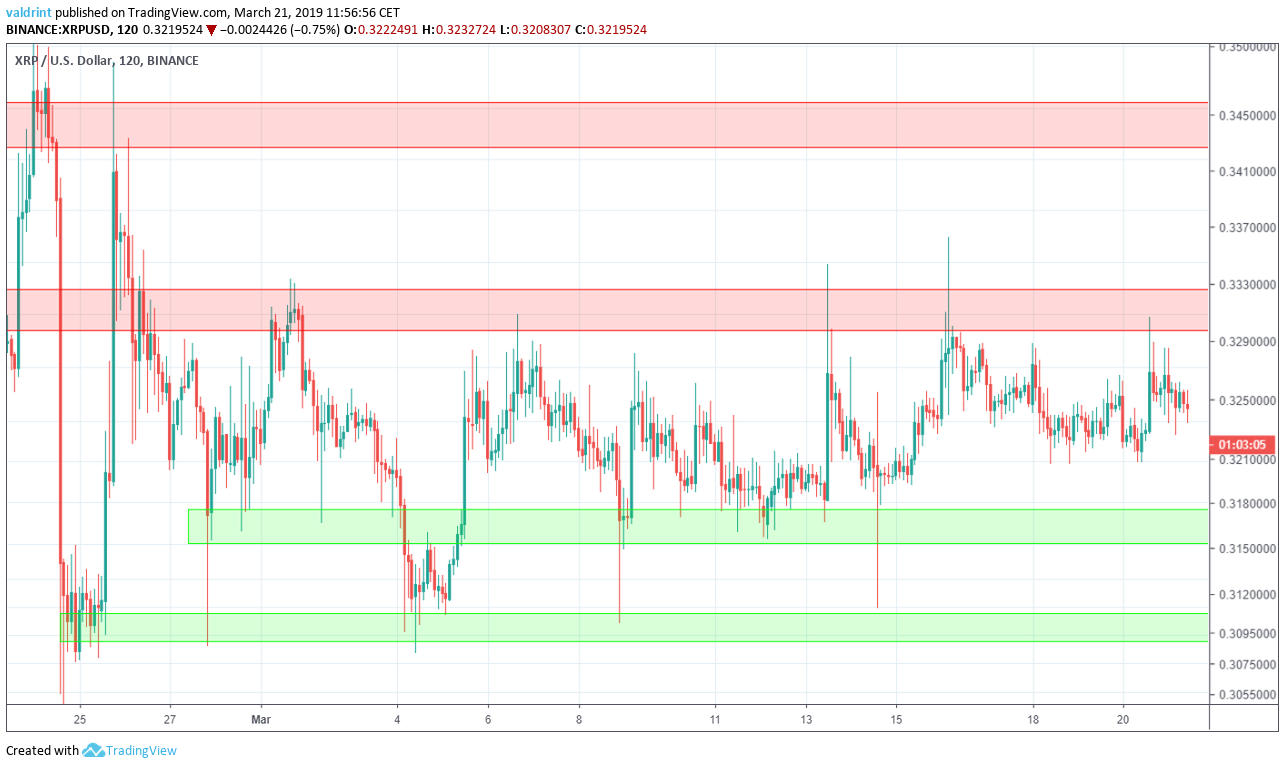
There are two visible resistance areas, near $0.329 and $0.345 respectively. This means that in the case of a breakout, they would provide likely reversal areas. This was visible in the breakout of Mar 13 and Mar 15, since the price reached a high of $0.3328 and $0.3333 before ultimately breaking down.
The closest support area is found near $0.304. If a breakdown occurs, this is a likely reversal area. According to our analysis, it is not likely that the price reaches this area soon.
Summary of Analysis
Based on this analysis, the price of XRP is likely to initiate a short-term upward move and break out from the descending wedge.
If the price breaks out from the wedge, the prediction will be partially validated. If it touches the resistance line of the triangle, it will be fully validated. A breakdown below the support line would invalidate the prediction.
Do you think the price of XRP will eventually break out from the triangle? Let us know in the comments below.
Click Here for our 2019 and 2020 Price predictions of xrp!
Disclaimer: This article is not trading advice and should not be construed as such. Always consult a trained financial professional before investing in cryptocurrencies, as the market is particularly volatile.


