


Ripple’s (XRP) price will likely make its way out of the potential bearishness it is doomed to witness.
This will likely occur with the help of Bitcoin, which is expected to rise ahead of the halving event this month.
Ripple Has the Potential to Rally.
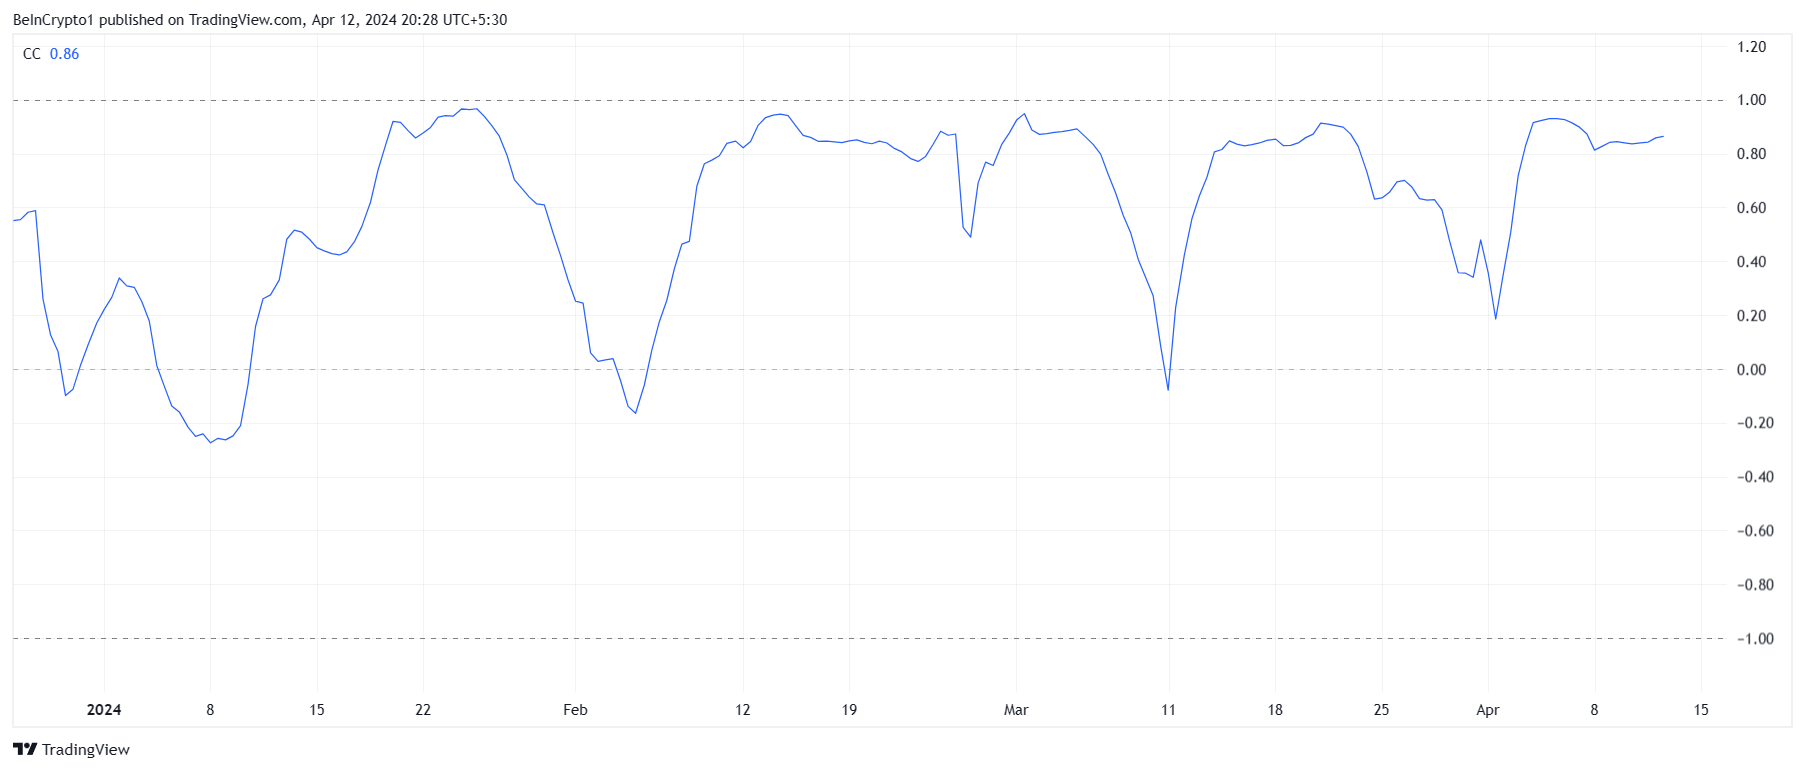
XRP price will follow the cues of the biggest cryptocurrency on the planet, Bitcoin. This is because the latter is due for a major rally due to the halving event set to occur towards the end of this month.
As Bitcoin price increases, the highly correlated assets will also probably take on the bullishness and witness an increase. XRP is among those altcoins, as it could potentially rally as well.
The chances of this happening within the Ripple network are also high, given there is room for further profits. The overall supply-bearing gains at the moment are at 83%, far lower than the threshold of the conditions forming a market top.
Read More: Everything You Need To Know About Ripple vs SEC
Only when an asset’s 95% of the circulating supply is in profit is a market top formed; otherwise, the potential for a rally is high.
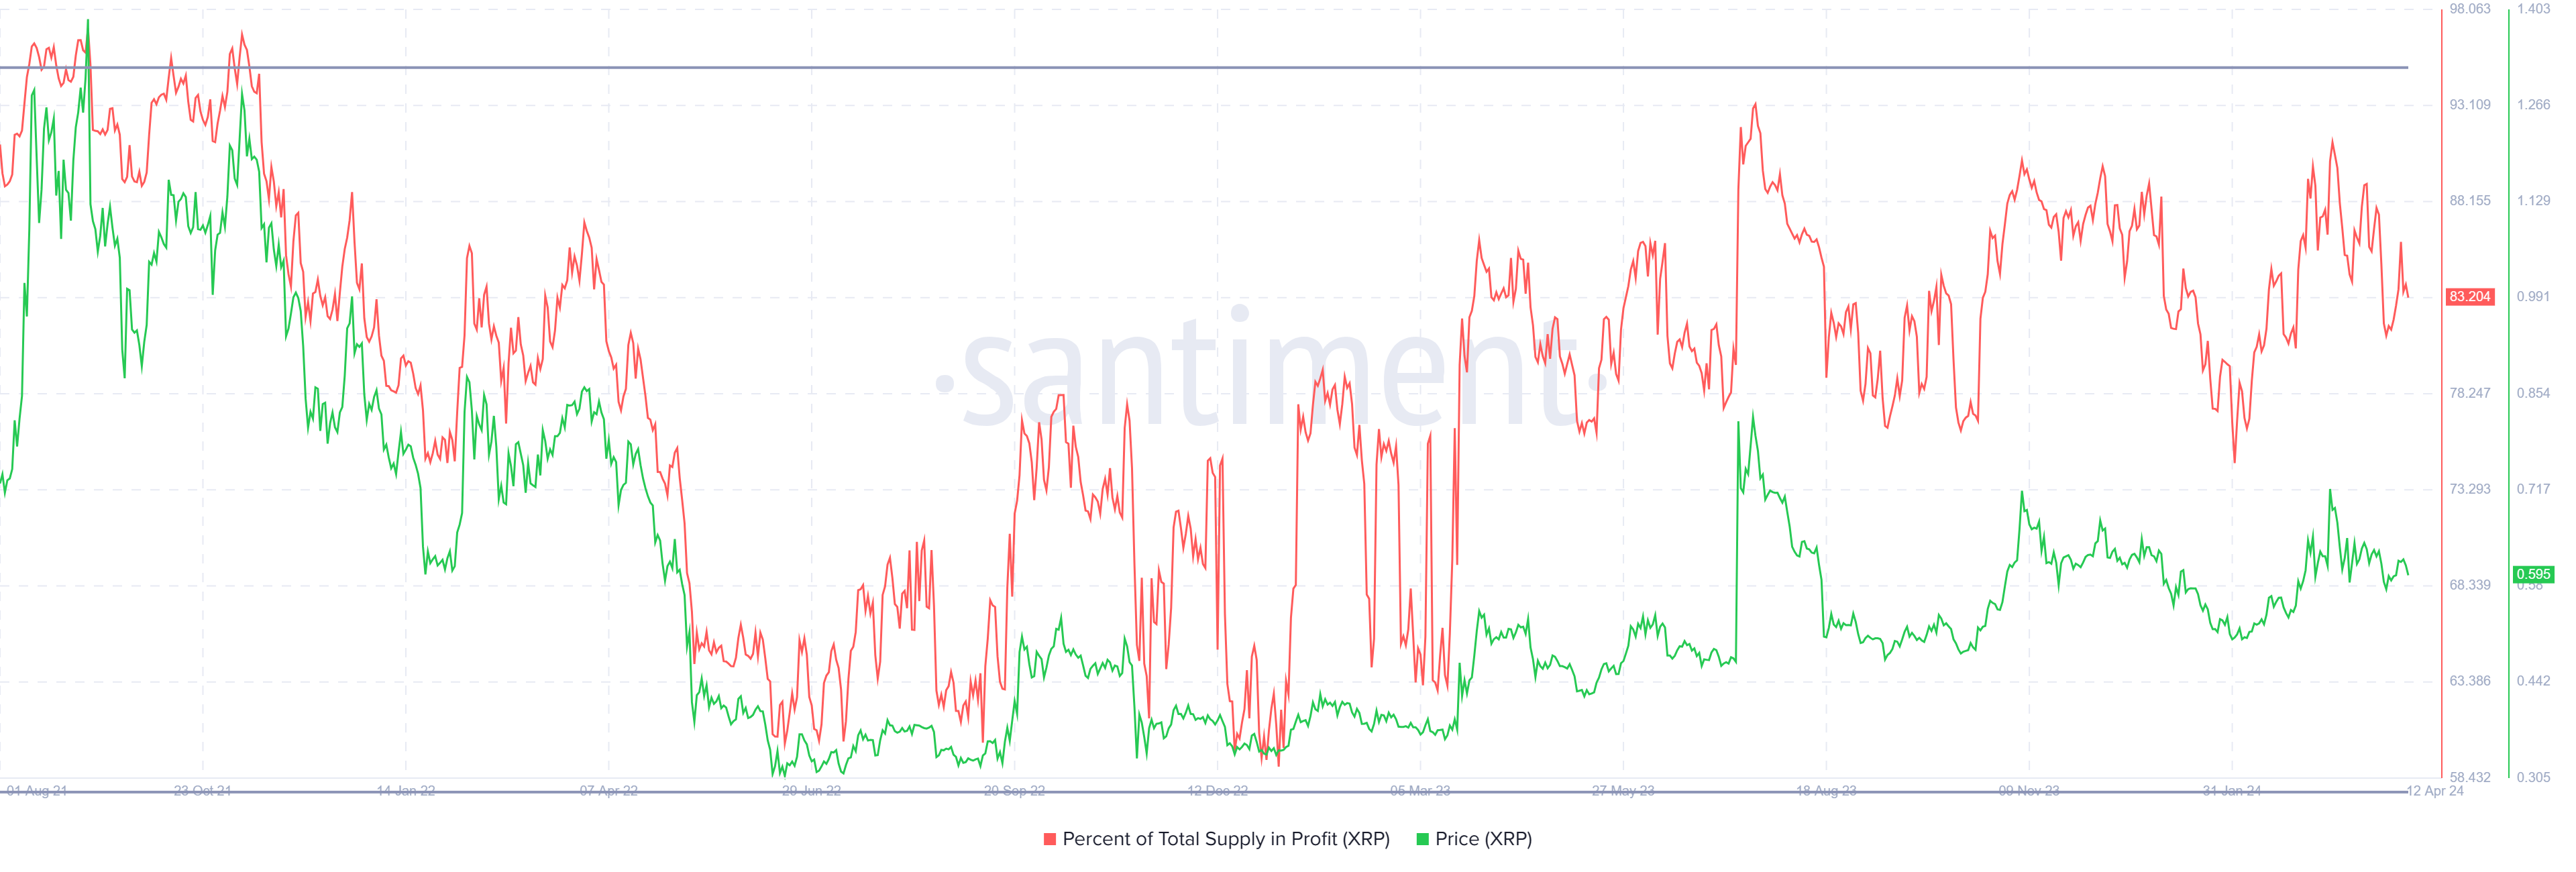
Thus, the XRP price could benefit from these conditions to chart gains in the coming days.
XRP Price Prediction: A Bullish Breakout
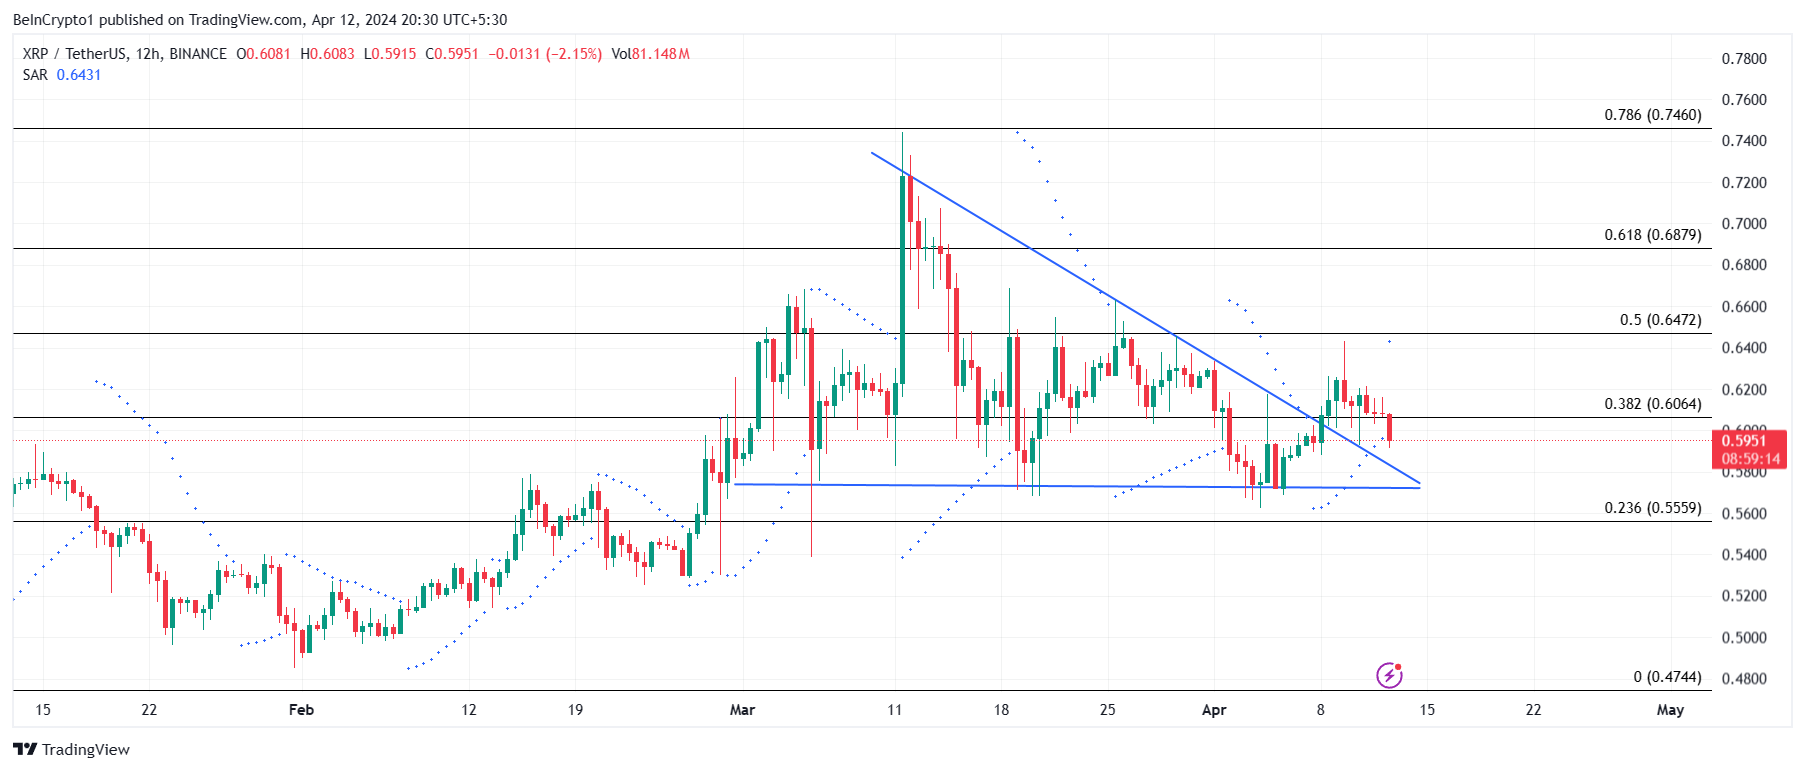
XRP price trading at $0.5951 is currently attempting to stay above the upper trend line of the descending triangle pattern the altcoin was stuck in. Since last month, the descending triangle pattern is a bearish chart formation. Characterized by a flat support level and declining resistance, it indicates a potential continuation of a downtrend when the price breaks below the support level.
However, XRP price managed to break out of it, nearly securing $0.6064 as a support floor. This coincides with the 50% Fibonacci Retracement of $0.8199 to $0.4744. Should the Ripple token manage to reclaim 38.2% Fib, it could rally towards $0.6500.
Read More: Ripple (XRP) Price Prediction 2024/2025/2030
But if the altcoin falls back into the bearish pattern, it will fall through the lower trend line. This would send it to the 23.6% Fib level marked at $0.5559, invalidating the bearish thesis.


