


Ripple’s XRP price encountered a breakout from a resistance line that had persisted for 700 days, leading to a peak of $0.94 for the year. Nevertheless, the price has fallen since, underlining the importance of the resistance zone at $0.90.
The overall trend over the long haul remains bullish due to the successful breakout. The short-term trend is approaching a key level, which will determine whether the trend is bullish or bearish.
Ripple Price Loses Momentum After Rejection
The weekly time frame analysis of XRP indicates a positive outlook. This optimism primarily stems from the breakout of a descending resistance line that persisted for 700 days. Such breakouts from long-standing patterns frequently result in significant movements in the opposite direction.
Reports regarding Ripple are upbeat as well. Wells Fargo analyst Shannon Thorpe predicted that the XRP price could reach $100-$500 within the next 7 months.
Moreover, Ripple addressed several misconceptions about the positive ruling in its case against the SEC during its Q2 report. XRP has since been re-listed to several key centralized crypto exchanges, with Kraken most recently adding XRP trading back to its platform.
Secure your future with accurate XRP crypto forecasts. Click here.
Gemini Exchange has also hinted at the possibility of potentially listing XRP in a cryptic tweet.
After the breakout, XRP effectively crossed the $0.54 resistance level, forming a bullish candlestick pattern. It subsequently progressed to reach the next resistance at $0.90 but encountered rejection within the same week (red icon). The XRP price has fallen since.
Currently, XRP’s trading position is closer to the $0.54 support than the $0.90 resistance. A drop in the former would amount to a decrease of 12%, while a rise in the latter would be a 45% increase.
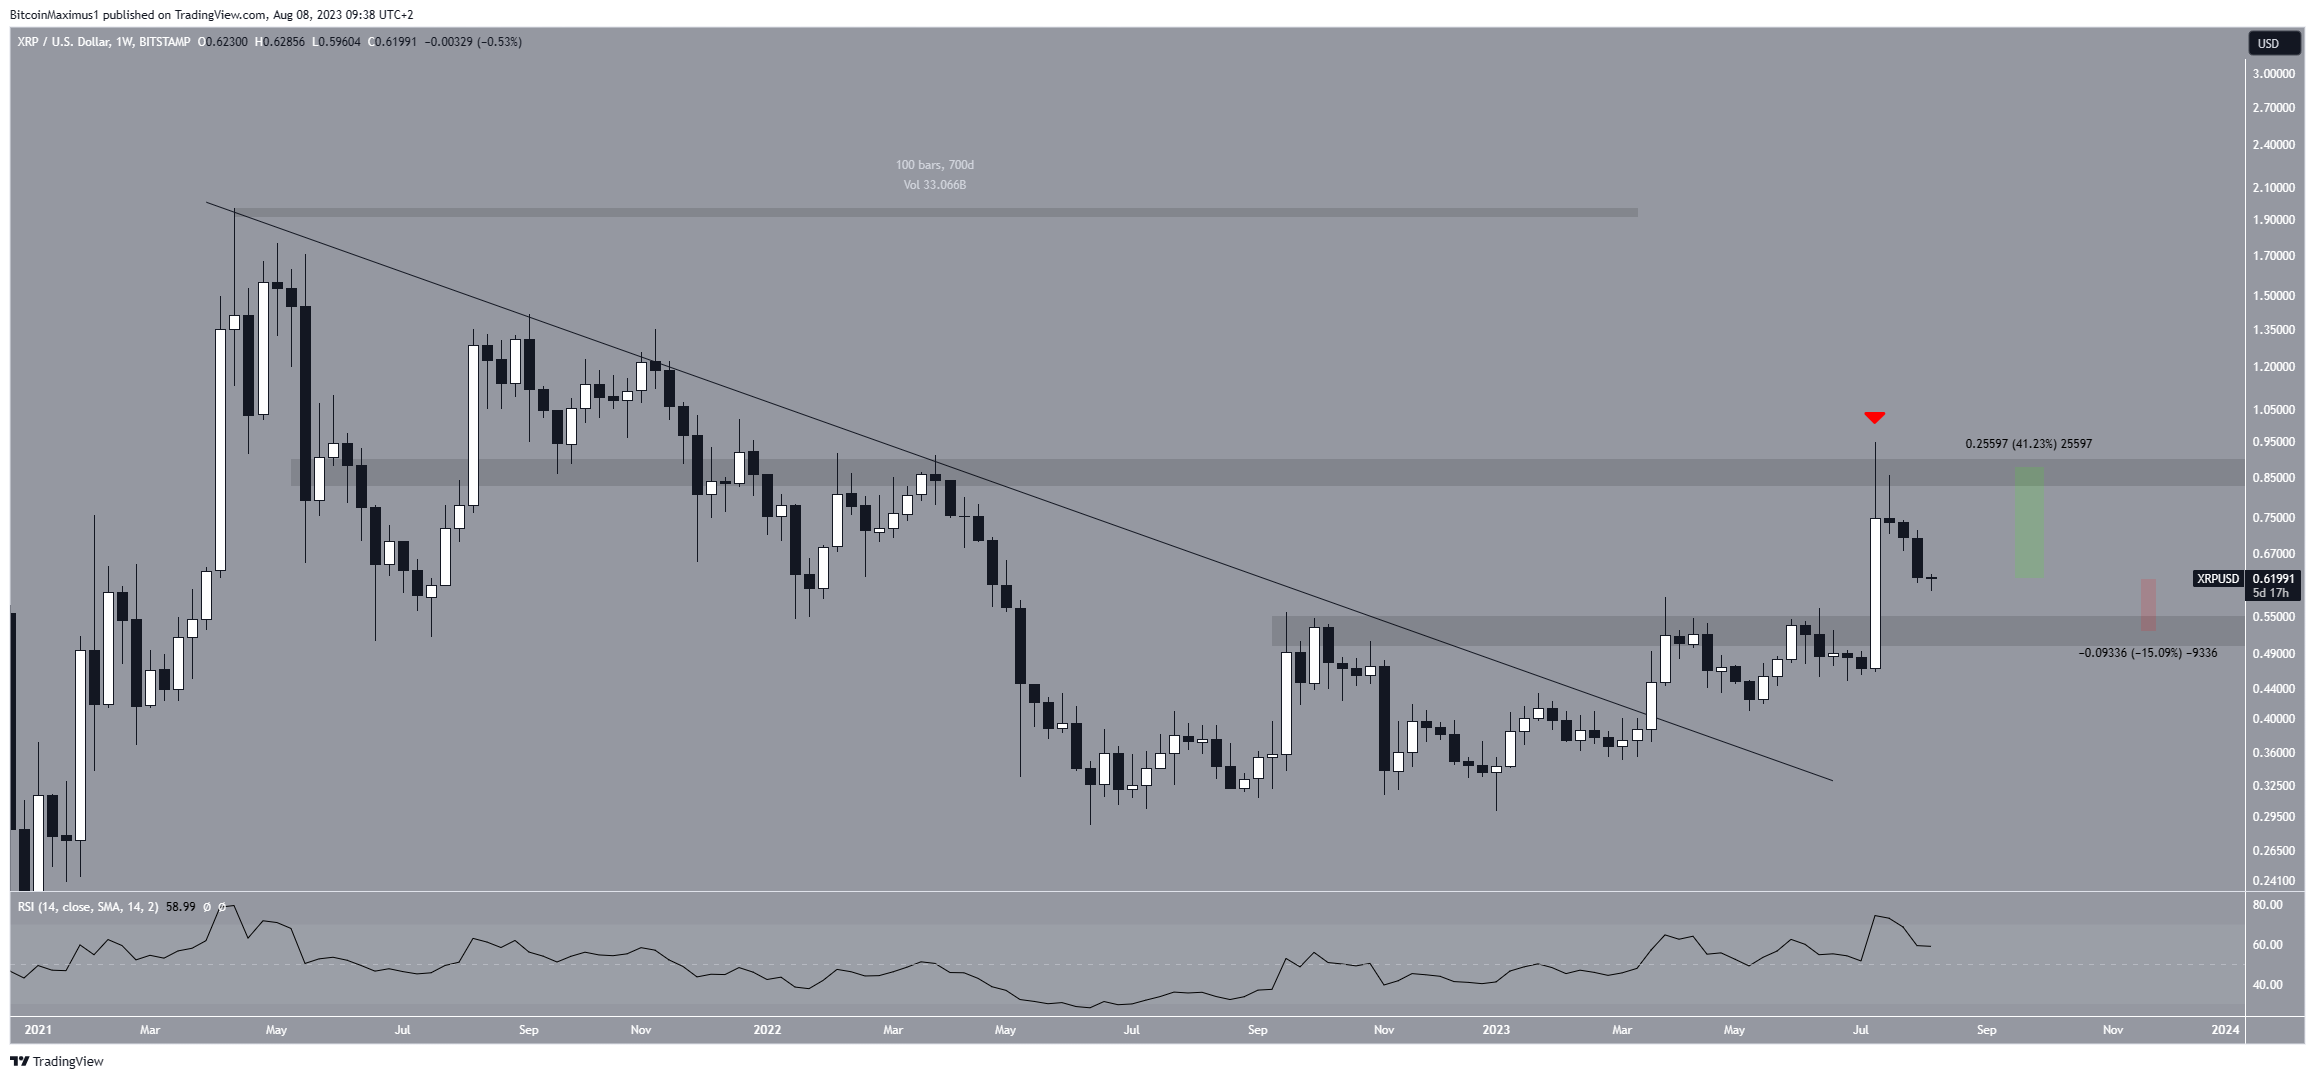
The weekly Relative Strength Index (RSI) gives a neutral reading. Traders employ the RSI as a momentum gauge to assess if a market is excessively bought or sold, aiding their decisions on asset accumulation or sale.
While the indicator is above 50, it has decreased since the beginning of July. This is a sign of an undetermined trend.
Read More: 6 Best Copy Trading Platforms in 2023
XRP Price Prediction: Will Bullish Structure Be Invalidated?
The short-term six-hour time frame’s technical analysis gives a bullish outlook for XRP. However, the bullish structure is very close to being invalidated.
The main reason for this analysis comes from the wave count. Technical analysts utilize the Elliott Wave theory to ascertain the trend’s direction by studying recurring long-term price patterns and investor psychology.
The most likely count indicates that the XRP price is nearing the bottom of wave four in a five-wave upward movement. Therefore, if the count is correct, the XRP price will soon reach a bottom and begin another upward movement.
The movement’s most likely target is $1.10, created by the 1.61 external Fib retracement (white). It is 78% away from the current price.
However, the reason why the count is becoming less probable is the fact that the price fell below the 0.618 Fib retracement support level at $0.63.
If the decrease were corrective, the area would have been expected to act as the bottom. Moreover, the XRP price fell below the previous ascending channel’s resistance line.
Reclaiming the 0.618 Fib level will go a long way in suggesting that this is the correct count.
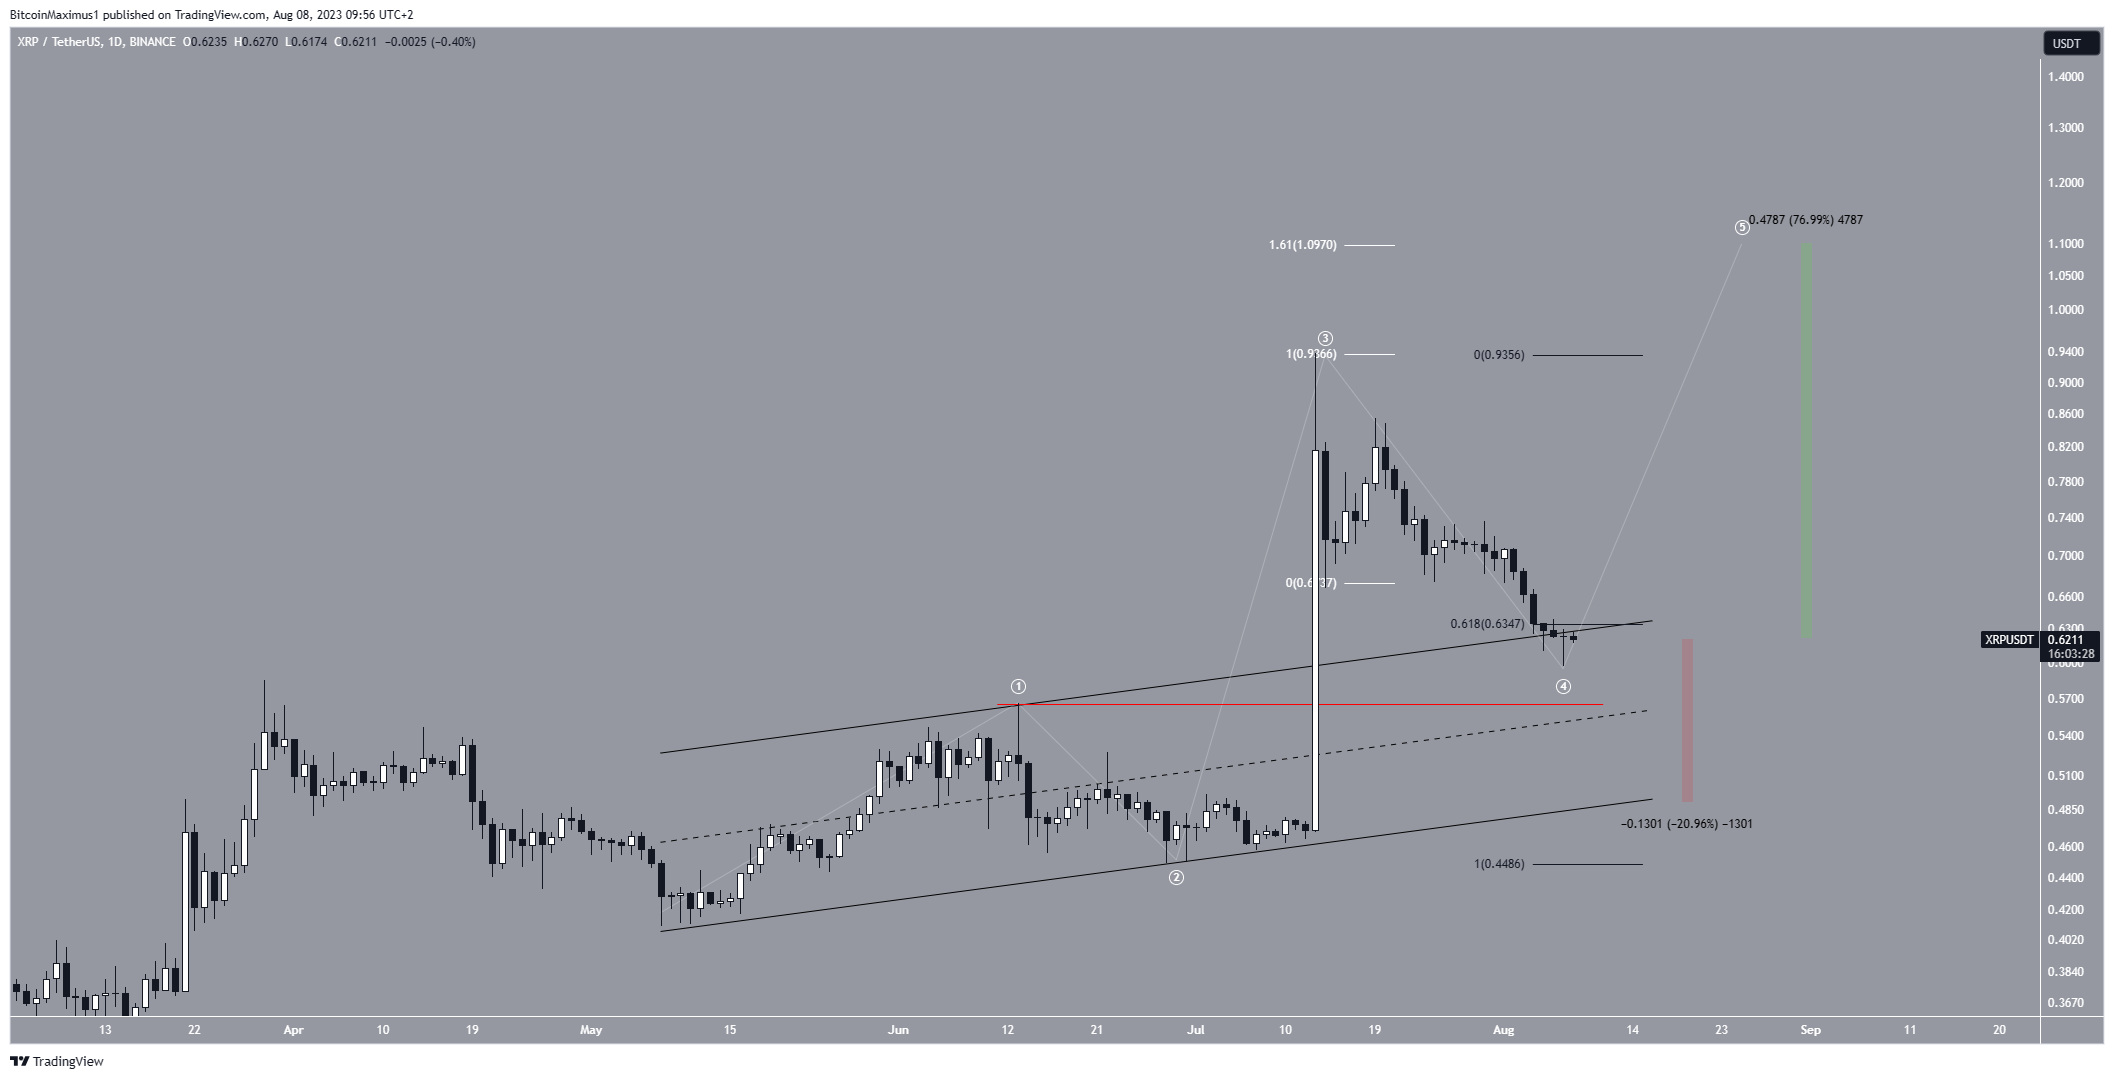
Although there is an optimistic prediction for the price of XRP, falling below the peak of wave one at $0.56 (red line) would suggest a shift toward a bearish trend.
In such a situation, the XRP price would probably decrease to the channel’s support line, positioned at $0.50. This would translate to a decrease of 20%.
Read More: Best Upcoming Airdrops in 2023
For BeInCrypto’s latest crypto market analysis, click here.


