

Ripple’s XRP price has fallen since its yearly high in July. The price broke down from a long-term ascending support line in August.
The price action, RSI readings, and Elliott Wave count all support the continuing decrease, at least in the short term. Despite this bearish outlook, the community surrounding XRP is almost unanimously bullish, expecting significantly higher prices by year’s end.
XRP Price Falls Below Long-Term Support
A look at the weekly time frame technical analysis for XRP gives a pessimistic outlook. Both the readings of the Relative Strength Index (RSI) and the price action contribute to this bearish projection.
After its peak at $0.95 in July, XRP’s price has been downward. Notably, this decline didn’t halt at the $0.56 horizontal level, which had intermittently functioned as both support and resistance since April 2021.
In light of the price surpassing this level in July, it was anticipated to act as support again. However, contrary to expectations, XRP’s price decisively broke below it.
Subsequently, XRP also breached an ascending support line that had been established since the beginning of the year. This development aligned with previous bearish signals, further confirming the bearish trend.
Should the decline persist, the nearest nearest support zone is $0.42, representing a 12% decrease from the current price. Conversely, the $0.56 horizontal area stands 20% higher than the present price.
Some analysts believe that the bounce at the $0.42 area will initiate a significant upward movement that takes the price well above $1.
However, this has not been the case so far. Rather, the price has hovered inside its long-term range.

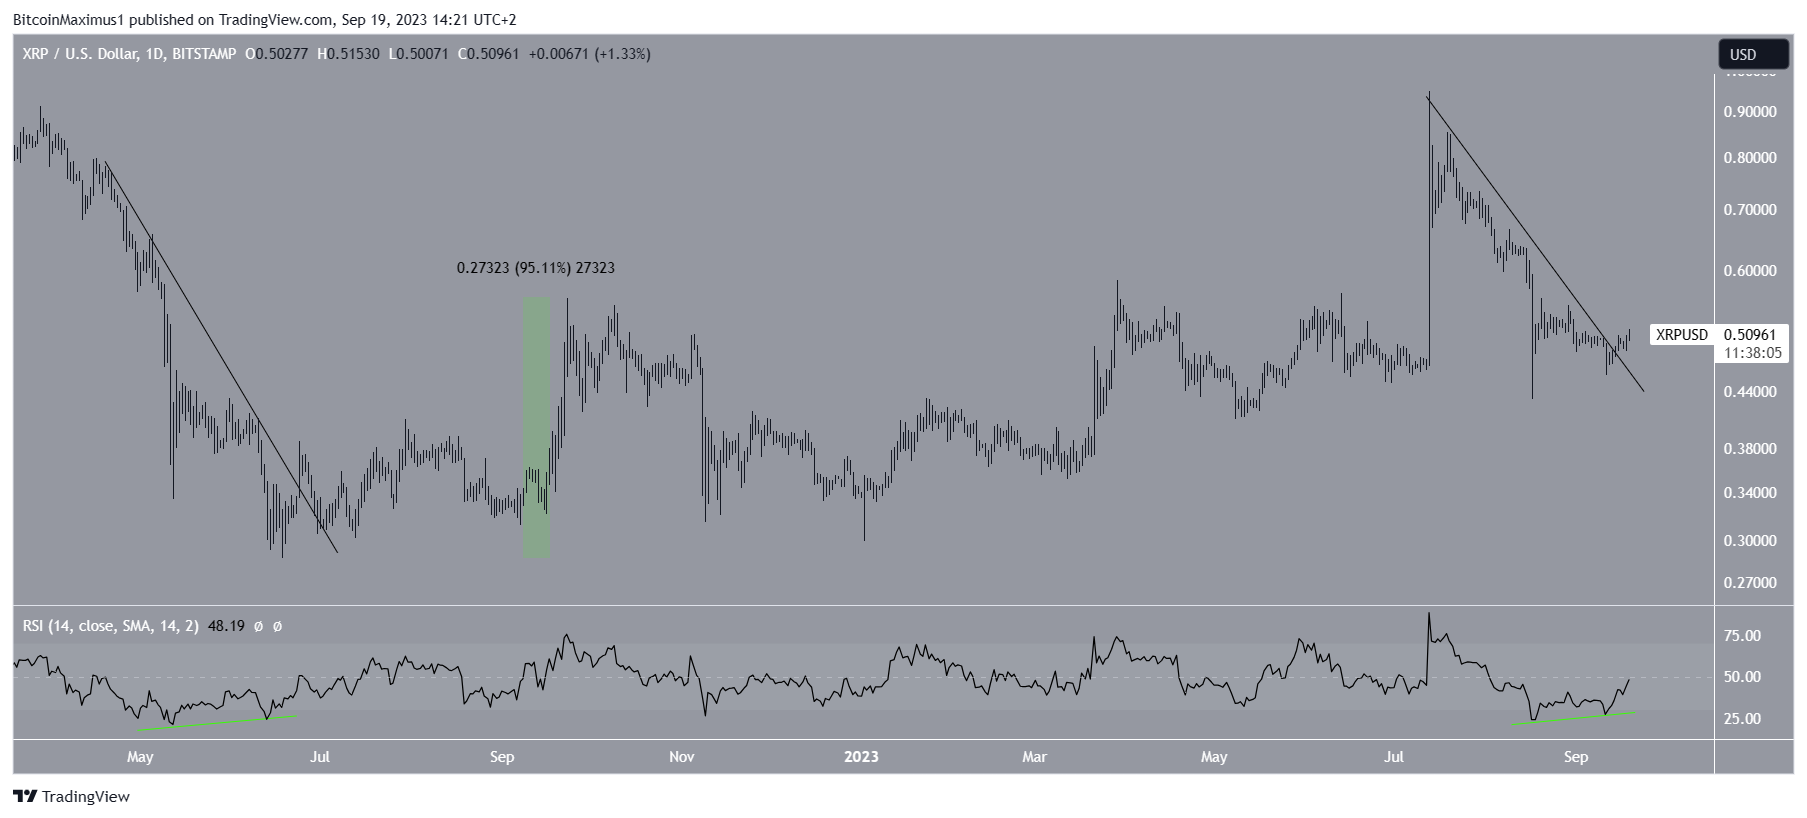
The Relative Strength Index (RSI) is a valuable tool for traders, aiding in the assessment of market momentum and identification of potential overbought or oversold conditions. When the RSI surpasses 50 and is upward, it indicates buyer dominance. Conversely, an RSI below 50 with a descending trend suggests seller control, marking a downtrend and potential selling opportunities.
Currently, the RSI is positioned below 50 and is decreasing, indicating characteristics of a bearish trend. Furthermore, the RSI has broken below an ascending support line (green), indicating a bearish trend.
In the ongoing Ripple vs. SEC case, the latter has appealed the court’s decision that favored Ripple in the ongoing dispute. It is also interesting to note that investment giant Blackrock has allegedly turned its focus on XRP instead of Bitcoin.
XRP Price Prediction: Correction or Diagonal?
While the immediate price outlook suggests an ongoing decrease in value, the trajectory of the long-term trend remains uncertain. This uncertainty stems from the existence of two valid wave counts currently in play.
Technical analysts use the Elliott Wave theory to identify recurring price patterns and investor sentiment. This enables them to assess the likely trend direction.
One scenario, the bearish count (black), suggests that Ripple’s price has completed a corrective A-B-C structure (black). If this scenario holds true, the price will continue its descent. This could cause a breakdown below its 2022 low of $0.29 (red line).
On the other hand, the bullish count proposes that XRP is currently in the fourth wave of a five-wave upward movement (white). This upward movement has formed a leading, expanding diagonal, which explains the overlap between waves four and one.
If the bullish count proves accurate, we anticipate the price to rebound when it reaches a long-term ascending support level at $0.40. This will then be followed by an ascent towards a long-term ascending resistance level at $1.25.
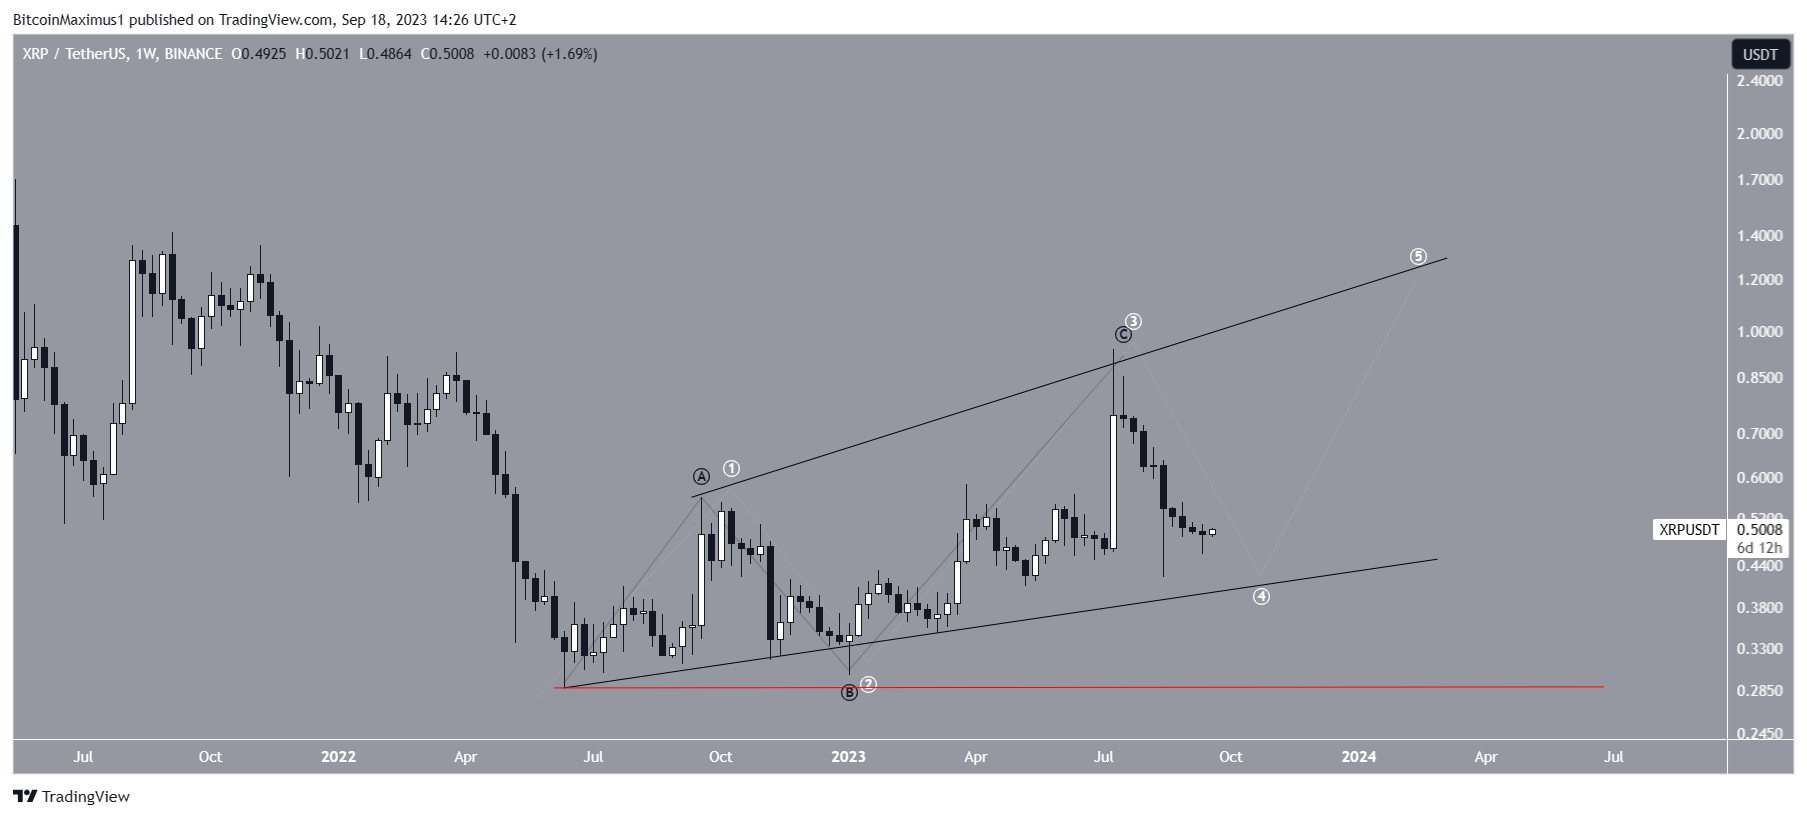
Consequently, the most probable XRP price prediction suggests continuing the decline toward the nearest support at $0.40. The crucial factor in determining the future trend’s course will be whether the price rebounds upon reaching this level.
Read More: Best Crypto Sign-Up Bonuses in 2023
What Are the Top Crypto Analysts Saying?
An analysis of the top posts in the X (formerly known as Twitter) platform shows that most well-known analysts are decisively bullish.
@DefendDark believes that the price will increase towards what he states is the main resistance at $1.24. To find this level, he uses a descending resistance line in the logarithmic chart.
Two other analysts both use breakouts and bullish divergences to predict that the price will soon increase above $1. This observation is very interesting since the previous bullish divergence (green lines) led to a 95% increase in September 2022. A similar increase would take the price very close to $1.
Other traders, such as Alex Cobb, give high targets above $10 by using a previous fractal. But, for this to occur, the price must break out of its long-term pattern. Moreover, this is a high for the new market cycle since the price has to break out above the current all-time high to reach it.
It is interesting to note the discrepancy between the bullish and bearish sentiments on X. Some large accounts, such as @realXRPwhale or @Bitforcoinz, offer nothing but bullish posts every time the price increases without providing any analysis.
Despite this, the account has over 100,000 followers, and the posts consistently generate significant engagement. This is also visible on TradingView, where 9 of the top 10 ideas are bullish.
There is also excitement around recent reports that suggest central banks are exploring the use of Central Bank Digital Currencies (CBDC) and could potentially partner with Ripple to do it.
As for this year, a poll done on the BeIn Crypto telegram trading community, which asked its members about the price at the end of the year, does not share the bullish euphoria seen on X. 67% of respondents believe that the price will trade between $0.50 and $1, 21% believe it will be trading above 1. In comparison, only $12% believe the price will be below $0.50.
Read More: How To Make Money in a Bear Market
For BeInCrypto’s latest crypto market analysis, click here.
Disclaimer
In line with the Trust Project guidelines, this price analysis article is for informational purposes only and should not be considered financial or investment advice. BeInCrypto is committed to accurate, unbiased reporting, but market conditions are subject to change without notice. Always conduct your own research and consult with a professional before making any financial decisions. Please note that our Terms and Conditions, Privacy Policy, and Disclaimers have been updated.
