


The Ocean Protocol (OCEAN) price has traded under a long-term descending resistance line for 896 days.
The price action and RSI readings from the daily timeframe suggest that a breakout from the line will transpire, leading to a significant increase.
OCEAN Protocol Attempts Breakout From Long-Term Resistance
The OCEAN protocol price has fallen under a long-term descending resistance line since reaching an all-time high price of $1.94 in April 2021. The line has been validated six times so far (red icons), most recently on July 17. So far, the line has been in place for 896 days.
After the rejection, OCEAN fell to the $0.25 horizontal support area, where it initiated a bounce, creating a long lower wick (green icon). The wick is considered a sign of buying pressure.
The $0.25 area is crucial since it has intermittently acted as both resistance and support since April 2022. Therefore, whether the price breaks down from the $0.25 area or breaks out from the descending resistance line will determine the future trend’s direction for the decentralized finance (DeFi) coin.
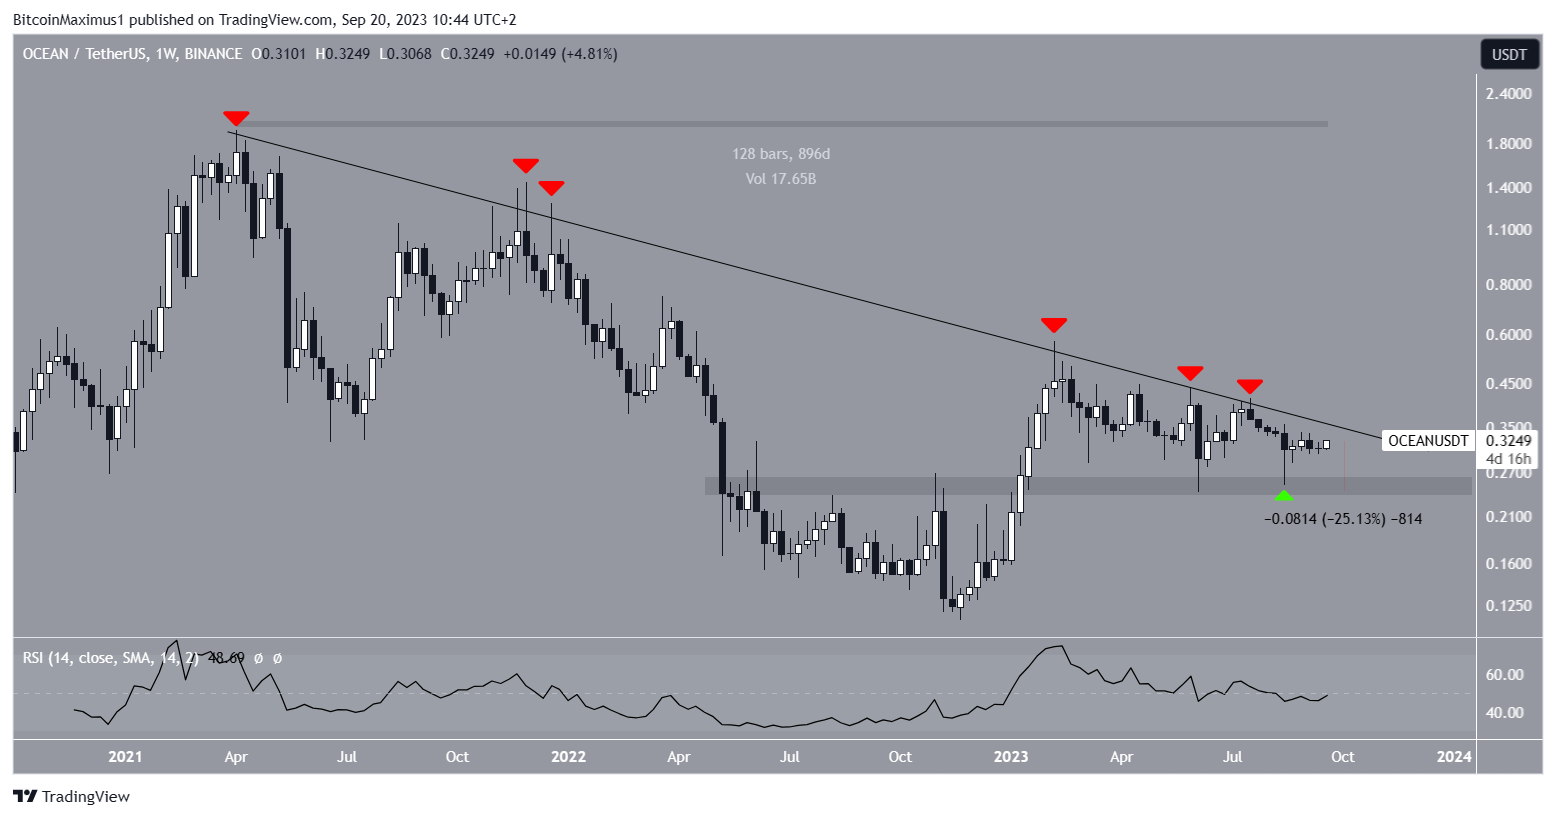
The weekly RSI provides an unclear reading. With the RSI as a momentum indicator, traders can determine whether a market is overbought or oversold and decide whether to accumulate or sell an asset.
Bulls have an advantage if the RSI reading is above 50 and the trend is upward, but if the reading is below 50, the opposite is true. While the indicator has begun to increase, it is trading right at the 50 line. This is a sign of a neutral trend.
OCEAN Price Prediction: Wave Count Suggests Trend is Bullish
While the weekly chart provides an undetermined trend, the daily timeframe readings are decisively bullish. This bullishness comes from the price action, RSI readings, and the wave count.
The price movement shows that the decrease since the yearly high on February 7 has been contained inside a descending parallel channel. These channels usually contain corrective movements, meaning that an eventual breakout from it is expected. The fact that the price trades in the channel’s upper portion makes a breakout even more likely.
Next, the wave count is bullish. Technical analysts employ the Elliott Wave theory as a means to identify recurring long-term price patterns and investor psychology, which helps them determine the direction of a trend. Since the beginning of the year, two distinct corrective patterns (black) have moved downwards.
Additionally, there are two five-wave increases (white) as well. This means that the trend is bullish, and decreases are just corrections in response to the previous increase.
Finally, the daily RSI is increasing and is above 50 (green icon), both signs of a bullish trend for the cryptocurrency.
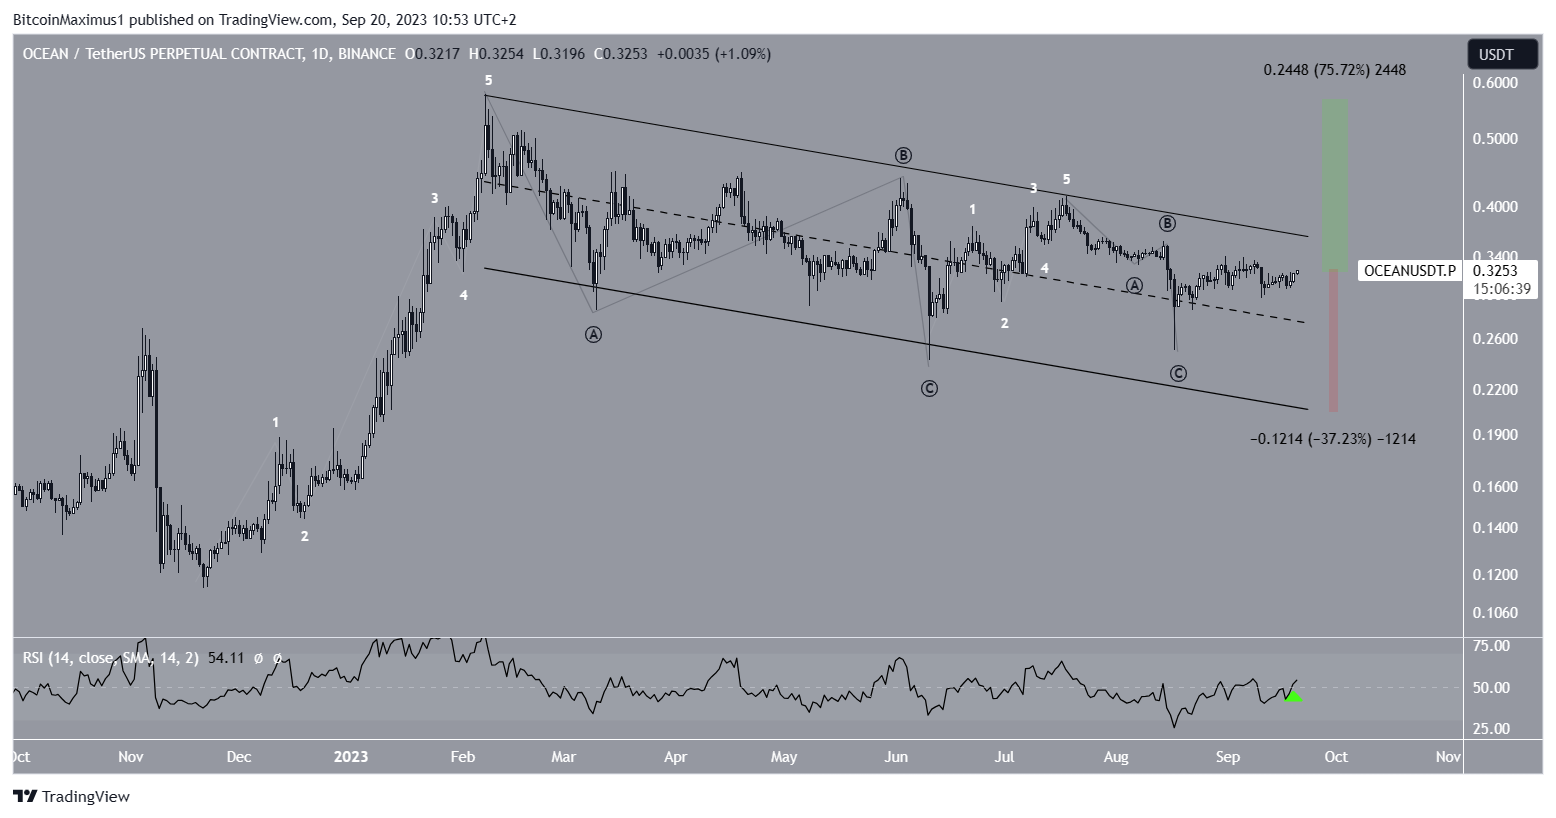
Therefore, the most likely OCEAN price prediction is a breakout from the channel and an increase of 75% to $0.55.
However, a rejection from the channel’s resistance line can cause a 37% drop to its support line at $0.21.
Read More: Best Crypto Sign-Up Bonuses in 2023
For BeInCrypto’s latest crypto market analysis, click here.


