VeChain (VET) has increased by 50 percent since May 22, after breaking out from a long-term descending resistance line. The TRON (TRX) price movement shares similarities to that of VET, allowing for the possibility that it will initiate a similar upward move.
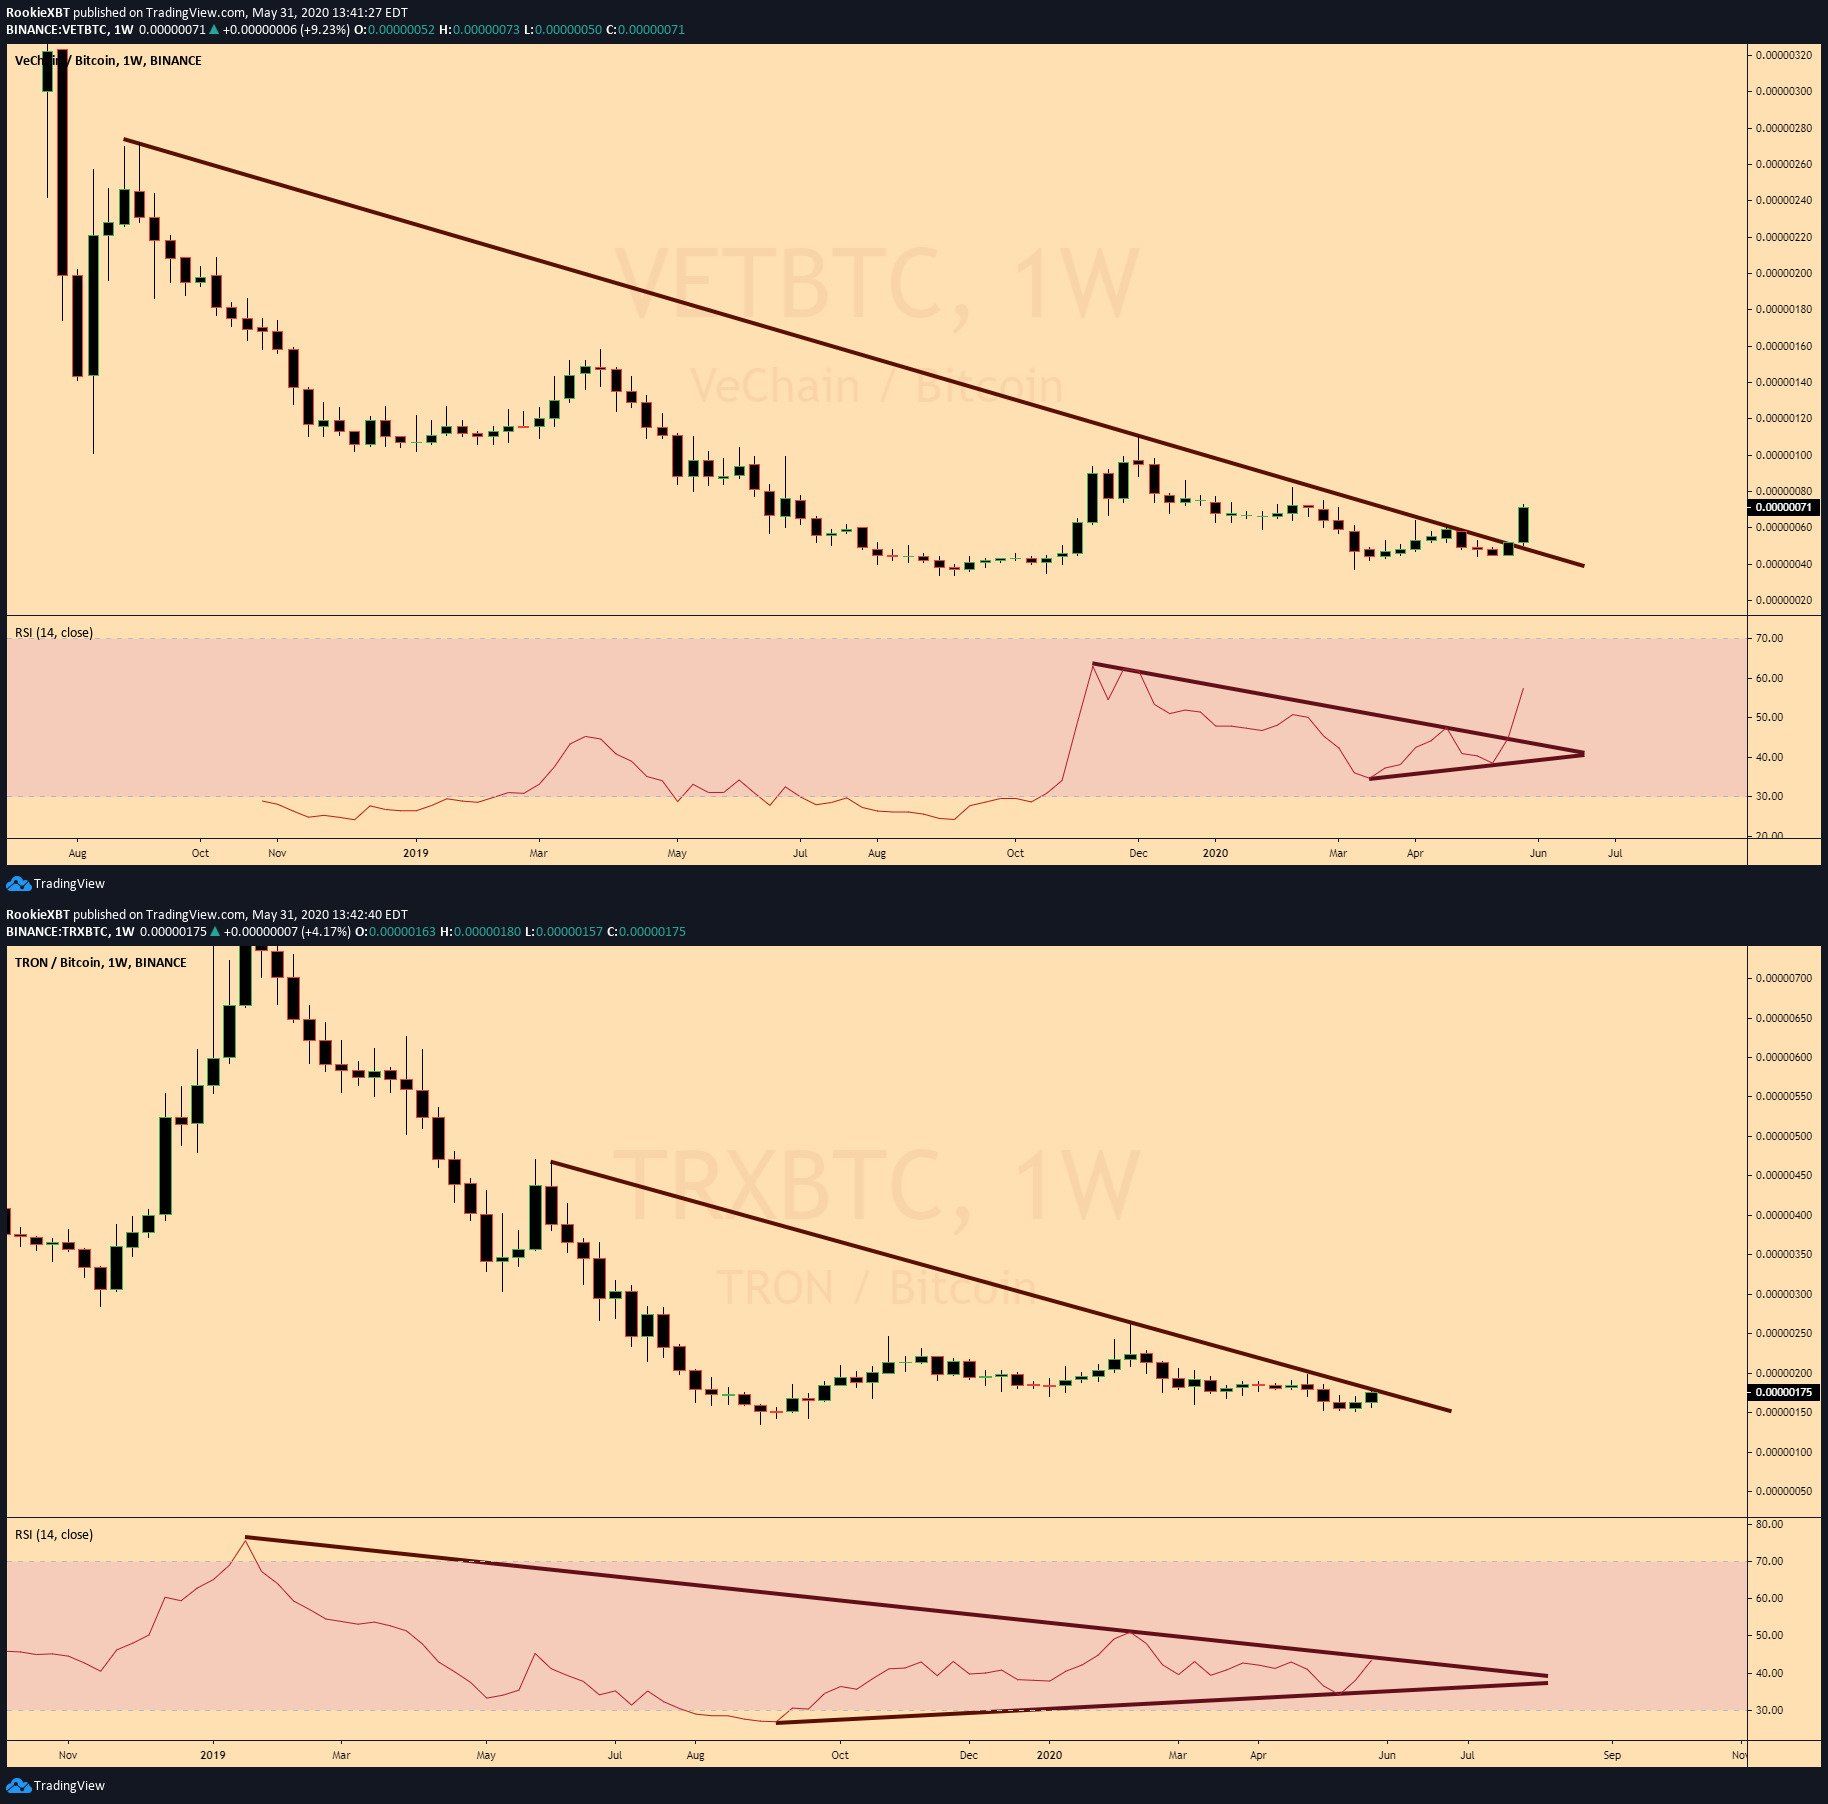
Cryptocurrency trader @RookieXBT outlined a chart comparing the movements of VET and TRX, which shows a similar descending reisstance line for both coins, stating that:
Popular to contrary belief, I think $TRX is about to have a run of its own. Here is a side by side comparison of $VET and $TRX Don’t sleep on Tron.
VeChain (VET)
Measuring from May 22, VET has increased by 50 percent. On May 25, the price broke out from a long-term descending resistance line, accelerating its rate of increase. This breakout was preceded by a long-term double bottom — a bullish reversal pattern — which was combined with bullish divergence in the RSI. At the time of writing, the VET price was trading inside resistance at 70 satoshis, with the next resistance area being found at 82 satoshis. The price has created a long upper wick, a sign of selling pressure. Therefore, VET could decrease and find support at 60 satoshis before making another upward move.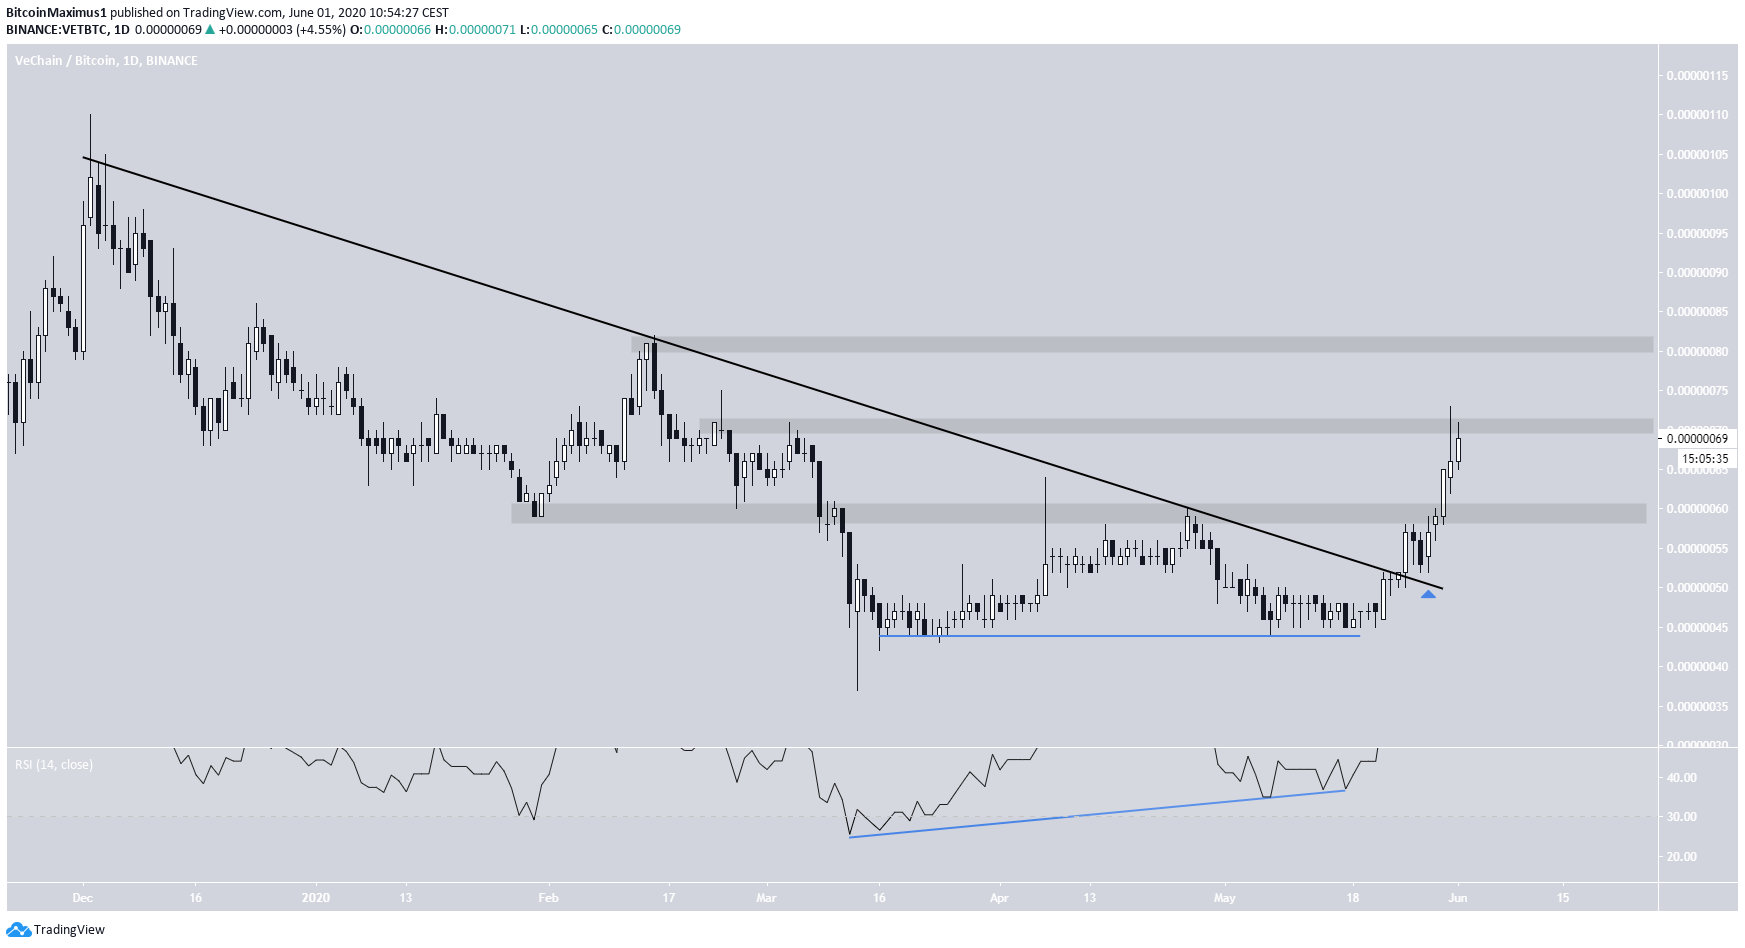
TRON (TRX)
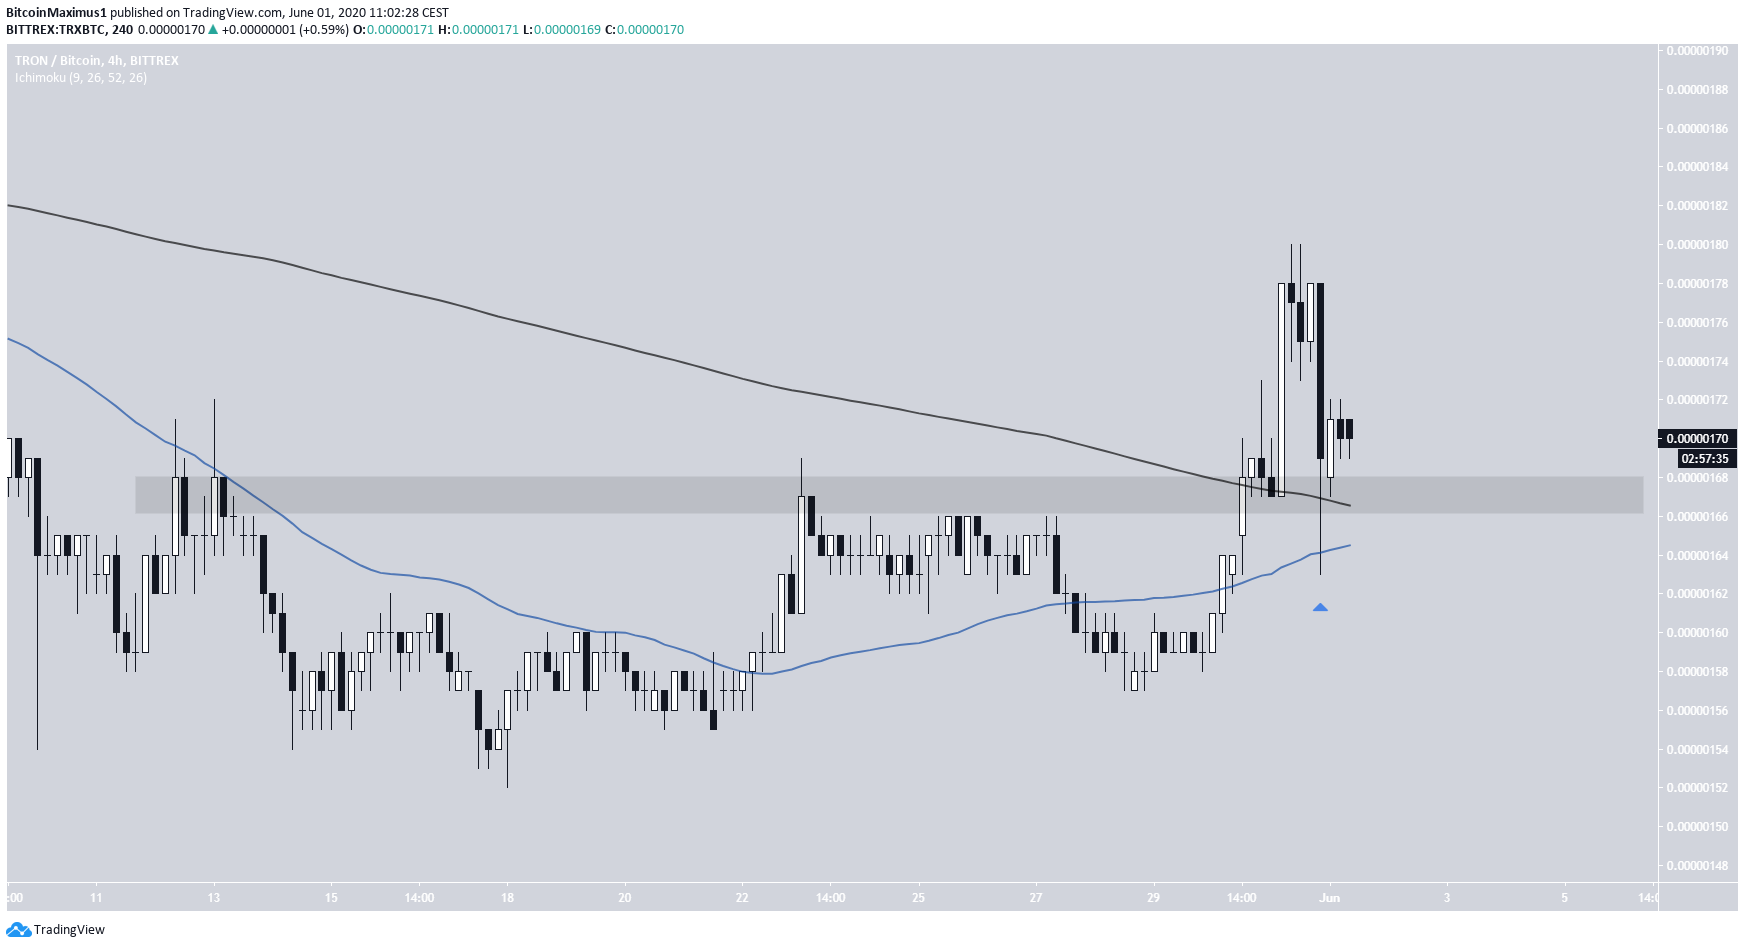
TRON has been following a descending resistance line since February 14 — currently touching it for the fourth time. While the price created a long upper wick above this line yesterday, it proceeded to decrease and fall back below it. In addition, the resistance line coincides with the 175 satoshi horizontal resistance level. The TRX price has generated bullish divergence throughout the entire month of May — a sign that the price is likely to break out. If it does, the closest resistance area would be found at 200 satoshis.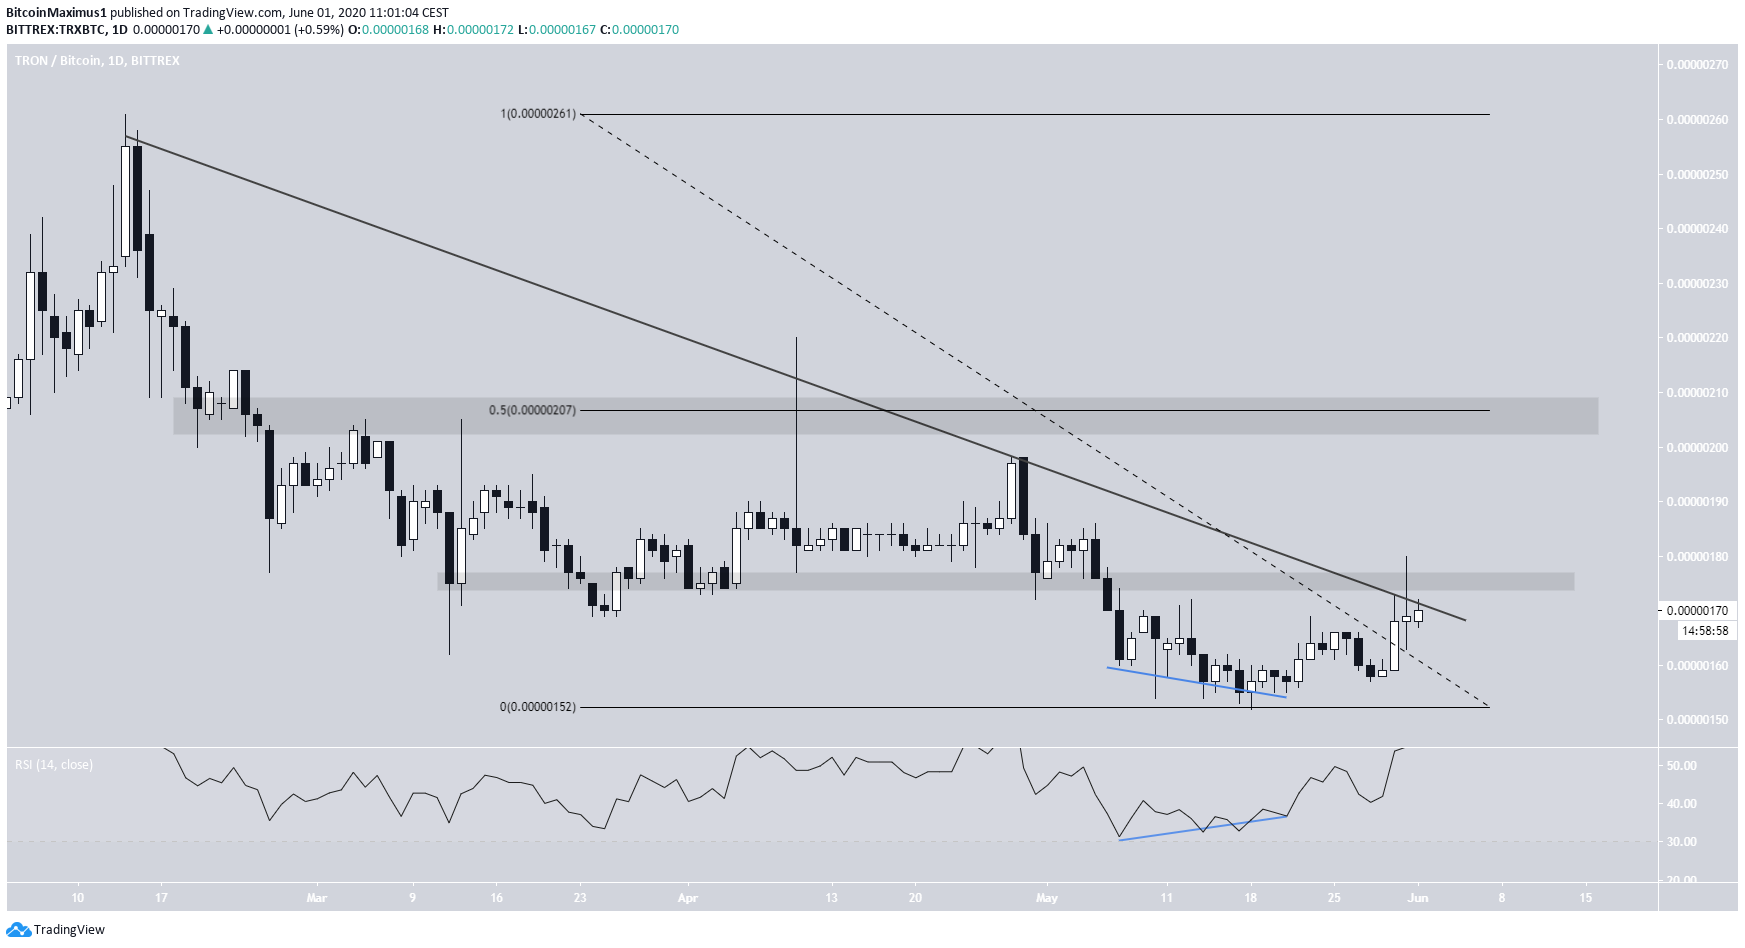
Bitcoin Dominance Rate (BTCD)
As altcoins increse at a faster rate than BTC, the Bitcoin dominance rate falls. Therefore, it is important to take a look at its price movement before attempting to enter altcoin trades. The BTCD rate has fallen below the 66.5 percent area that had been providing support. While the rate has generated bullish divergence, indicative that it could increase in order to validate the previous support area along with the possible descending resistance line, it is expected to eventually decrease to 65 percent.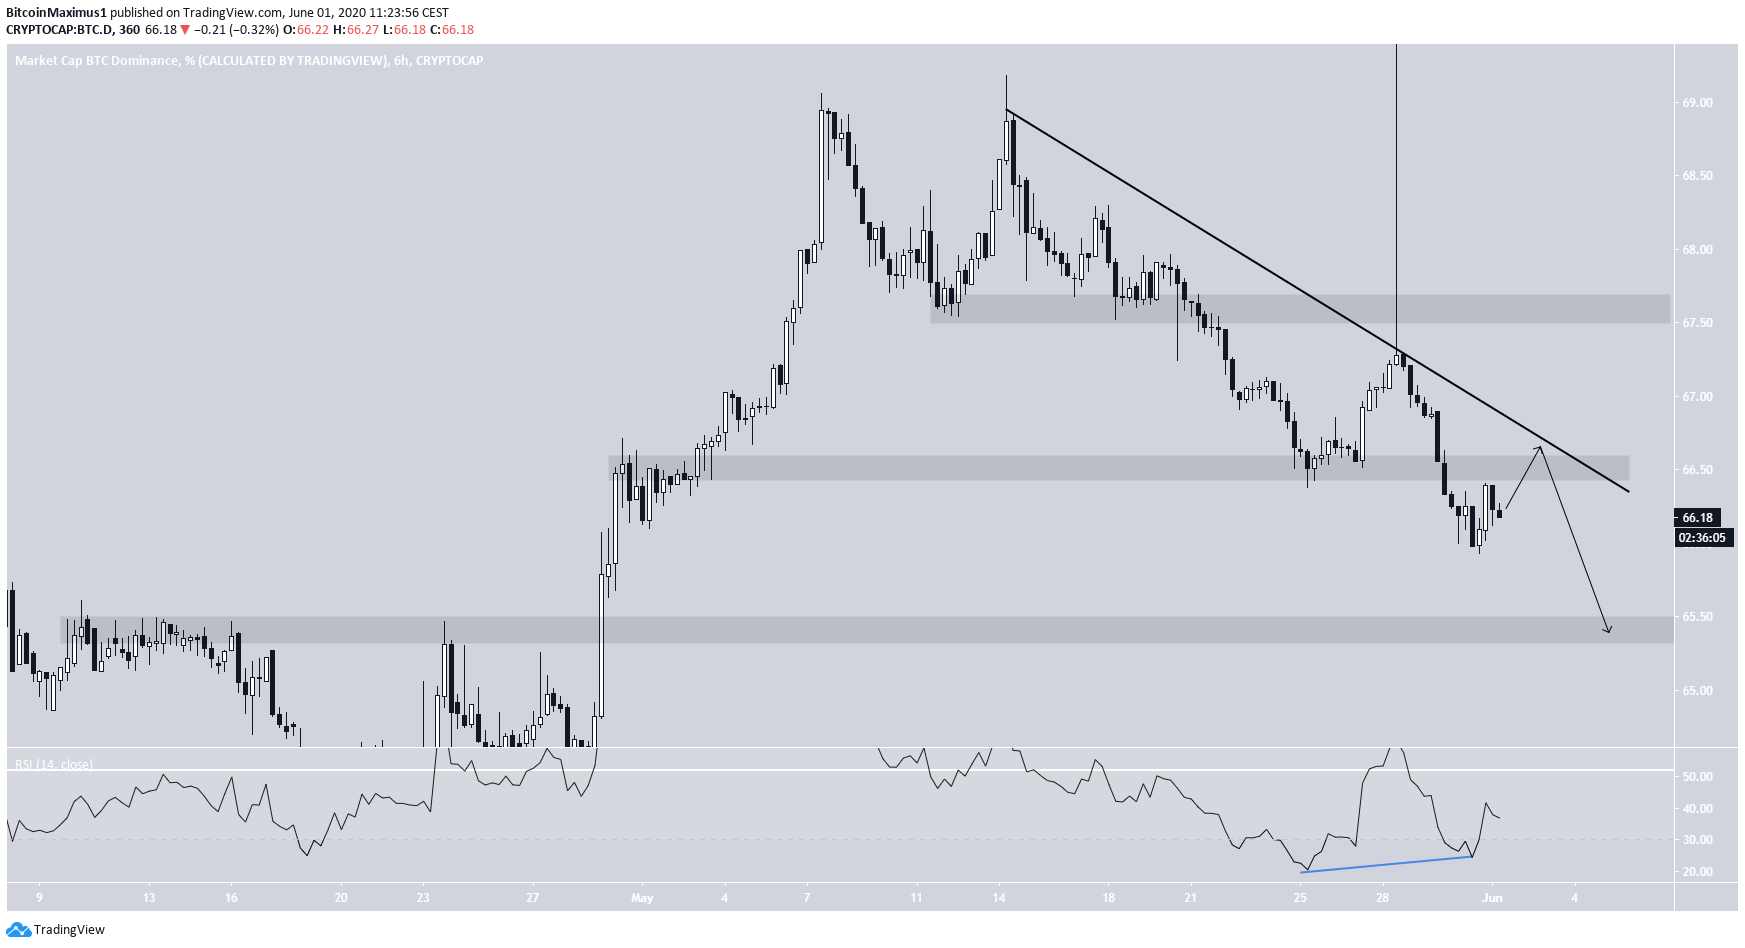
Disclaimer
In line with the Trust Project guidelines, this price analysis article is for informational purposes only and should not be considered financial or investment advice. BeInCrypto is committed to accurate, unbiased reporting, but market conditions are subject to change without notice. Always conduct your own research and consult with a professional before making any financial decisions. Please note that our Terms and Conditions, Privacy Policy, and Disclaimers have been updated.

Valdrin Tahiri
Valdrin discovered cryptocurrencies while he was getting his MSc in Financial Markets from the Barcelona School of Economics. Shortly after graduating, he began writing for several different cryptocurrency related websites as a freelancer before eventually taking on the role of BeInCrypto's Senior Analyst.
(I do not have a discord and will not contact you first there. Beware of scammers)
READ FULL BIO
Sponsored
Sponsored

