


The Fetch.ai (FET) price increased by nearly 25% yesterday and reached a new yearly high of $0.62 today before falling slightly.
Even though the price decreased, it still holds above an important horizontal area. Will it bounce or break down?
Fetch.ai Moves Above $0.60
The FET price has increased since falling to a low of $0.16 on August 17. The price created a higher low in October and accelerated its rate of increase greatly. Since then, the price has not suffered any significant retracements.
While the rally stalled at the start of December, the altcoin increased significantly yesterday and reached a new yearly high of $0.62 today. Despite the high, it fell below $0.60 afterward. With the RSI as a momentum indicator, traders can determine whether a market is overbought or oversold and decide whether to accumulate or sell an asset.
Bulls have an advantage if the RSI reading is above 50 and the trend is upward, but if the reading is below 50, the opposite is true.
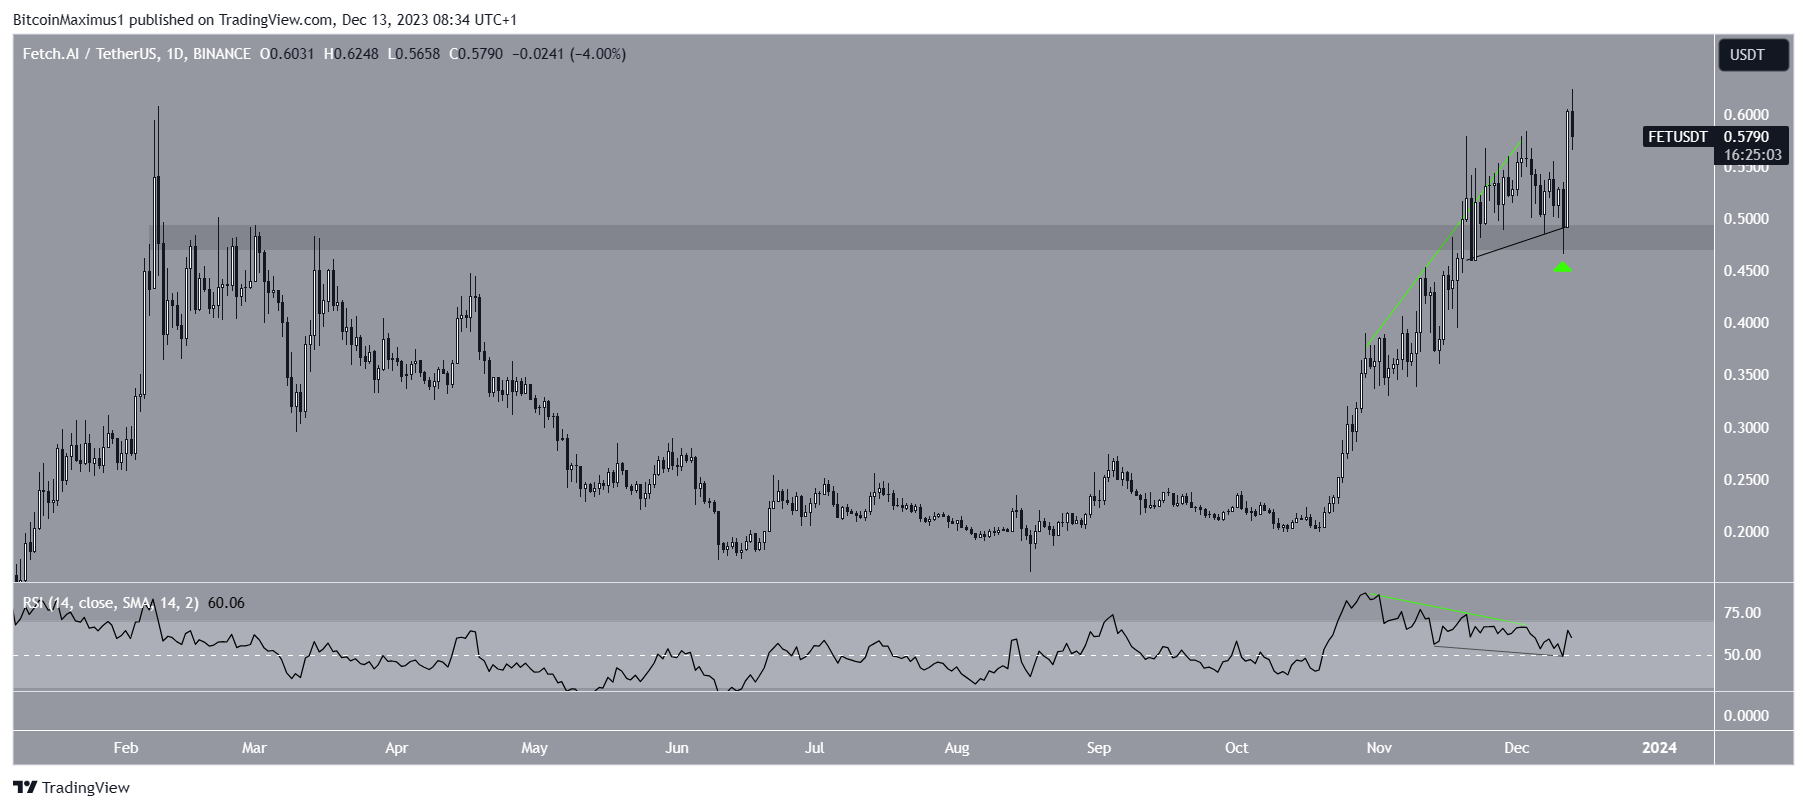
In December, the RSI generated a bearish divergence (green) before a small decrease. A bearish divergence occurs when a momentum decrease accompanies a price increase.
This led to a retest of a pivotal horizontal resistance area and its validation as support (green icon). Then, the price bounced after the RSI created a hidden bullish divergence (black). The indicator is now above 50.
What do Analysts Say?
Cryptocurrency analysts and traders on X are bullish for the future.
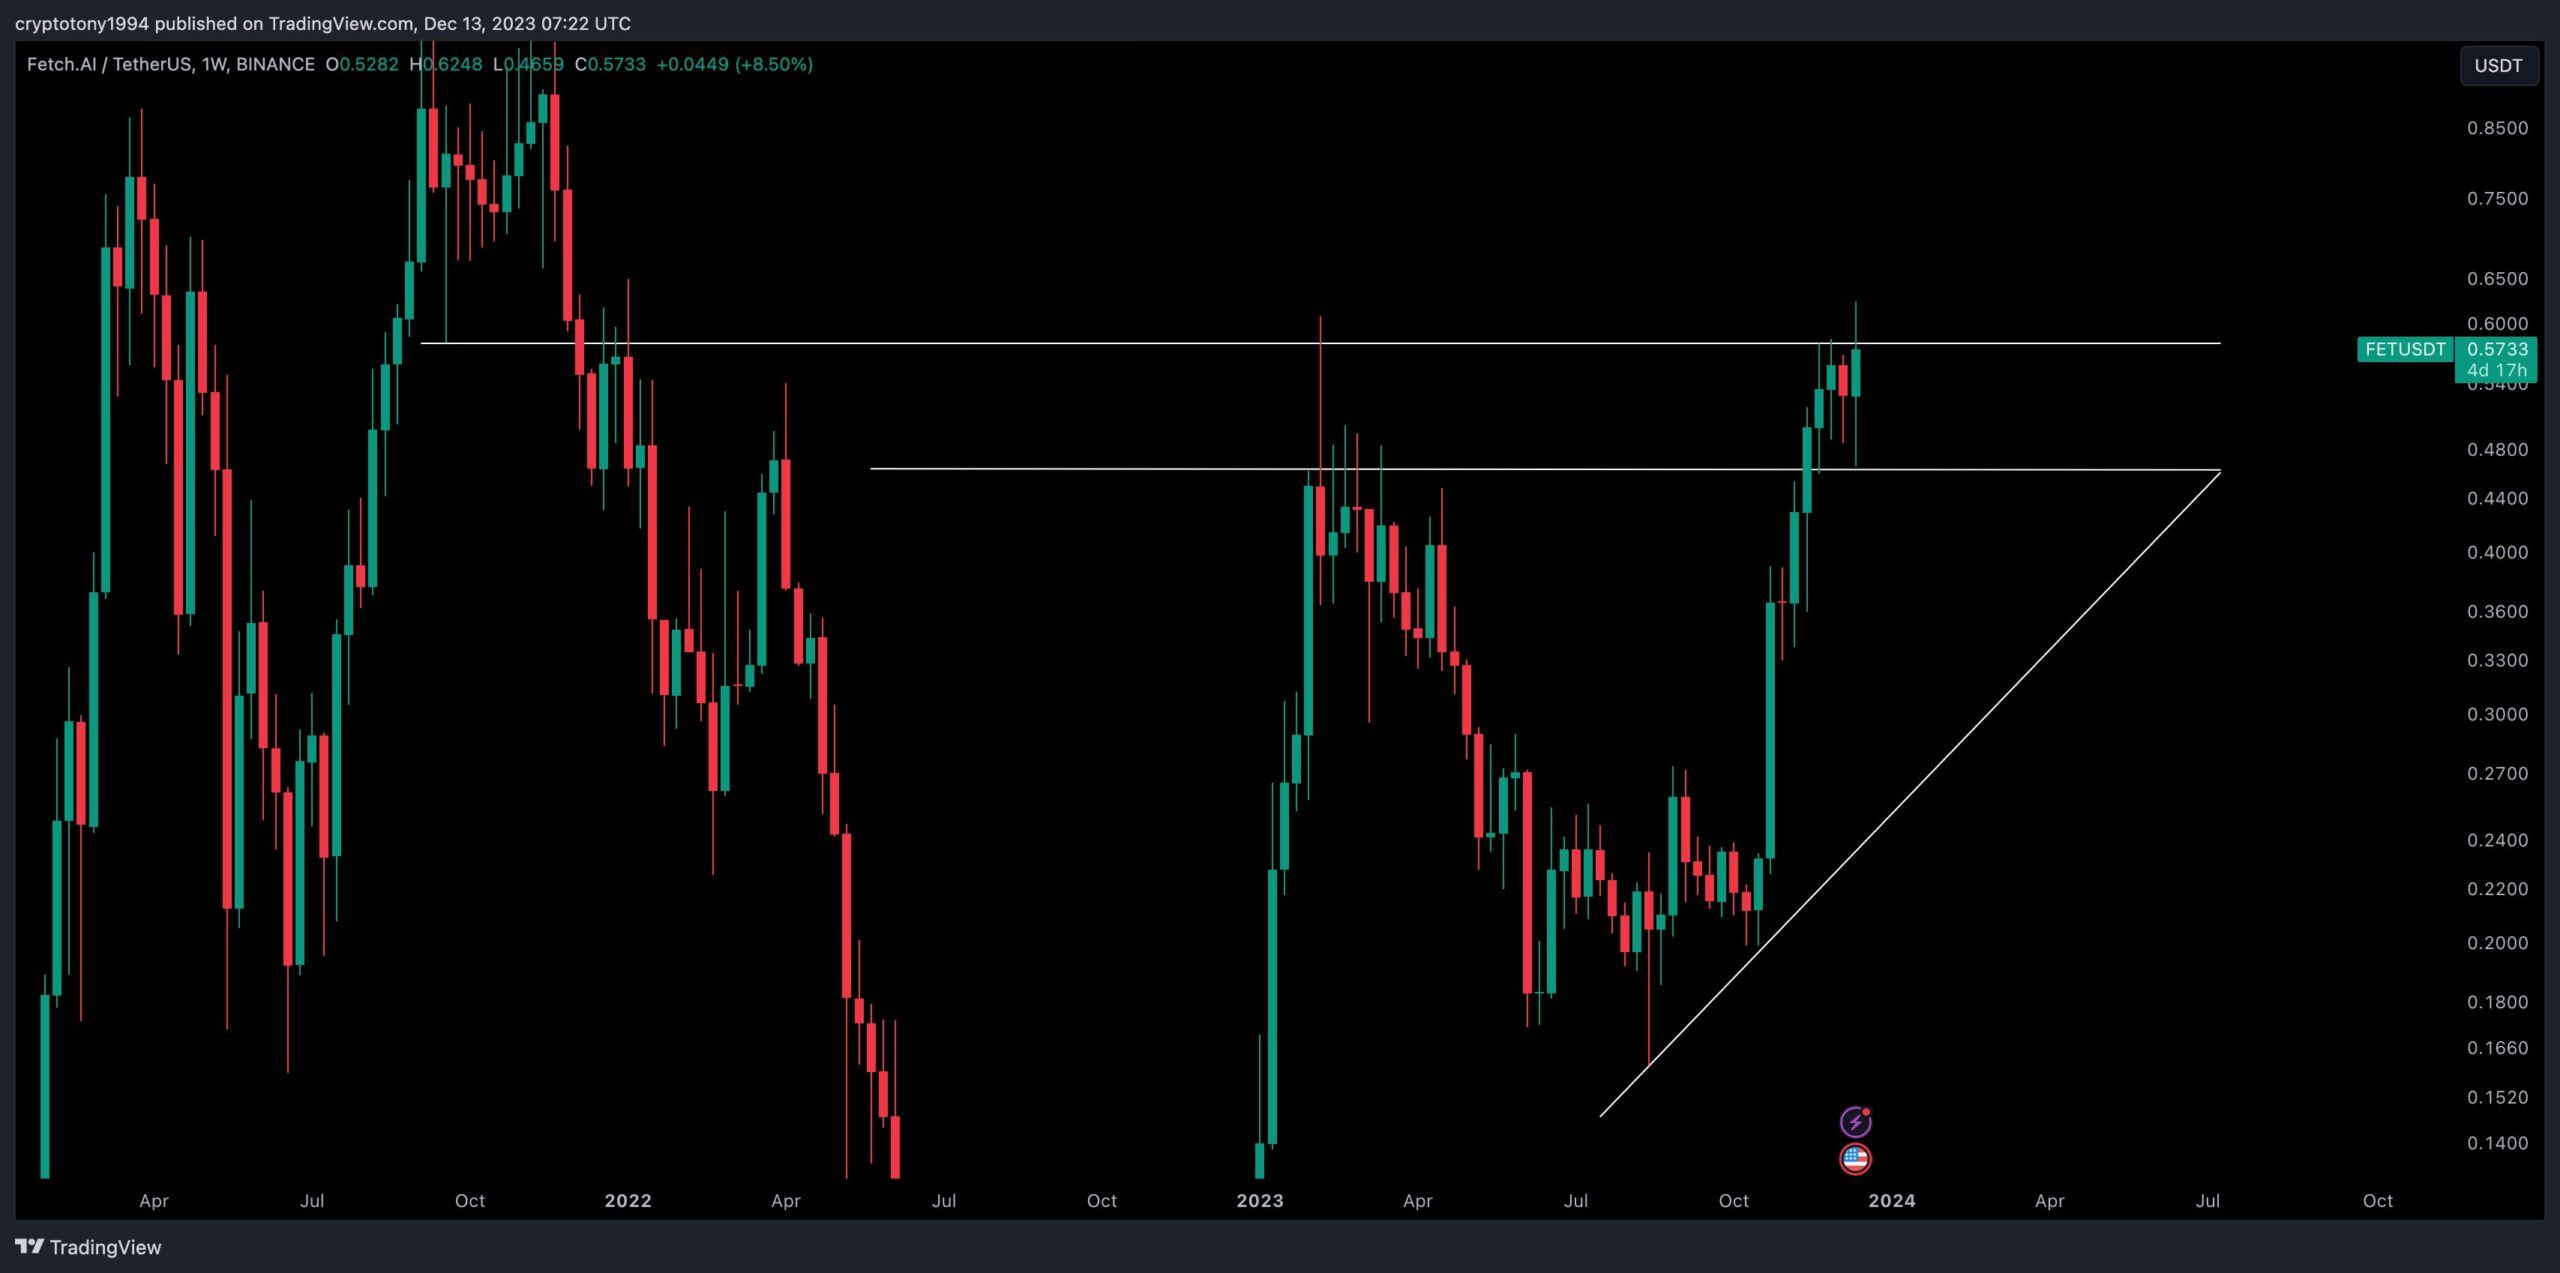
Crypto Tony suggests that the upward movement is just beginning, and there is still time to enter the trade.
DavidOnCrypto noted the new yearly high and suggested that the price can increase to the next resistance at $1.
ShitcoinAlchemist is bullish because of the Artificial Intelligence narrative. He tweeted:
If you want to ride the coin full of bullish momentum and on a way to price discovery. Get in with this #AI coin full of innovation and tech. This project has been struck and meanwhile gathered momentum to hit $1. I am talking about emerging $FET, you can’t miss the ATH rally and before other begins.
FET Price Prediction: How Long Will Increase Continue?
Technical analysts employ the Elliott Wave theory to identify recurring long-term price patterns and investor psychology, which helps them determine the direction of a trend.
The most likely wave count suggests that the price is in the fifth and final wave of an upward movement that started in August.
If the count is correct, the FET price will increase to at least $0.72. The target would give the current and the previous upward movement the same length. The reaction, once it gets there, will determine whether the upward movement continues. An increase of 25% is required to reach it.
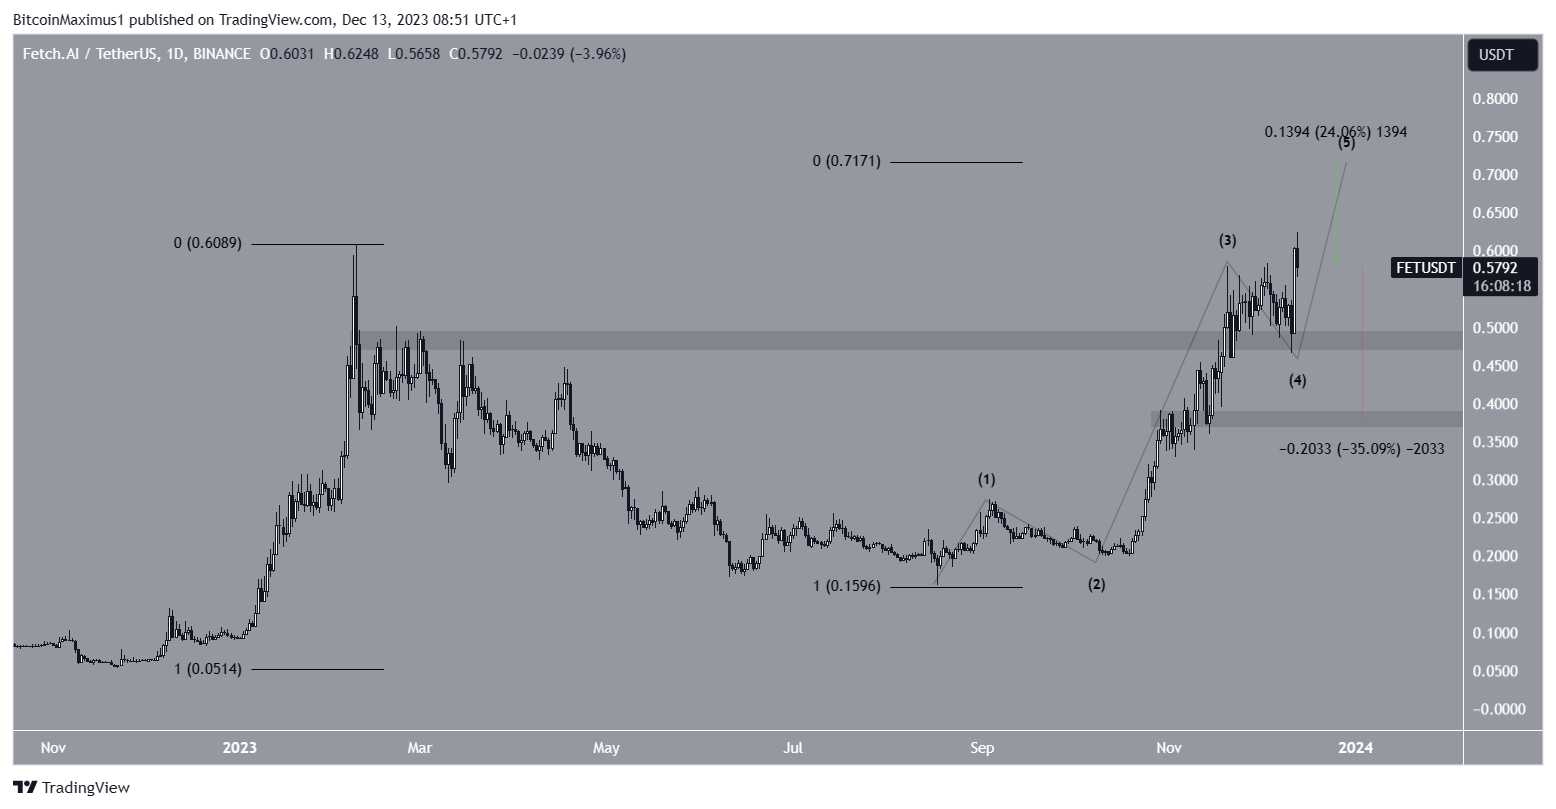
Despite this bullish FET price prediction, a close below $0.48 will invalidate the bullish forecast. The FET price could fall by 35% to $0.38 in that case.
For BeInCrypto’s latest crypto market analysis,click here.


