


Fetch.ai (FET), Stellar (XLM), and Bluzelle (BLZ) have all increased during the weekend and cleared important resistance levels.
While the crypto market was relatively stable during the weekend, these cryptocurrencies increased significantly. Therefore, they are considered the weekend altcoin gainers.
Featch.AI (FET) Price Leads Weekend Gainers
The FET price has increased alongside an ascending support line since June 10. The line has been validated numerous times, more recently on August 17 and 22 (green icons). The latter created a higher low and accelerated the rate of increase.
On September 2, the FET price broke out and closed above the $0.25 horizontal resistance area. Now, the area is expected to provide support.
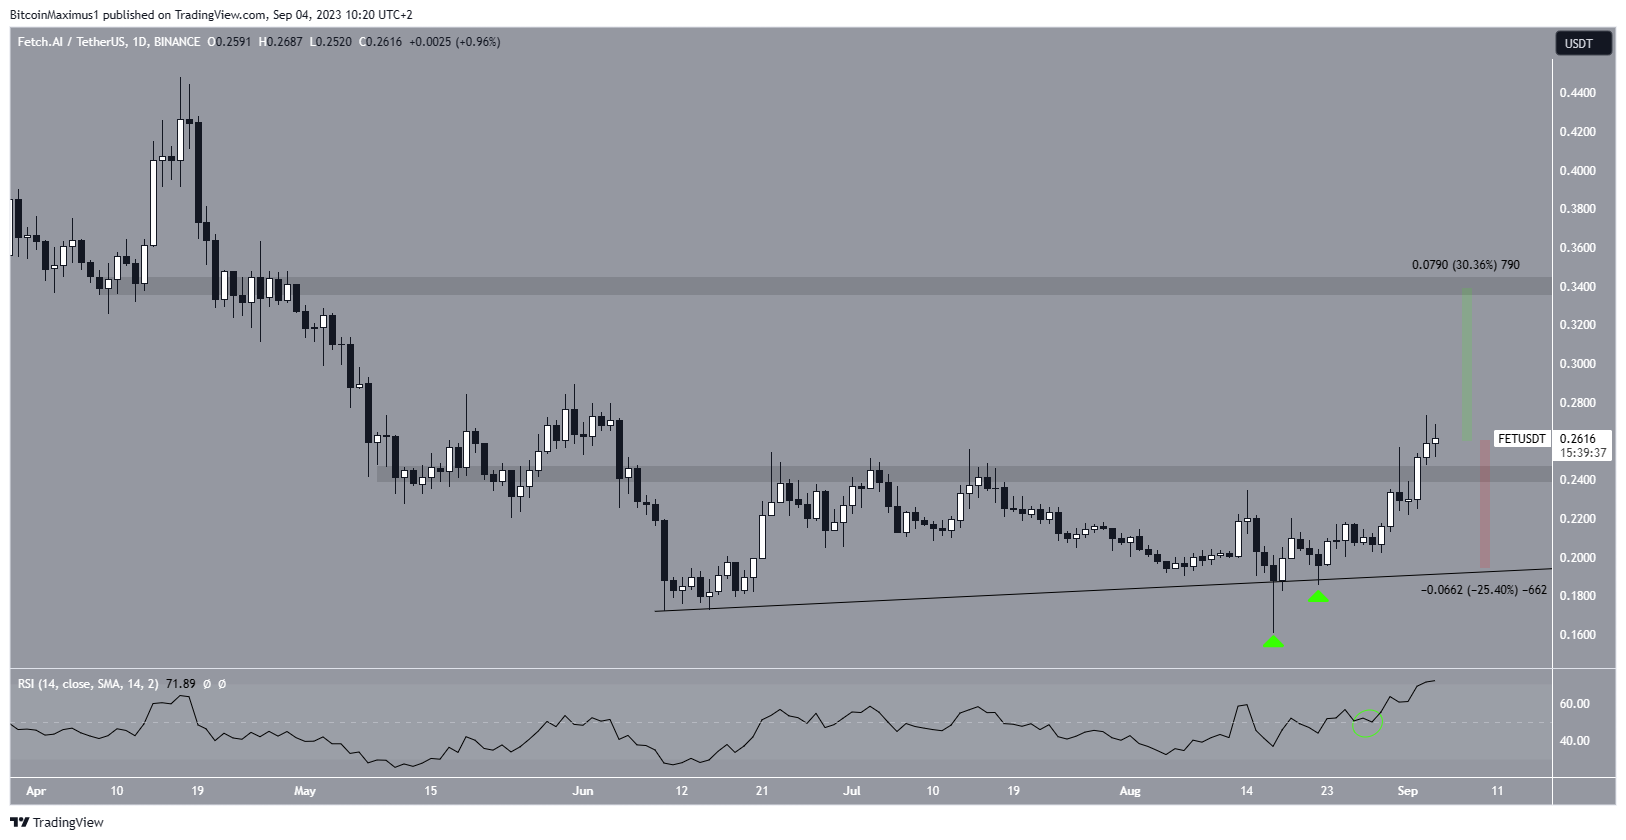
The RSI supports the breakout. With the RSI as a momentum indicator, traders can determine whether a market is overbought or oversold and decide whether to accumulate or sell an asset.
Bulls have an advantage if the RSI reading is above 50 and the trend is upward, but if the reading is below 50, the opposite is true. The indicator is above 50 and increasing (green circle), both signs of a bullish trend.
Looking to be profitable? Learn How To Make Money in a Bear Market.
If FET continues to increase, it can reach the next resistance at $0.34. An upward movement of 30% will be required for the price to reach it. On the other hand, a close below $0.25 will invalidate the breakdown. If that occurs, a 25% drop to the ascending support line at $0.20 will likely be the future price scenario.
Stellar (XLM) Price Breaks Out After Bounce
The XLM price has decreased since July 13, following a descending resistance line. The decrease led to a low of $0.105 on August 17. The price bounced afterward, validating the $0.110 horizontal support area and creating a long lower wick (green icon), considered a sign of buying pressure.
After creating a higher low on September 2, XLM broke out from the resistance line two days later. Since the line had been in place for 52 days, the breakout from it is expected to initiate a significant increase. However, despite the breakout, the price still trades below the main resistance at $0.130.
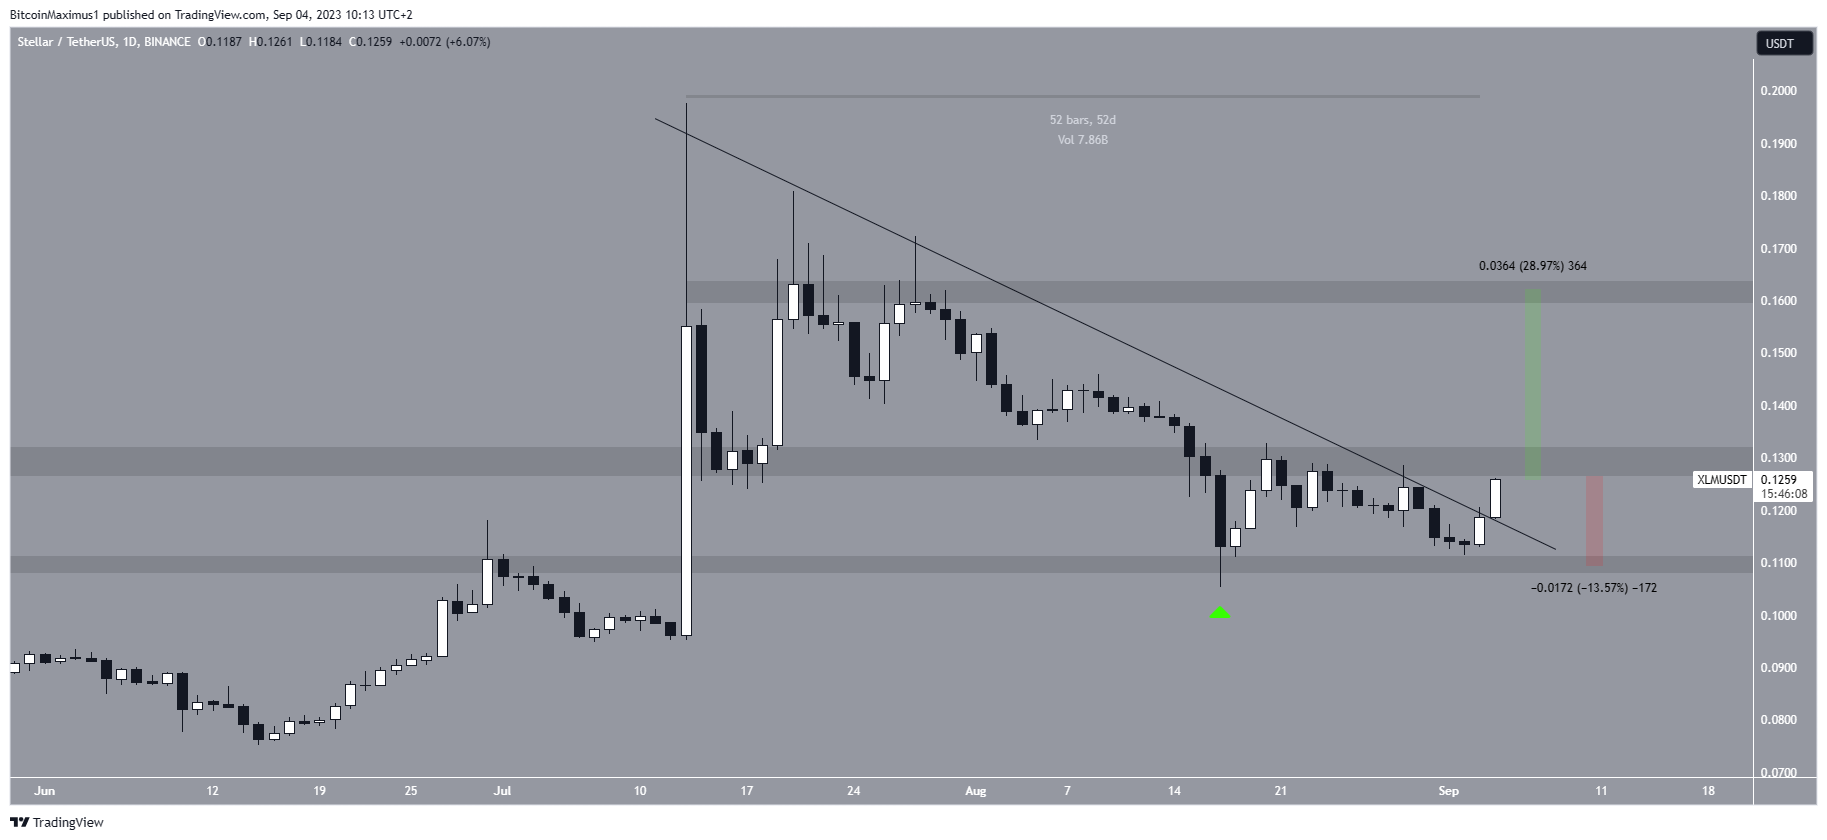
If the price reclaims the $0.130 area, it can increase by 30% and reach the next resistance at $0.160. On the other hand, a rejection from the area can catalyze a drop to the resistance line, which coincides with the $0.110 horizontal support area. This would amount to a decrease of nearly 15%.
Bluzelle (BLZ) Aims to Clear Resistance
The BLZ price has increased since creating a higher low on August 7. Initially, the price failed to move above the $0.125 horizontal resistance area. Rather, it was rejected, created a long upper wick (red icon), and fell below the area.
However, a push during the weekend increased the price above the $0.125 area. The area will be expected to provide support if the price closes above it.
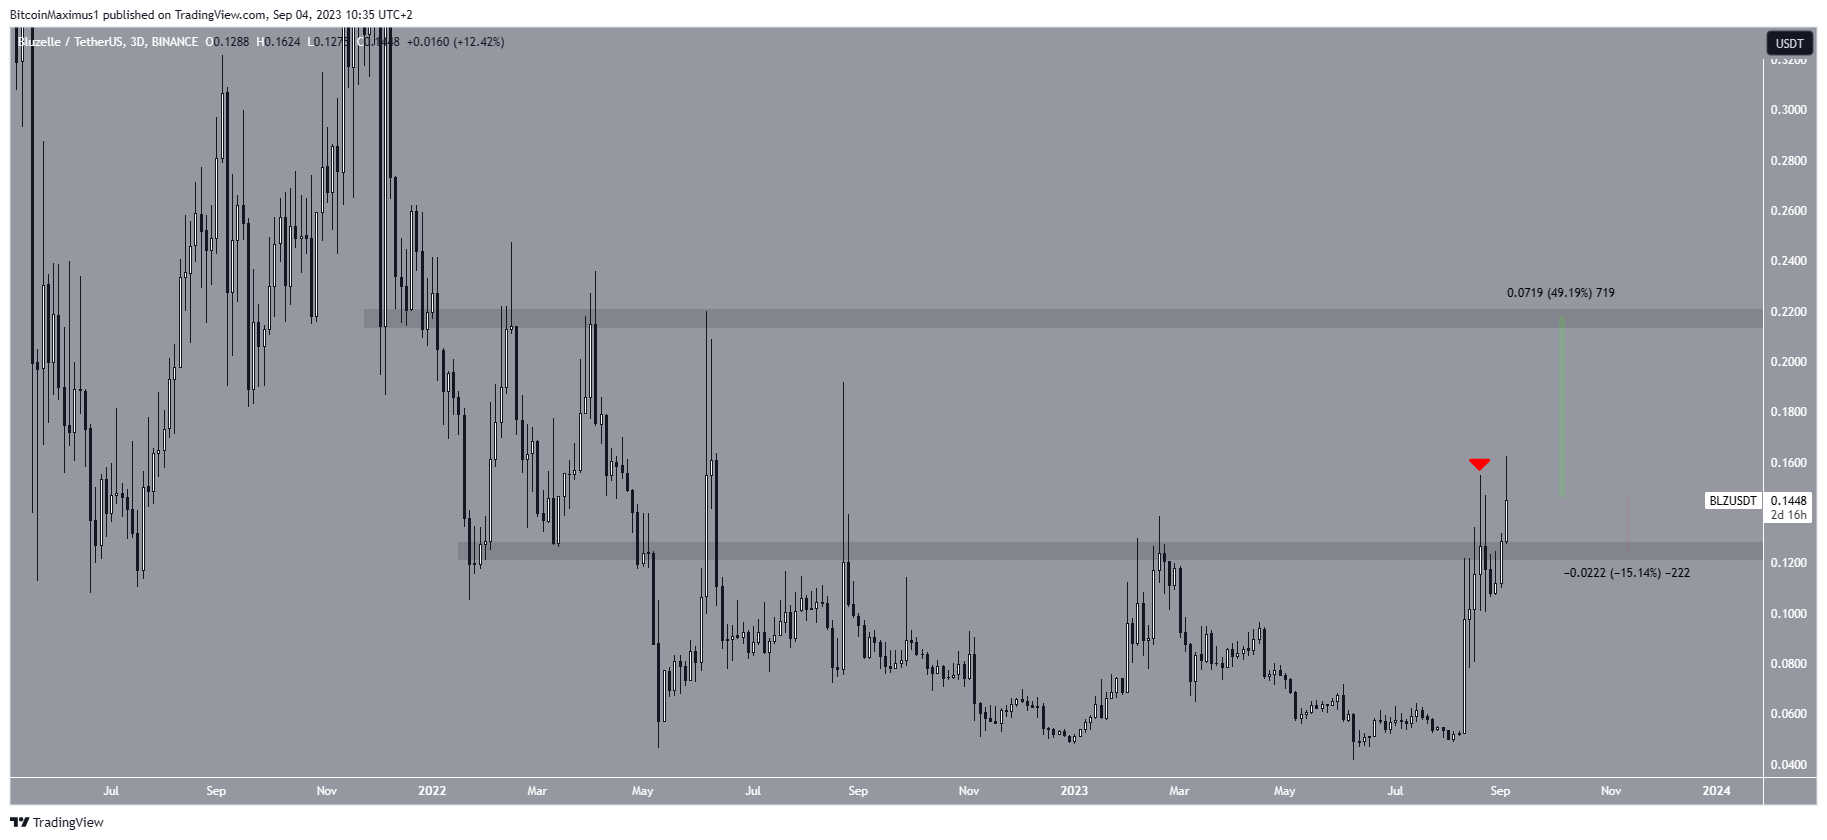
If the upward movement continues, BLZ can increase by another 50% and reach the $0.22 resistance area. On the other hand, a loss of momentum can cause a 15% drop to the $0.125 area, validating it as support.
Read More: Top 11 Crypto Communities To Join in 2023
For BeInCrypto’s latest crypto market analysis, click here.


