


Stellar (XLM) is one of these rare altcoins that boasts a long and positive trading history. Created in 2014 and launched a year later, the protocol for payment providers and financial institutions has been at the top of the cryptocurrency rankings for years.
Long-term analysis shows that the Stellar price may now be on the threshold of a new bull market. If the scenario of the previous two cycles plays out, XLM could surge as much as 350% over the next several months.
Stellar Price Enters Bull Market
A long-term, monthly chart of the XLM price gives an insight into the altcoin’s history since its launch in 2015. Unlike many cryptocurrencies launched then, the Stellar price chart offers a bullish outlook.
Most notably, the Stellar price experienced two bull markets reaching similarly high valuations. In early 2018, the XLM price reached an all-time high (ATH) of $0.93. Meanwhile, during the previous bull market, it reached $0.80 in May 2021.
Interestingly, the monthly candles closed in the $0.53 area in both cases, now serving as long-term resistance and the target of the next bull market. If the Stellar price were to rise to this area from its current valuation of $0.12, it would represent a 350% surge.
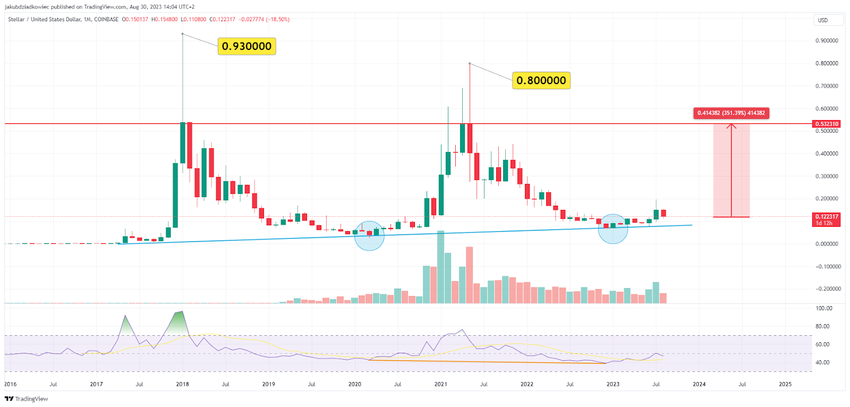
Another bullish signal is the ascending long-term support line (blue), which has existed since April 2017. So far, the macro lows of the previous two bear markets have validated it as support (blue circles).
Moreover, the Stellar price on the monthly chart has formed a rarely observed long-term hidden bullish divergence. The RSI indicator recorded a lower low in 2022 than the 2020 low (orange line). In contrast, the XLM price formed a higher low over the same period.
XLM Is Heating Up
Market analyst @PUKACharts provided additional arguments for an imminent breakout of the XLM price in a recent post. Also, he looked at the monthly chart of the Stellar price and concluded that “XLM is heating up.”
Among his bullish arguments were:
- Breakout above the 10-month SMA
- A confirmed bullish cross on the MACD
- Both signals appear in the green window of the bull market
- Breakout above the POC (red line)
- Breakout above the resistance line on the OBV indicator (blue chart at the bottom)
The most important element of this long-term analysis is that for the past month, the Stellar price has been trading in the green area of the bull market. If the scenario of the previous two uptrends plays out, the long-term target will be those above the $0.53 level.
Looking For a New Exchange? These Are the Best Crypto Sign-Up Bonuses in 2023
XLM Price Prediction: The Nearest Resistance at $0.24
The weekly chart confirms the bullish signals of the monthly time frame. The recent decline in the cryptocurrency market has led the Stellar price to drop from a local peak of $0.20 reached in early July 2023. However, the downward move looks corrective and is currently at the 0.618 Fib retracement level. This level usually serves as support.
In addition, the XLM price has validated the horizontal support area at $0.11. Previously, it has repeatedly served as resistance and support (blue circles). If a bounce occurs, the next resistance level is $0.24, which marks the close of the weekly candle from March 2022.
However, if a breakdown occurs, the Stellar price will likely retest the long-term rising support line. It is currently located in the vicinity of $0.08.
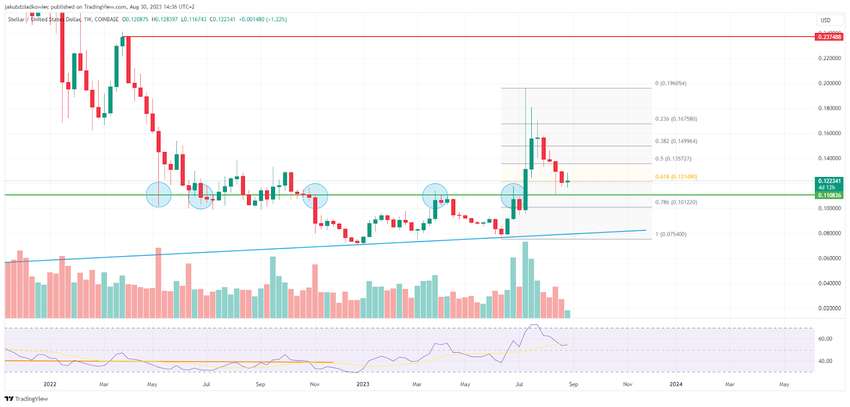
A bullish reading is also provided by the RSI, which, despite its recent decline, remains above the key 50 level. If the RSI remains above 50 and the trend is upward, the bulls have the advantage. The opposite is true if the RSI is below 50 with a downtrend. If the indicator bounces off this key area and increases, this will confirm a bullish trend reversal for the XLM price.
Check Out the 9 Best AI Crypto Trading Bots to Maximize Your Profits
For BeInCrypto’s latest crypto market analysis, click here.


