


The Toncoin (TON) price broke out from a descending resistance line and is approaching its local high at $2.97.
The price action is still bullish, but the RSI readings and Elliott Wave count suggest that a top will be reached soon.
TON Price Breaks Out From 270-Day Resistance
The TON price has fallen under a descending resistance line since reaching a local high of $2.97 in December 2022. The decrease culminated with a low of $1.02 on June 10.
However, the price bounced sharply afterward, creating a very long lower wick, considered a sign of buying pressure. The long lower wick was massive, leading to a 45% increase the same day.
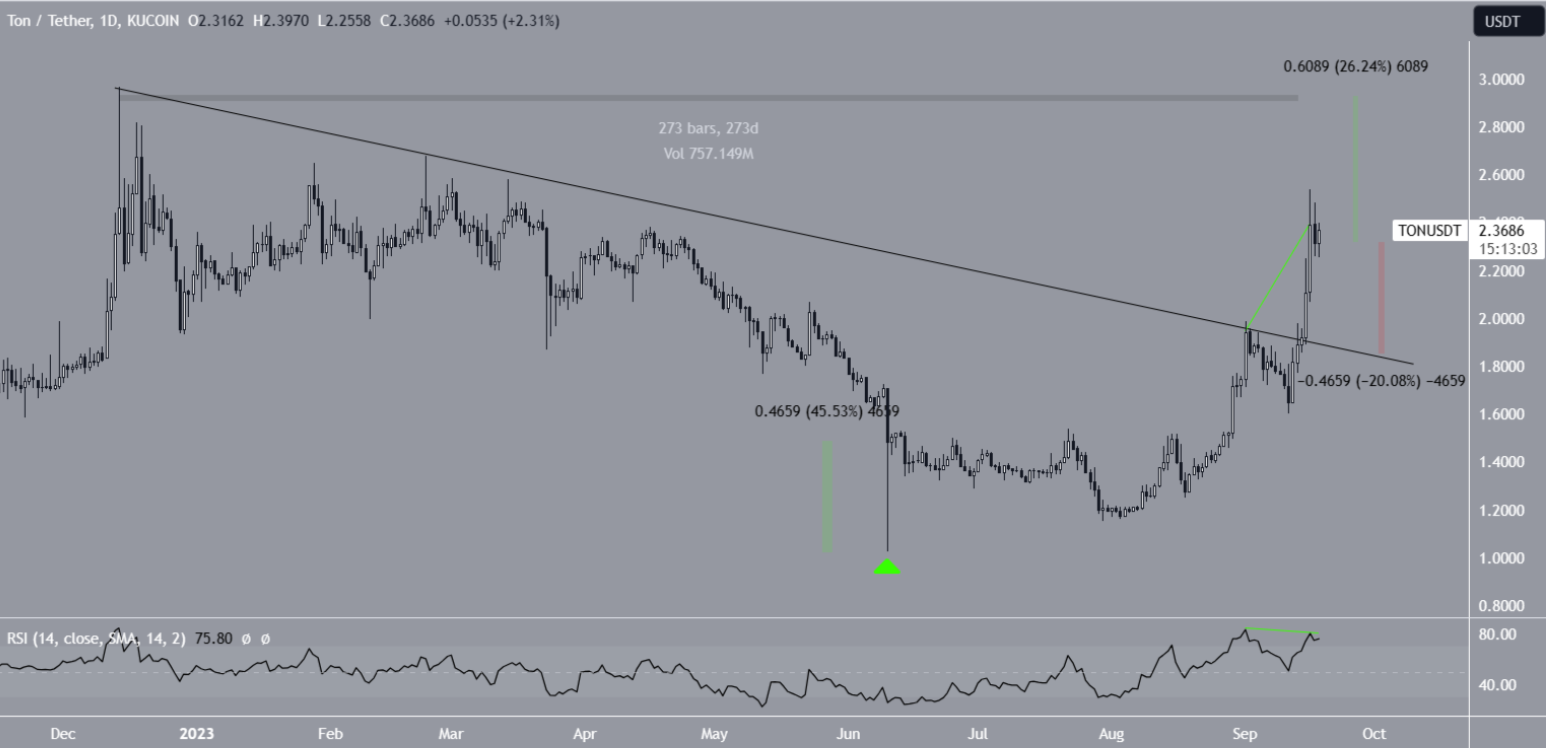
After the bounce, TON created a higher low at the beginning of August and accelerated its increase afterward. On September 15, after being in place for 270 days, the TON price broke out from the descending resistance line.
It reached a high of $2.54 the next day. The increase occurred shortly after the TON wallet went live on Telegram, gaining exposure to 800 million users.
The December 2022 high of $2.97 is 27% above the current price, while the resistance line is at $1.90, 20% below the current price.
The daily RSI gives mixed signs. Traders use the RSI as a momentum gauge to evaluate if a market is overbought or oversold and make decisions about buying or selling assets. When the RSI reading is above 50 the upward trend indicates an advantage for bullish traders. Conversely, when the reading is below 50, the situation favors bearish traders.
While the indicator is increasing and above 50, it has also generated a bearish divergence (green line). This occurs when a momentum decrease accompanies a price increase and is a sign associated with local or absolute tops.
TON Price Prediction: How Long Will Increase Continue?
The technical analysis from the shorter-term six-hour timeframe shows that the Toncoin price is likely in the fifth and final wave of a five-wave upward movement (white).
Technical analysts employ the Elliott Wave theory as a means to identify recurring long-term price patterns and investor psychology, which helps them determine the direction of a trend.
According to the count, the TON price is approaching the end of the fifth wave. A likely target for the top is at $2.77. The target is found by projecting the length of wave one and three to the bottom of wave four.
This target is reached when the fifth wave extends, as has been the case for TON.
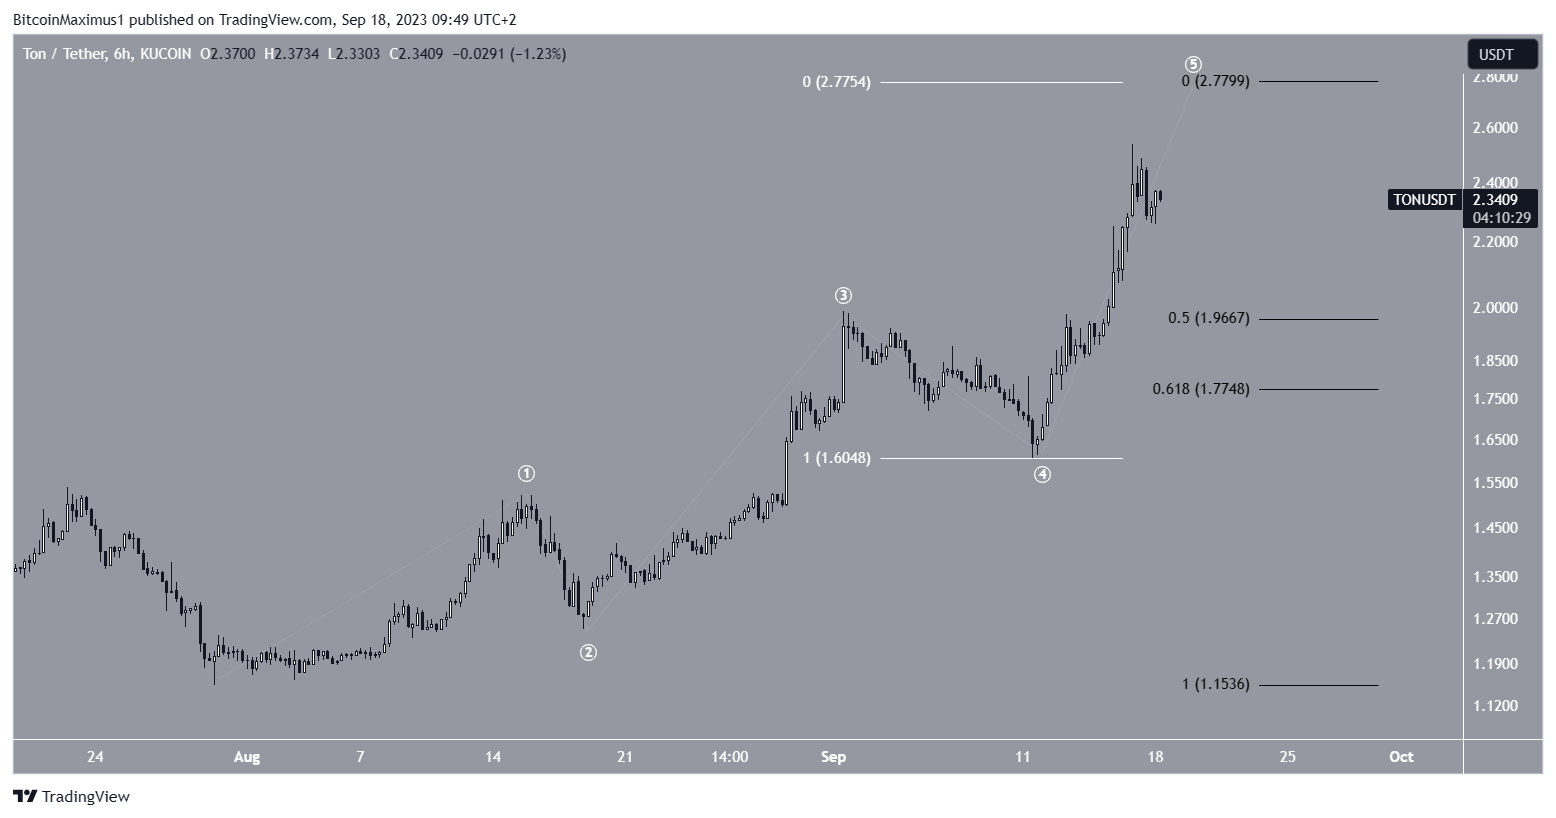
After the top is reached, a significant correction is likely. While the target for the bottom depends on the exact top, a likely area is between the 0.5-0.618 Fib retracement support levels at $1.77-$1.97.
This would likely coincide with a retest of the long-term descending resistance line.
As a result, the most likely TON price prediction is bullish, predicting an increase towards the Dec. 2022 high at $2.97 but a likely top at $2.77. Failure to reach this level could lead to a 20% drop towards the $1.77-$1.97 region.
Read More: 9 Best Crypto Demo Accounts For Trading
For BeInCrypto’s latest crypto market analysis, click here.


