


The Shiba Inu (SHIB) price has decreased from an important horizontal support level to $0.0000080. This indicates that the long-term trend is likely bearish.
Readings from the weekly and daily timeframes are both bearish. So, they support continuing the decrease towards the next closest support.
Shiba Inu Price Descent Continues Below Support
The weekly technical analysis on the SHIB price shows a downward movement ongoing since August. At the time, the price was rejected by a descending resistance line (red icon). The decrease caused a breakdown from the $0.0000080 horizontal support area. This was a critical area since it had acted as support for most of the period between May 2022 and now.
The SHIB price is midway to the closest support at $0.0000060. Falling to it would amount to a decrease of another 18%. Conversely, a breakout from the $0.000080 area and the resistance line can lead to a 110% increase to the next resistance at $0.0000150.
Interestingly, despite these setbacks, Shibarium wallets hit the 1 million mark in September.
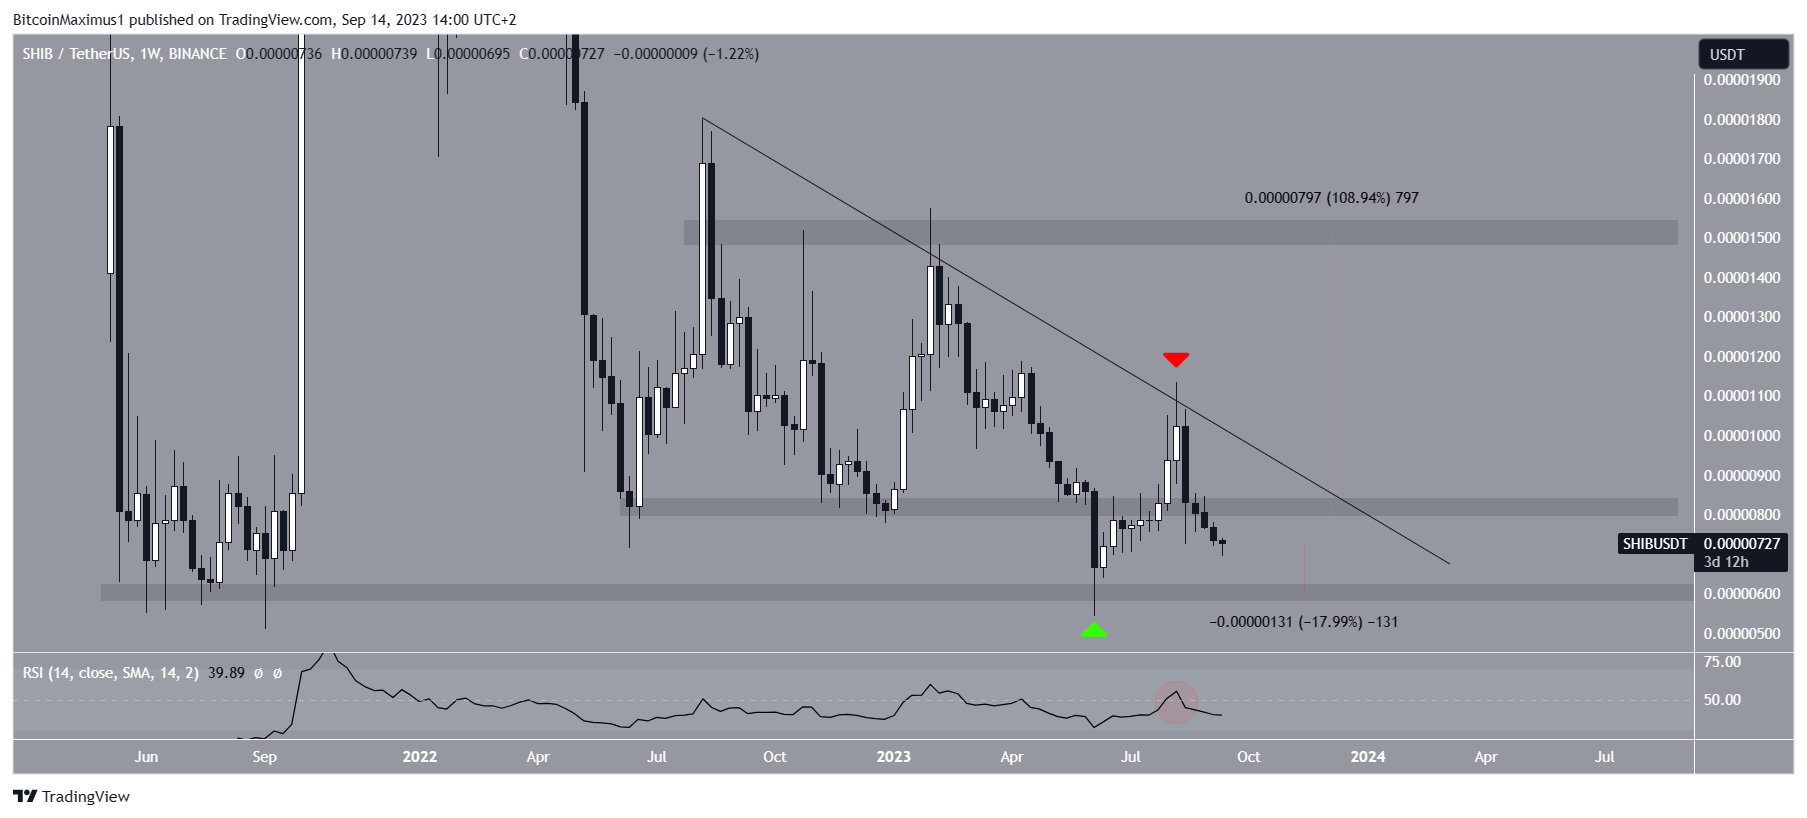
The weekly Relative Strength Index (RSI) is showing bearish tendencies. RSI is a tool traders use to gauge whether a market is overbought or oversold. Readings above 50 and an upward trend indicate a favorable position for bulls. Readings below 50 suggest the opposite.
At the same time the price encountered resistance, the RSI was rejected at the 50 line (red circle), now residing below it. These combined factors indicate a bearish trend, implying a bearish outlook for Shiba Inu’s price prediction.
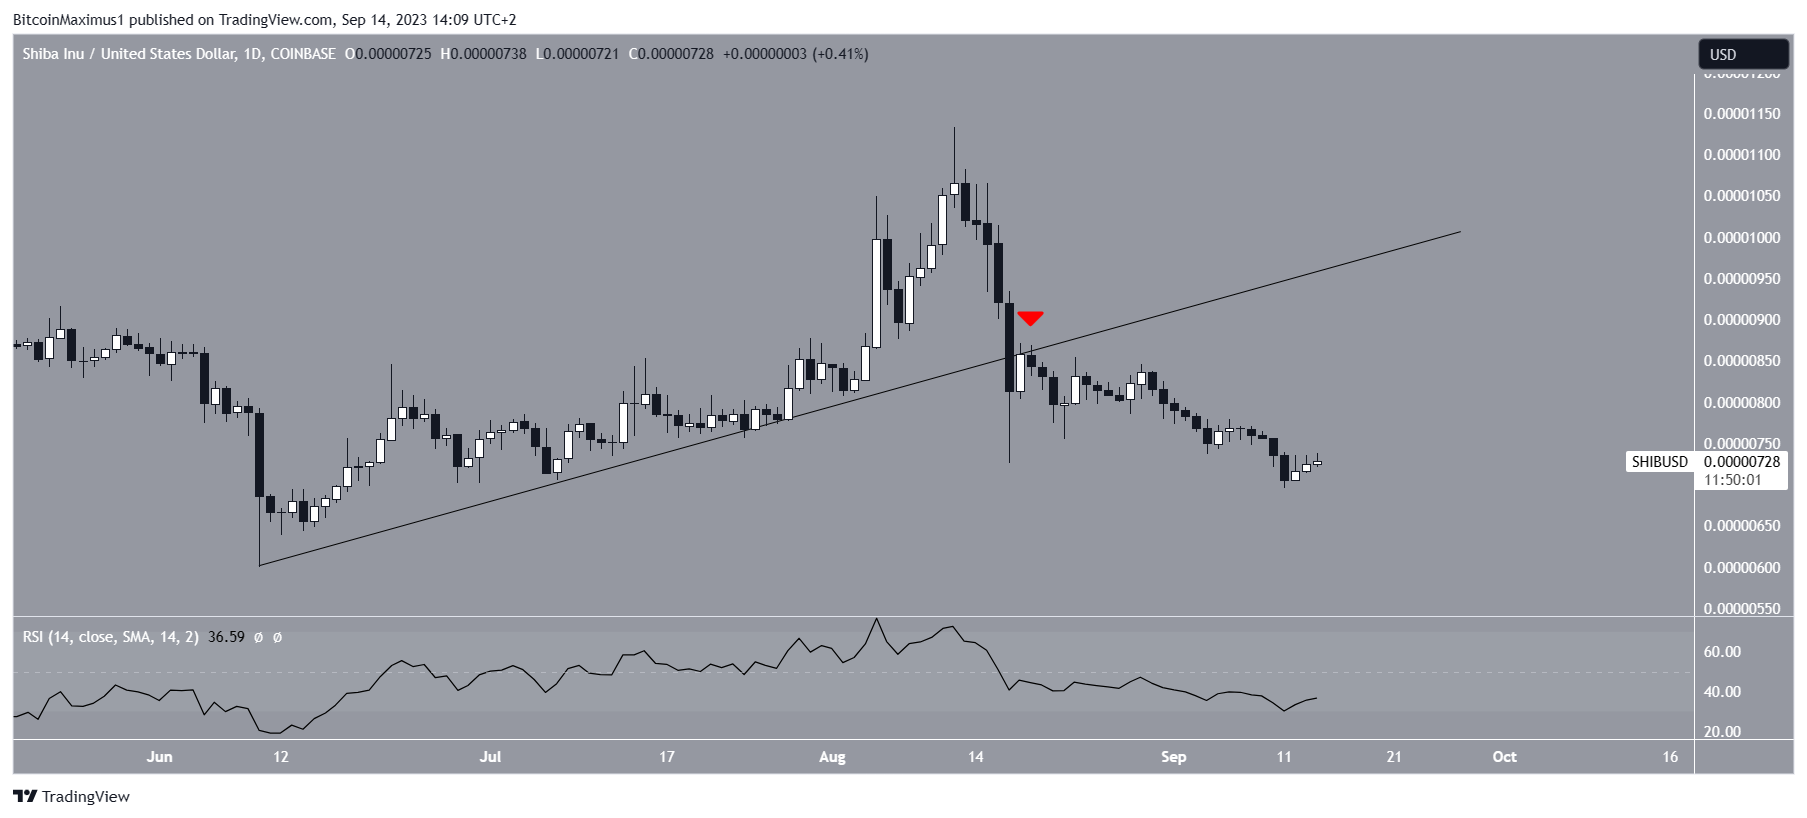
SHIB Price Prediction: Price Loses Support, Resumes Downtrend
The data on the daily timeframe also indicates a bearish trend, primarily seen in the Shiba Inu price action. This is evident as the Shiba Inu price dropped below an ascending support line that had been in place since June.
On August 17, the meme coin broke below this line and confirmed it as resistance the following day (red icon). Since then, the SHIB price has declined, forming several lower highs.
Furthermore, the daily Relative Strength Index (RSI) signals bearishness as it falls and currently sits below the 50 mark. Additionally, there have been no signs of bullish divergence in the RSI.
Considering these bearish indicators, the most likely future prediction for SHIB‘s price suggests a decline to the previously mentioned long-term support level at $0.0000060.
However, it’s important to note that if SHIB manages to reclaim the $0.0000080 level, it will signify a continuation of the bullish trend and invalidate the previous breakdown.
In such a scenario, the SHIB price could potentially rise to the descending resistance line at $0.000010, representing a 32% increase from the current price.
Check Out the 9 Best AI Crypto Trading Bots to Maximize Your Profits
For BeInCrypto’s latest crypto market analysis, click here.


