


After breaking down from a multi-year trendline, Tezos (XTZ) has yet to generate any signs of a potential bullish reversal.
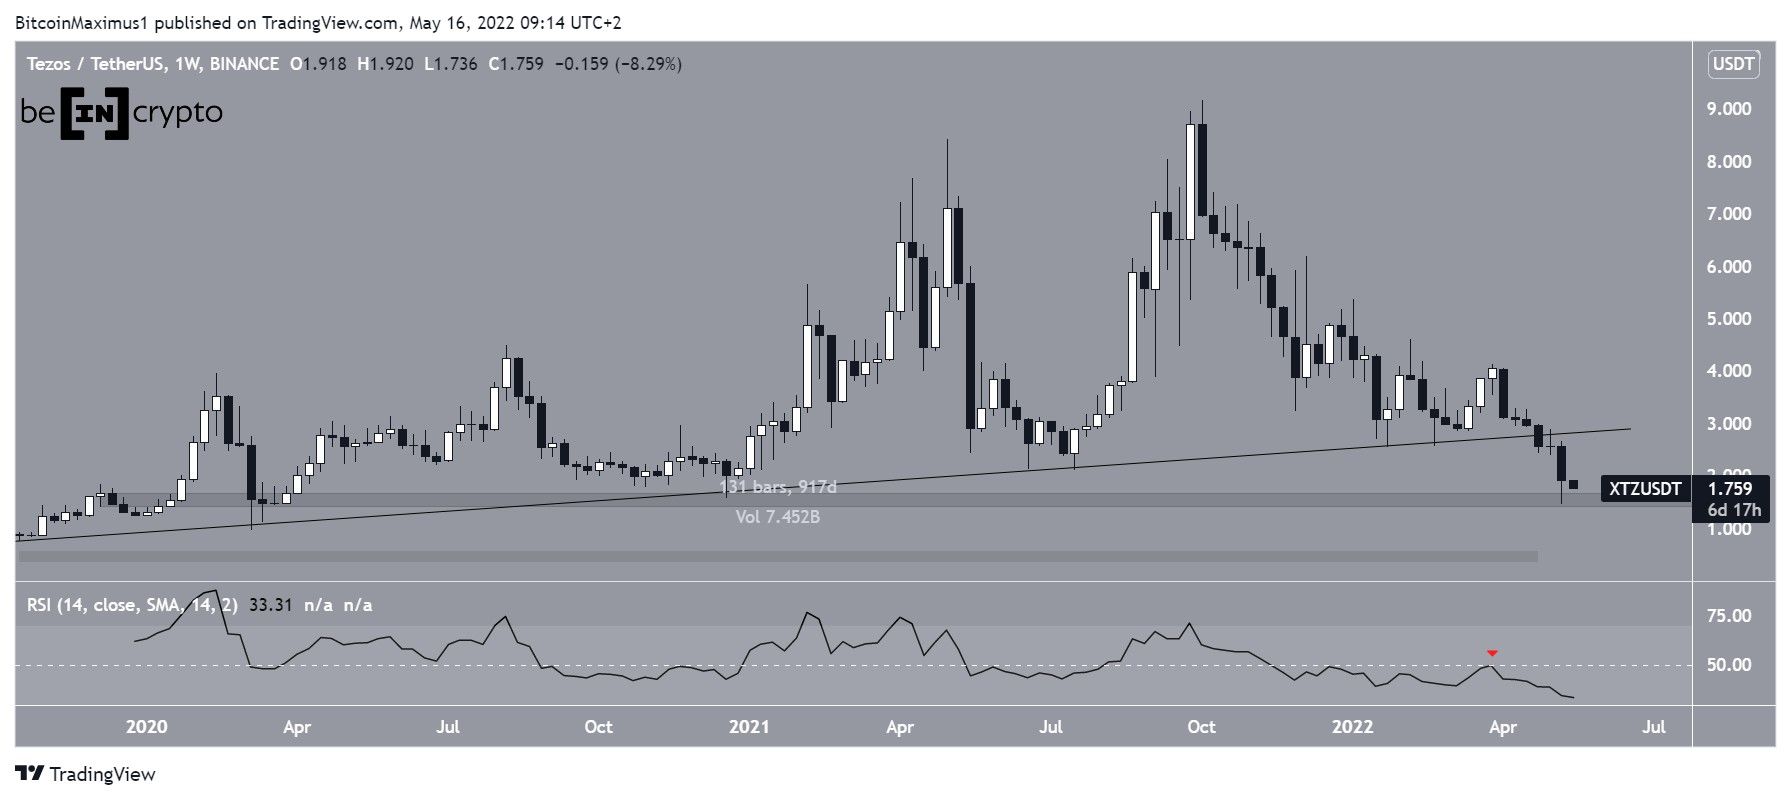
XTZ had been increasing alongside an ascending support line since Oct 2019, when the price was trading close to $0.85.
In July 2021, the price bounced above the support line and greatly accelerated the rate of its increase. This led to a new all-time high price of $9.10.
Since then, XTZ has been falling at a rapid pace. After initially bouncing at the support line, it finally broke down on April 24. Prior to the breakdown, the support line had been in place for 917 days.
The breakdown was preceded by an RSI rejection (red icon) from the 50 line, which is a sign of a bearish trend.
So far, it has reached a low of $1.45, doing so on May 12. The ensuing bounce validated the $1.55 horizontal area as support.
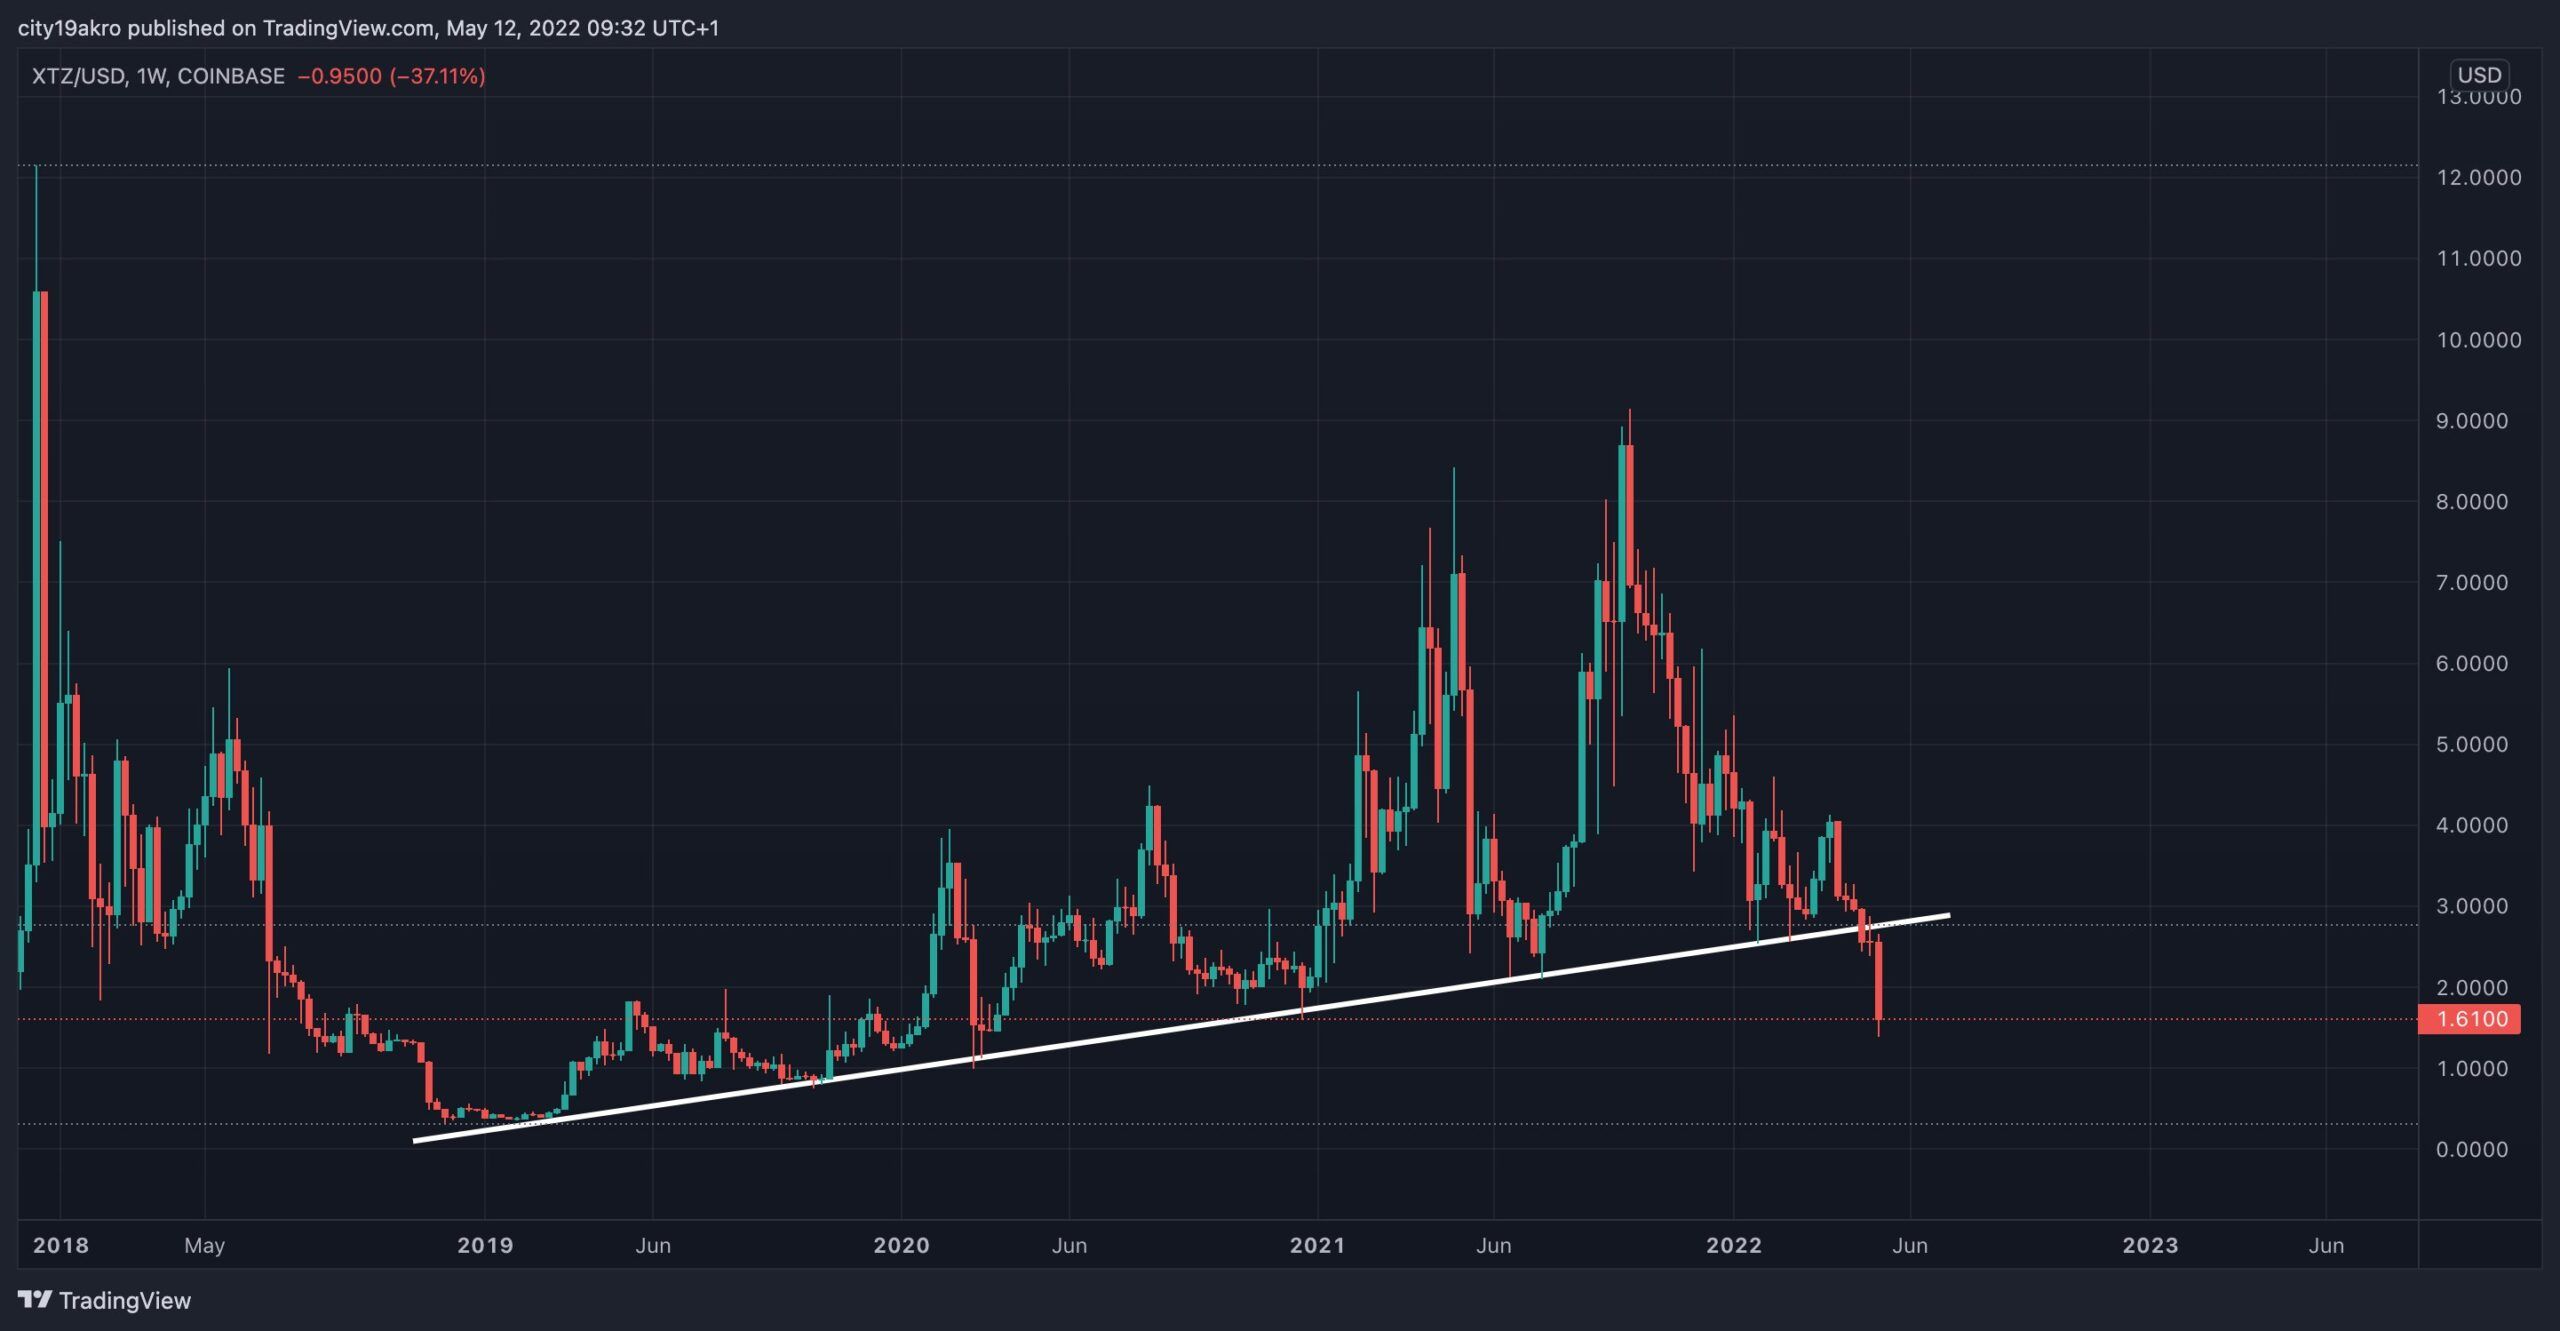
Cryptocurrency trader @CryptosStack tweeted a chart of XTZ which shows a break of a multi-year trendline. As outlined above, the line had been in place for nearly three years prior to the breakdown.
All-time low RSI
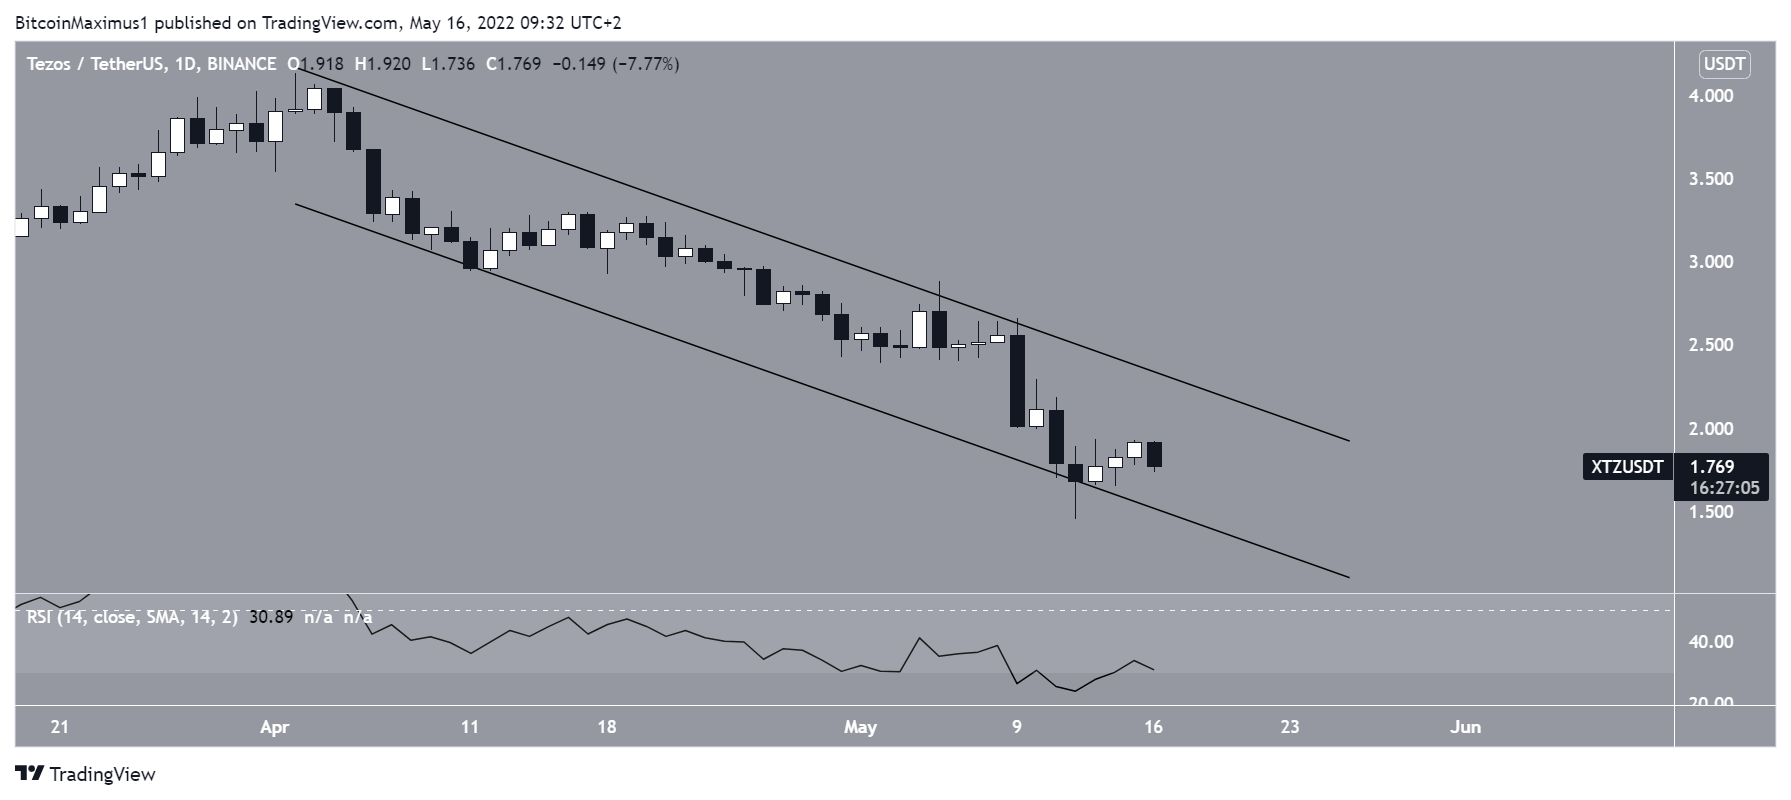
The daily chart shows that XTZ has been falling inside a descending parallel channel since the beginning of April. Such channels are considered corrective patterns, meaning that a breakout from the would be the most likely scenario.
On May 12, the daily RSI reached a low of 24. This is an all-time low value and coincided with a bounce at the support line of the channel. However, there is no bullish divergence in place, which would suggest that an upward movement is expected. Furthermore, the price is currently trading in the lower portion of the channel.
Short-term XTZ movement
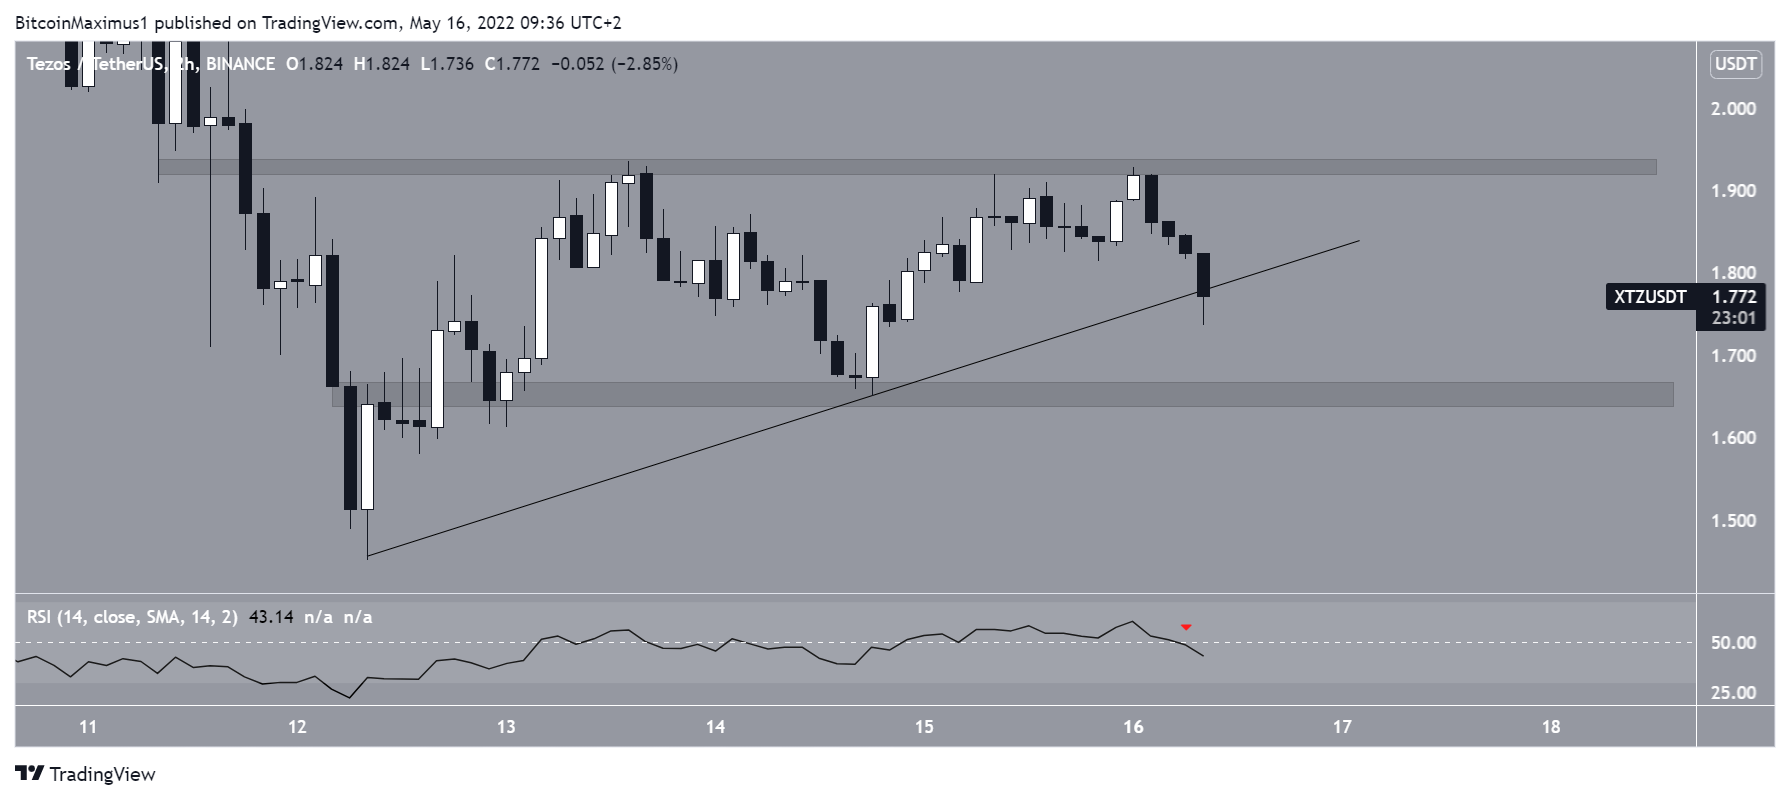
Finally, the two-hour chart shows that the price is very close to breaking down from an ascending support line which has been in place since May 12. This potential breakdown is combined with an RSI drop below 50 (red icon).
If a breakdown occurs, the closest support area would be at $1.65.
Conversely, there is resistance at $1.95 in the case of a potential upward movement.
Nevertheless, there are no signs currently that would suggest a breakout attempt is likely.
For Be[in]Crypto’s latest Bitcoin (BTC) analysis, click here


