


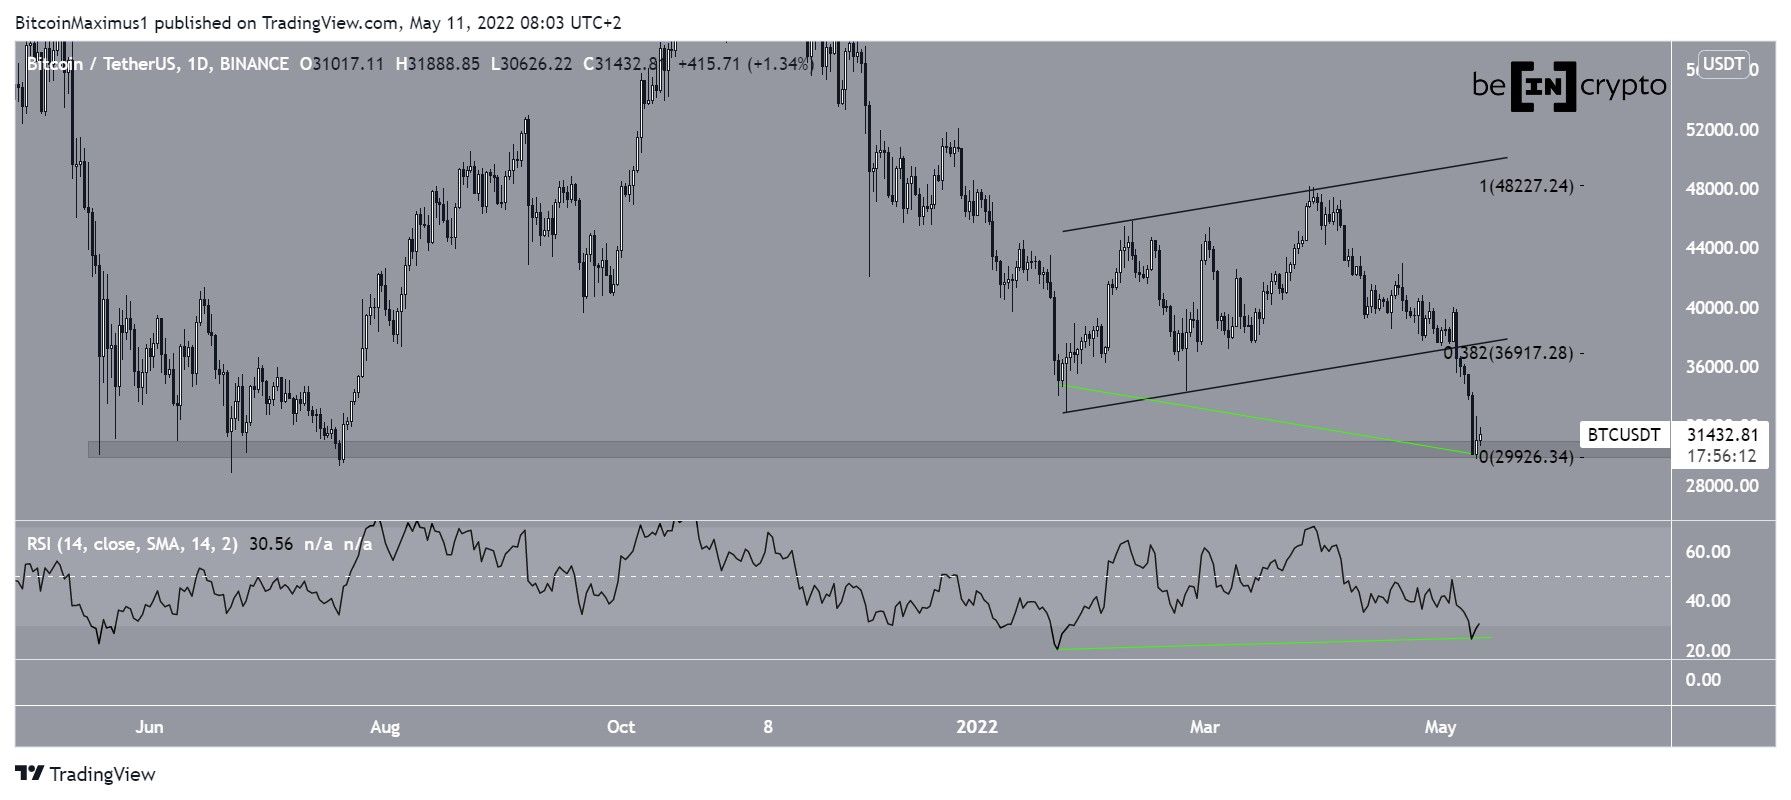
Bitcoin (BTC) has increased slightly since its May 10 fall below $30,000 and has created its first short-term higher low.
Bitcoin had been increasing inside an ascending parallel channel since Jan. 21. After consolidating inside it for nearly five months, the price finally broke down on May 5. It proceeded to reach a 2022 low of $29,730 on May 10.
The low was made inside the $30,500 horizontal support area, after which the price rebounded.
There is a potential bullish divergence that has developed in the daily RSI, though it’s not yet confirmed.
If the divergence acts as the catalyst for an upward boost, the closest resistance area would be found at $36,900. This target is the 0.382 Fib retracement resistance level when measuring the entire drop. Moreover, it’s the support line of the aforementioned channel.
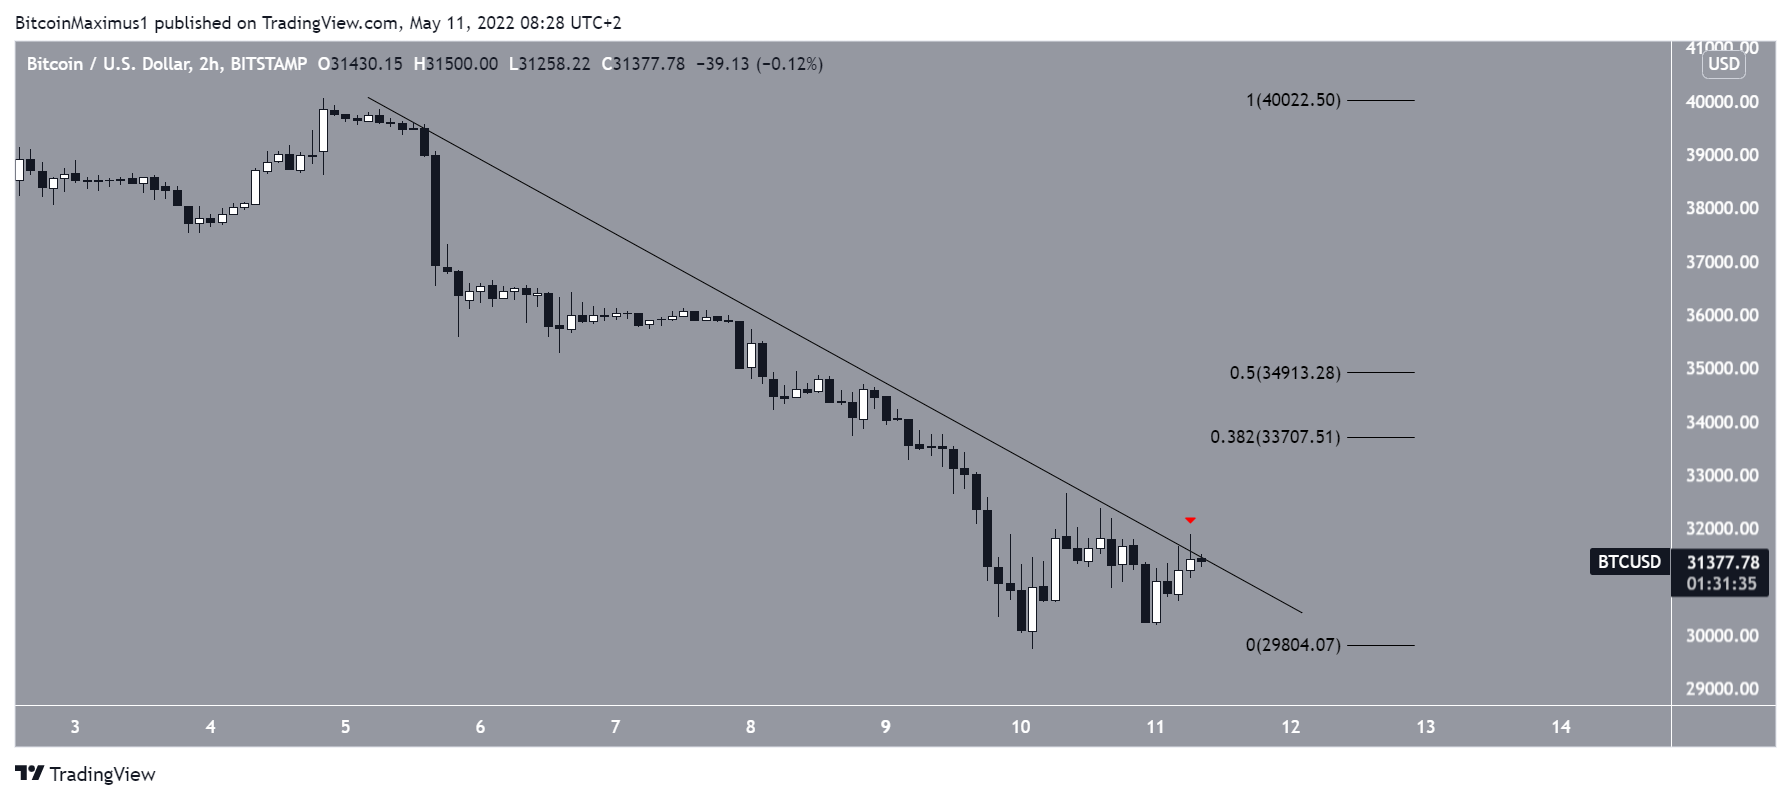
Short-term movement
The two-hour chart shows that BTC has been trading under a descending resistance line since May 6. The line has been validated several times, most recently on May 11 (red icon).
If a breakout occurs, the main resistance area would likely be found between $33,700 and $34,900. This target range corresponds with the 0.382 and 0.5 Fib retracement resistance levels.
The two-hour RSI has already broken out from its descending resistance line, so it’s possible that the price will soon follow.
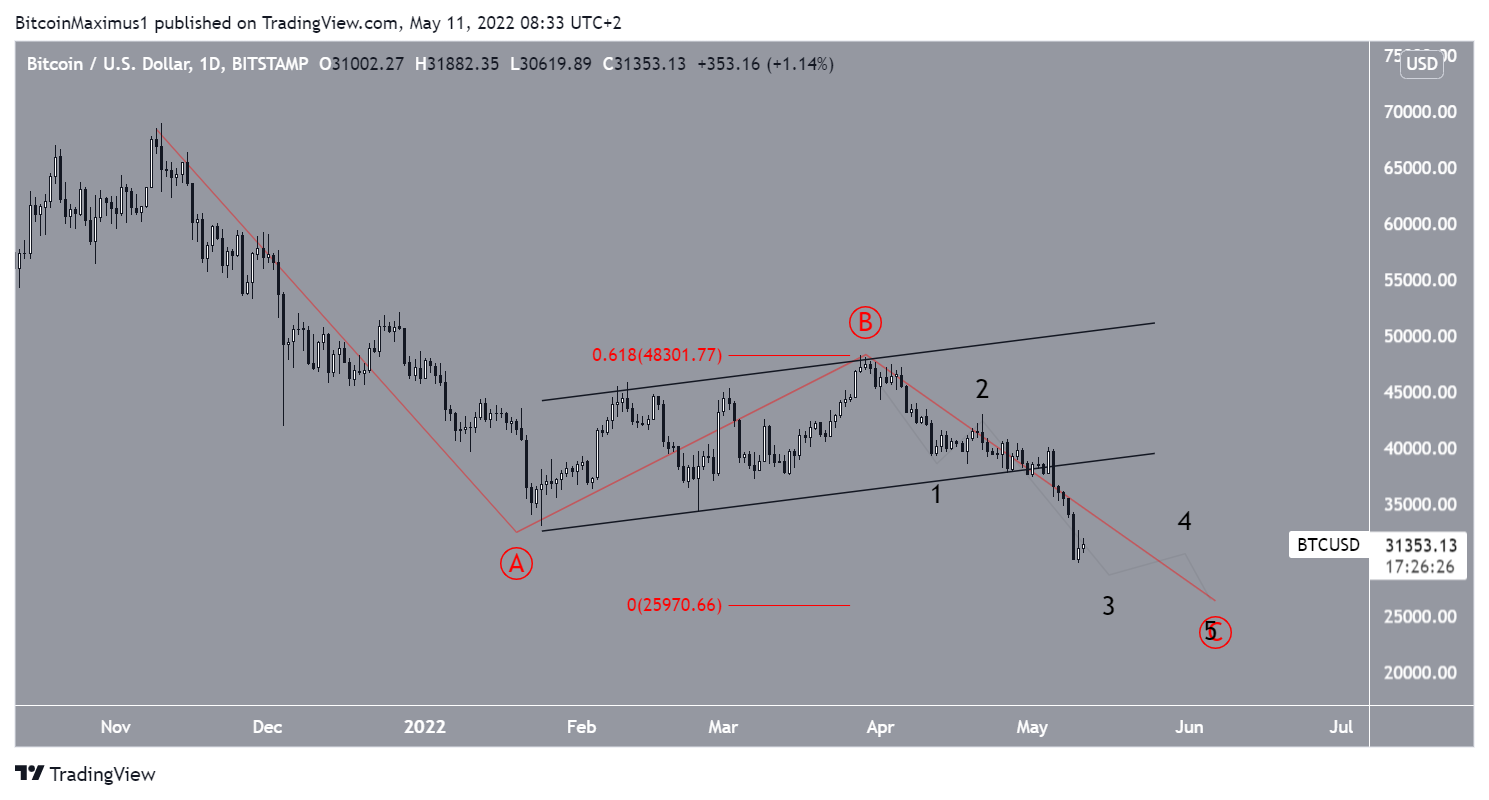
Wave count analysis
The most likely wave count suggests that since the $69,000 all-time high price reached on Nov. 10, 2021, BTC has been correcting inside an A-B-C corrective structure (red). In the chart below, the sub-wave count is shown in black.
The first potential target for the bottom of the entire correction is found at $25,700. This target would give waves A and C a 1:0.61 ratio.
For BeInCrypto’s previous Bitcoin (BTC) analysis, click here


