


The SXP price showed signs of a bullish trend reversal when it broke out from a nearly two-year-long resistance line at the beginning of March 2023.
However, the price failed to sustain its increase and has fallen since reaching a new yearly high in April. The price trades within a horizontal range and shows mixed signs in multiple time frames.
SXP Price Trades in Long-Term Horizontal Range
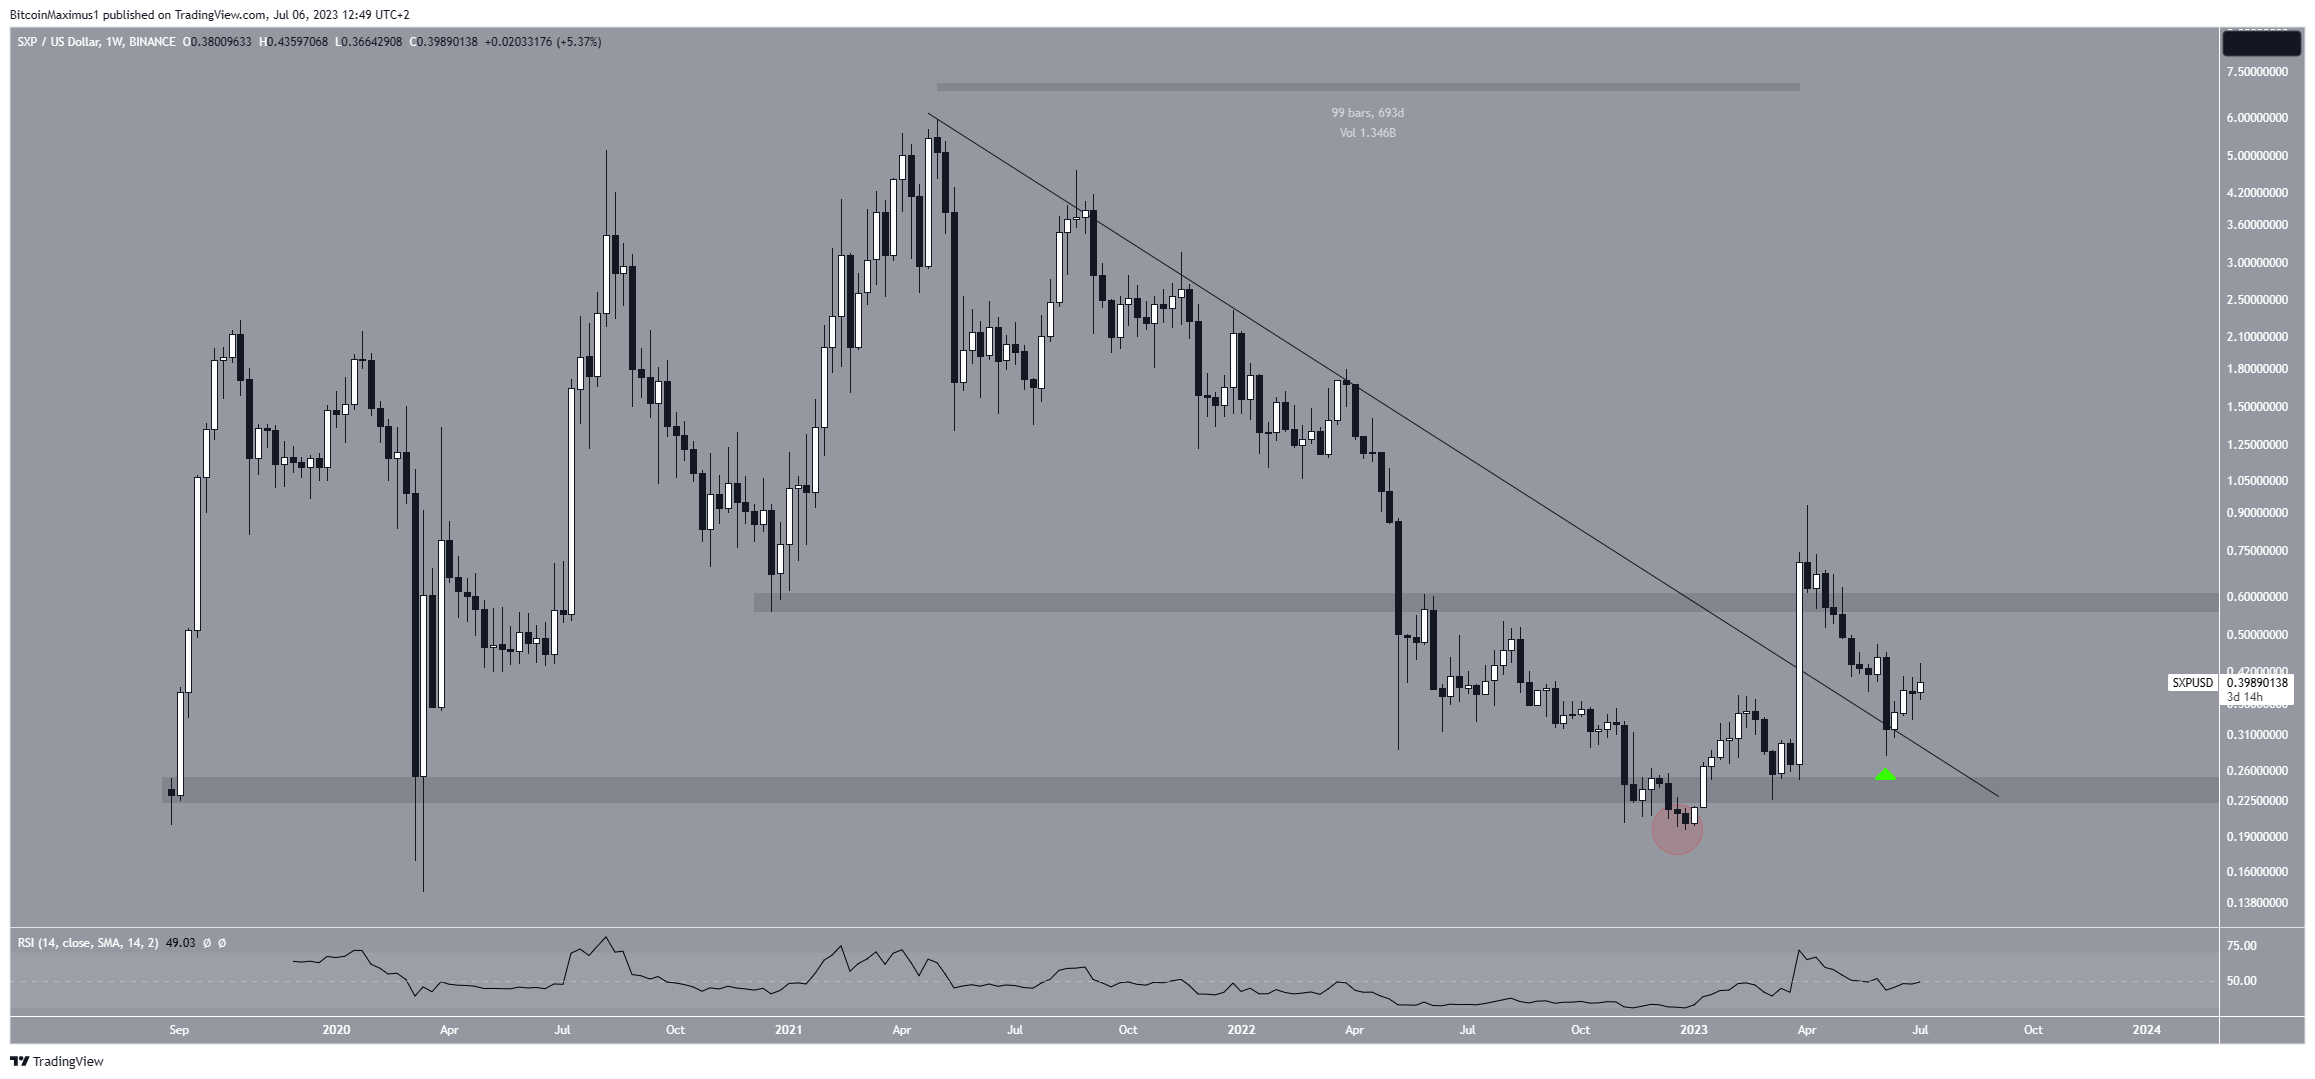
The SXP price had fallen under a descending resistance line since reaching a high of $5.97 in May 2021. The decrease led to a low of $0.19 in December 2022. The value was very close to a new all-time low.
At the time, the SXP price seems to break down below the $0.24 horizontal area, which is the final support before an all-time low. However, the price immediately reversed the trend, suggesting that the breakout was invalid. Thus, the previous decrease was just a deviation (red circle).
The price broke out from the descending resistance line at the beginning of March 2023. At the time of the breakout, the line had been in place for 693 days. Breakouts from such long-term structures often lead to sharp upward movements. This was the case in SXP, which reached a new yearly high of $0.93 in April.
But, the upward movement could not be sustained. SXP fell and validated the resistance line as support in June. Now, it is trading in a range between $0.24 and $0.60.
The weekly RSI does not help in determining the future trend’s direction. When evaluating market conditions, traders use the RSI as a momentum indicator to determine if a market is overbought or oversold and to decide whether to accumulate or sell an asset.
If the RSI reading is above 50 and the trend is upward, bulls still have an advantage, but if the reading is below 50, the opposite is true. The RSI is currently right at the 50 line, indicating an undetermined trend.
Read More: 9 Best Crypto Demo Accounts For Trading
Is SXP Price Bullish or Bearish?
The daily time frame analysis does not confirm the direction of the trend since it also provides mixed signals.
The SXP price has followed an ascending support line since the beginning of the year. As a result, the trend can be considered bullish as long as SXP trades above it. More recently, SXP bounced on June 10 (green icon).
Despite the bounce, SXP failed to clear the minor resistance at $0.40. Rather, it created a long upper wick (red icon), considered a sign of selling pressure.
Similarly to the weekly RSI, the daily one is very close to the 50 line, indicating an undetermined trend.
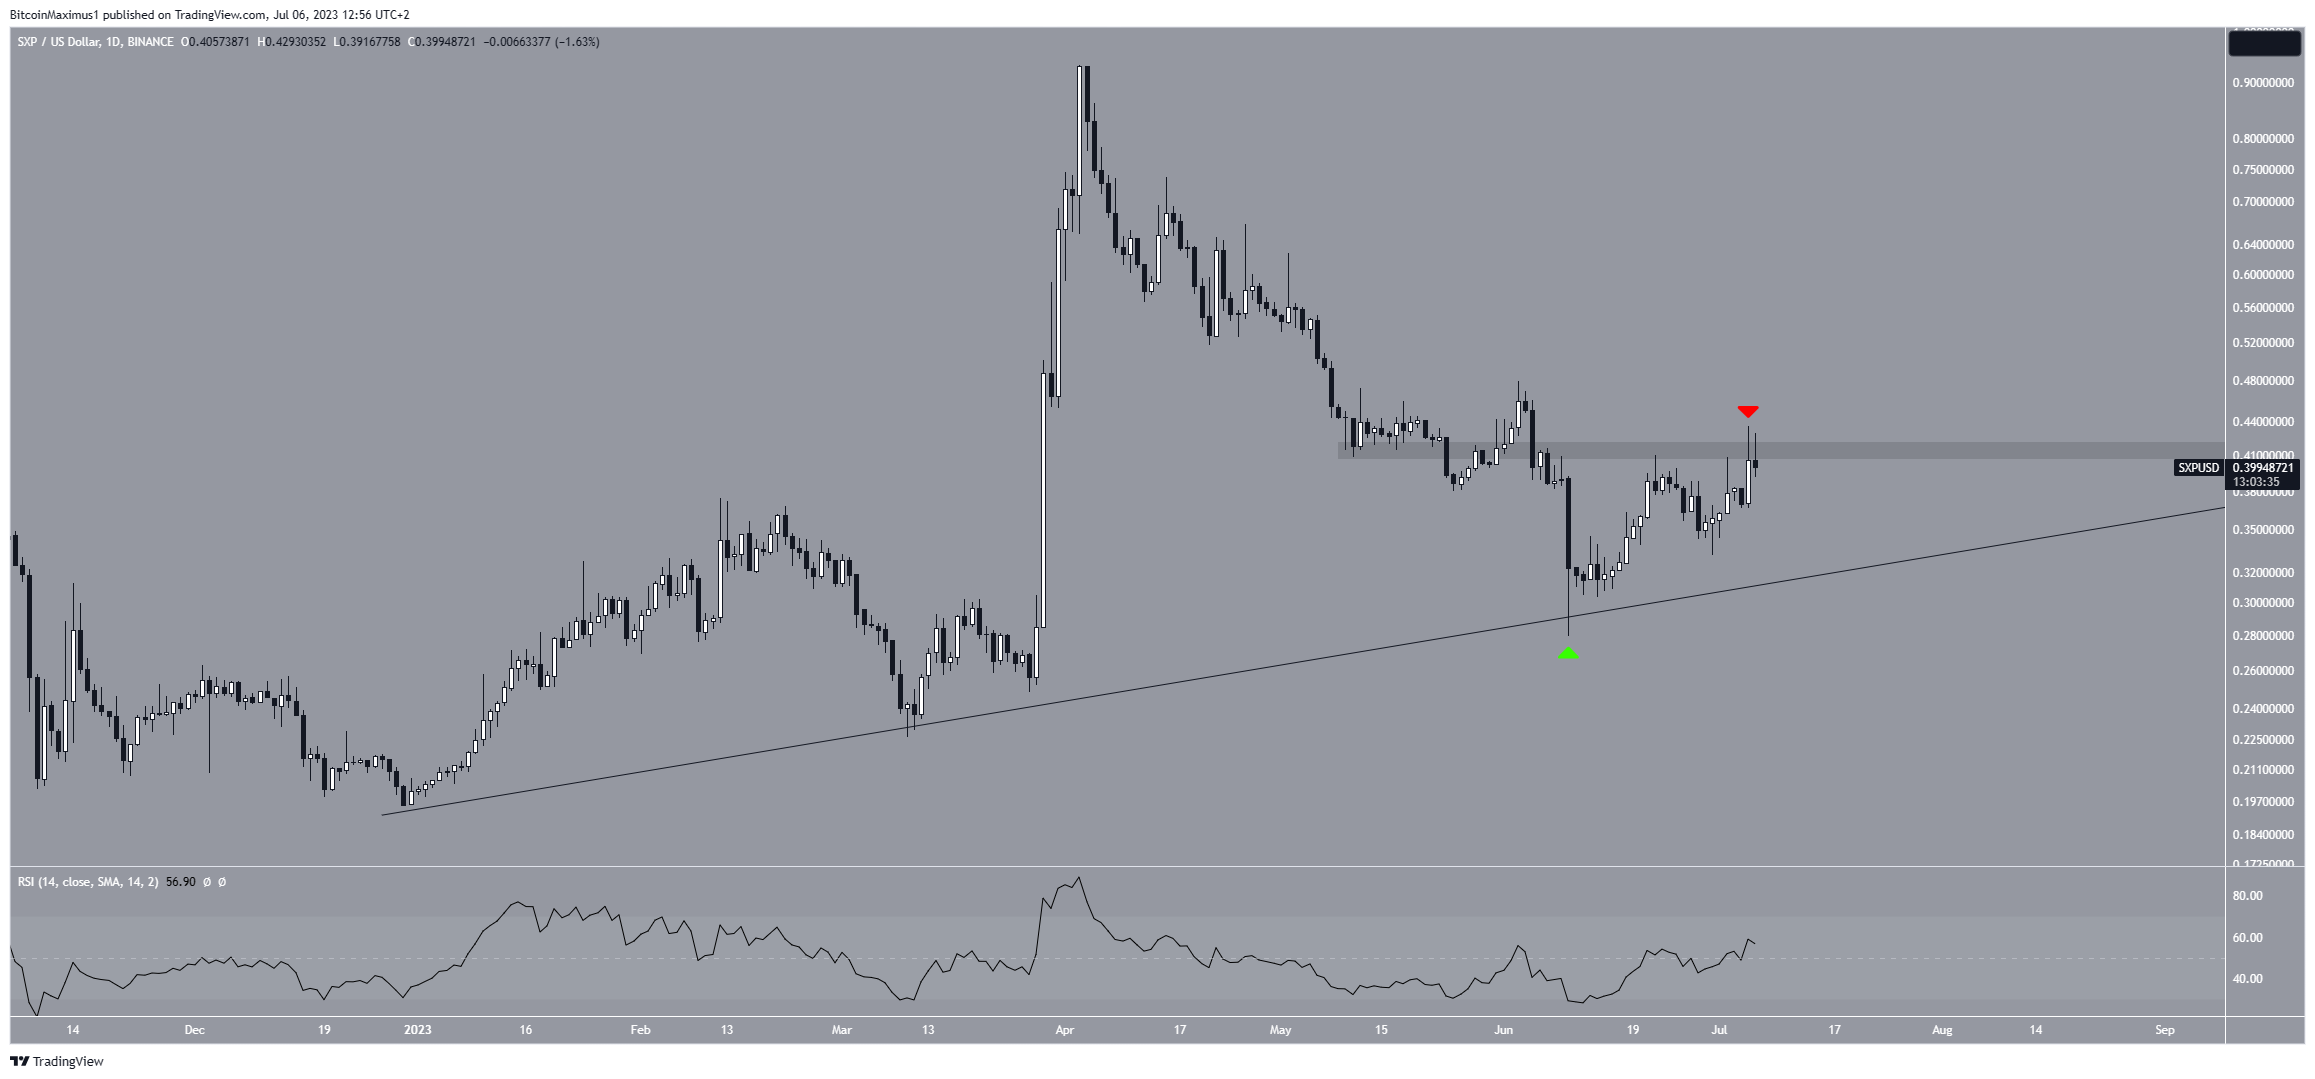
The reaction to the current ascending support line will likely determine the future SXP price prediction. A strong bounce can lead to a retest of the $0.60 resistance area, while a breakdown will likely lead to a drop and touch of the $0.25 horizontal support.
More From BeInCrypto: 9 Best AI Crypto Trading Bots to Maximize Your Profits



