


Stellar’s (XLM) price has decreased since its yearly high in July and is gradually approaching the main support area at $0.105.
The daily timeframe price action supports the decrease since it shows a breakdown from a continuation pattern in place for the last month.
Stellar Price Falls After Yearly High
The technical analysis weekly time frame shows that the XLM price broke out from a 616-day resistance line in January. Breakouts from such long-term structures indicate that the previous trend has ended and a new one has begun in the other direction.
The XLM price initially struggled to move above the $0.105 resistance area. However, it created a higher low in June and accelerated its rate of increase afterward.
XLM cleared the $0.105 resistance and increased to a new yearly high of $0.195 in July. However, it has been mired downward since, creating three consecutive bearish weekly candlesticks.
XLM is in the process of creating the fourth such candlestick, which could accelerate the drop to the $0.105 area, now expected to provide support.
The main resistance area at $0.230 is 70% above the current price, while the $0.105 support area is 22% below it.
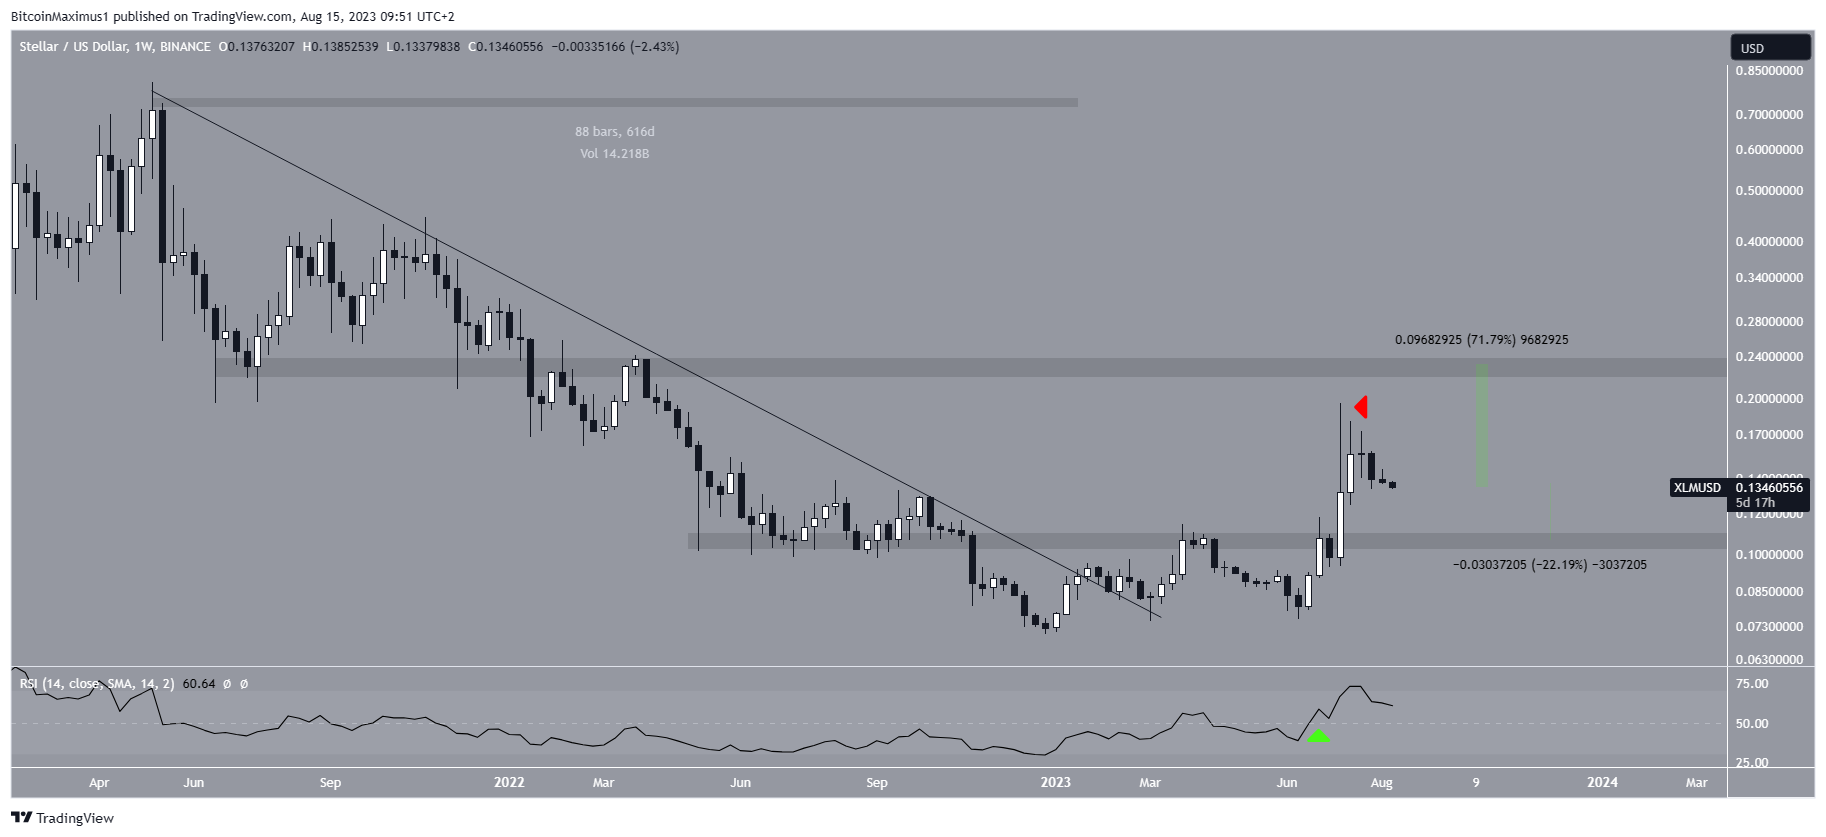
The weekly RSI provides an inconclusive result. Traders use the RSI as a momentum gauge to assess if a market is excessively bought or sold, aiding their decisions to acquire or sell an asset.
When the reading surpasses 50 along with an ascending pattern, it implies the bullish stance persists. Conversely, readings below 50 signal the opposite sentiment.
Despite a declining RSI, the indicator remains higher than 50. These contradictory indications do not verify the direction of the trend.
XLM Price Prediction: Will Breakdown Lead to Retracement?
A closer look at the daily timeframe analysis suggests the price will continue falling. The main reason for this is that XLM broke down from a symmetrical triangle three days ago. The symmetrical triangle is considered a neutral pattern.
However, since it transpires after an upward movement, it was expected to continue and lead to a breakout.
Despite this likely outlook, XLM broke down from the triangle and has fallen during the past three days. XLM is now slightly above the $0.130 minor support area.
The daily RSI supports the validity of the breakdown. The indicator just decreased below 50 (red icon) and is falling.
So, if the XLM price breaks down below $0.130, it can fall to the next support at $0.110. This would be a drop of 20% measured from the current price. The area will also coincide with the long-term support previously outlined at $0.105.
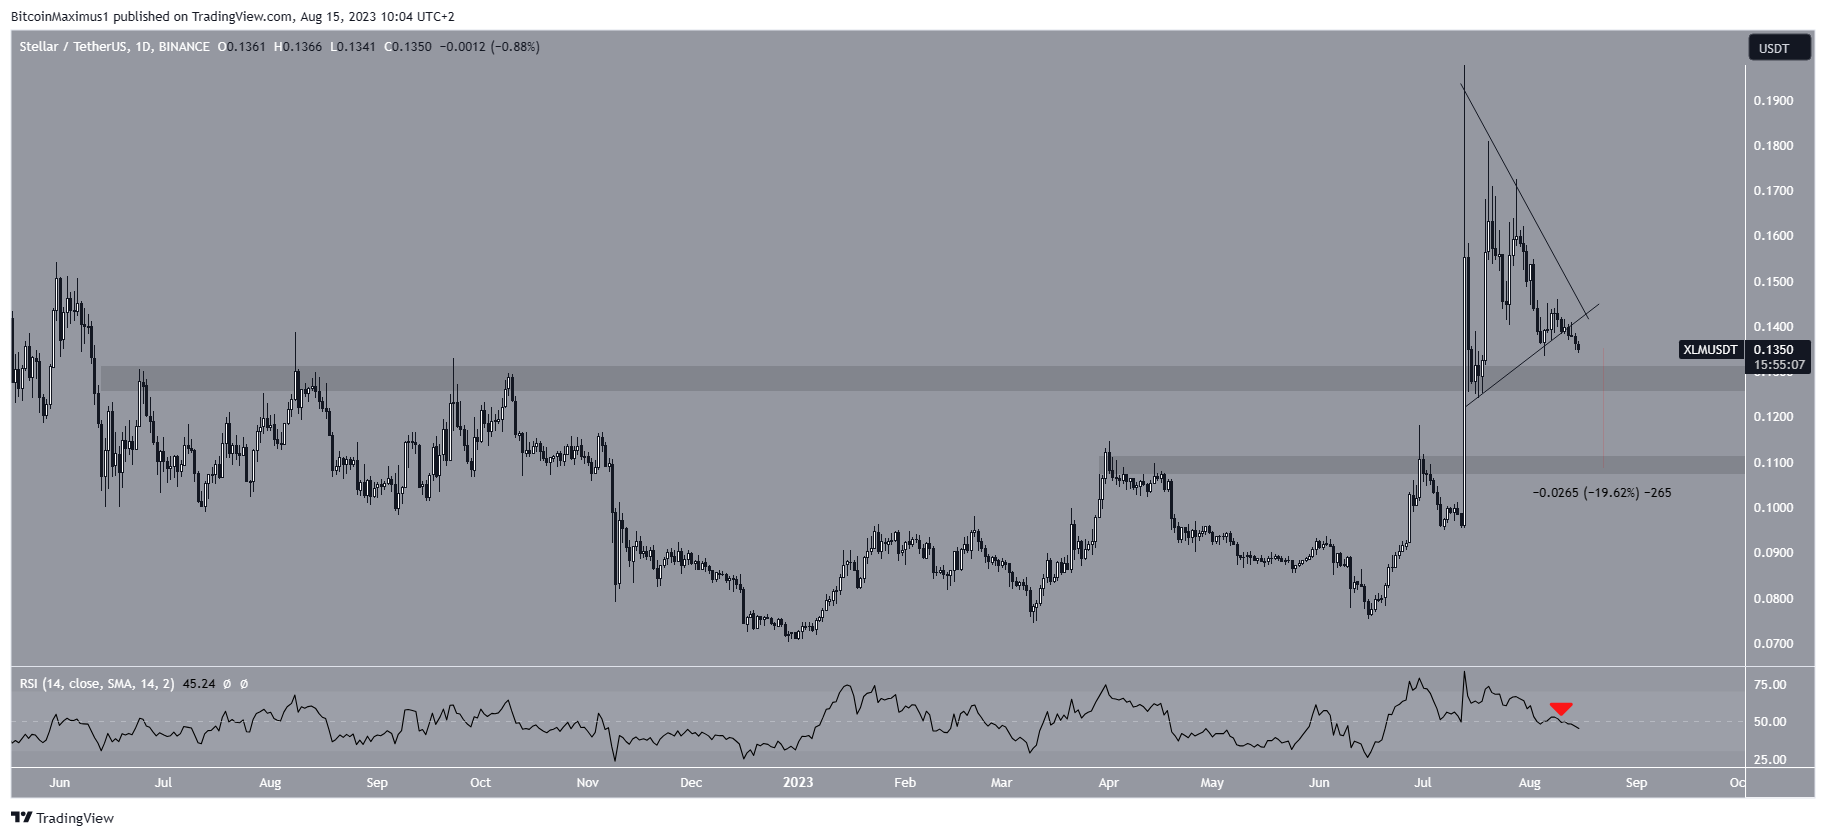
Despite this bearish XLM price prediction, a breakout from the triangle’s resistance line will mean the short-term trend is bullish. In that case, a 70% increase to the $0.230 resistance area will likely be the future outlook.
Read More: Best Cloud Mining Sites 2023: A Beginners Guide
For BeInCrypto’s latest crypto market analysis, click here.


