

Shiba Inu (SHIB) price has likely completed its relief rally and has now begun the final wave of its corrective structure.
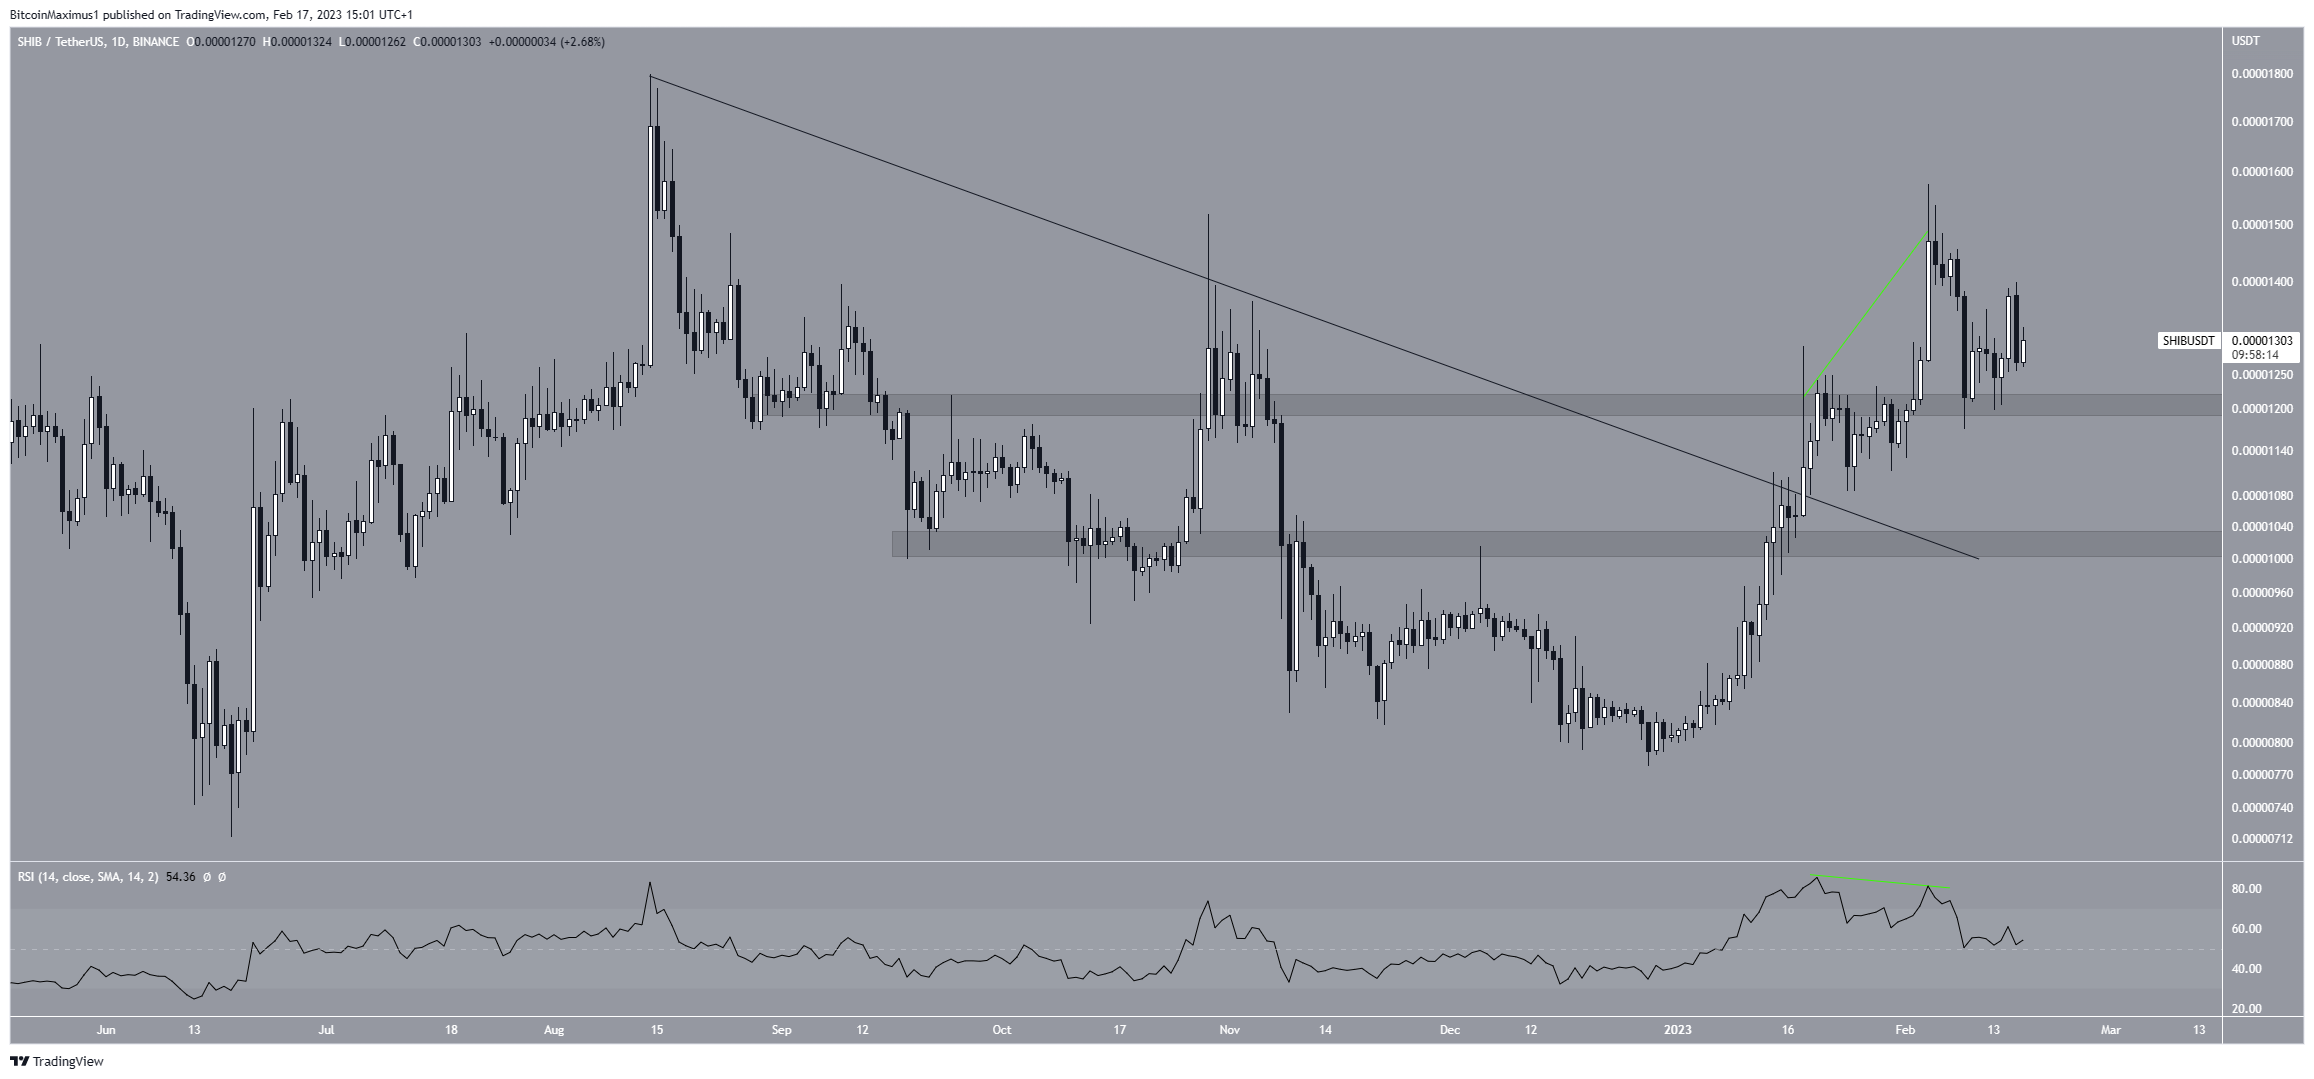
SHIB’s price has fallen since Feb. 4, when it reached a high of $0.0000157. A bearish divergence in the daily RSI preceded the drop (green line).
Following the drop, the price recovered and is now trading slightly above the $0.0000120 support area. This is an important area because it has intermittently served as both resistance and support for the past six months. In addition, the daily RSI is 50, indicating a neutral trend.
As a result, whether the Shiba Inu price closes below $0.0000120 or bounces could determine the direction of the future trend. A close below it may result in a fall toward $0.0000102, while a bounce may result in highs near $0.0000157.
A look at a lower time frame is required to determine which is more likely.
Shiba Inu (SHIB) Price Expected to Resume Fall
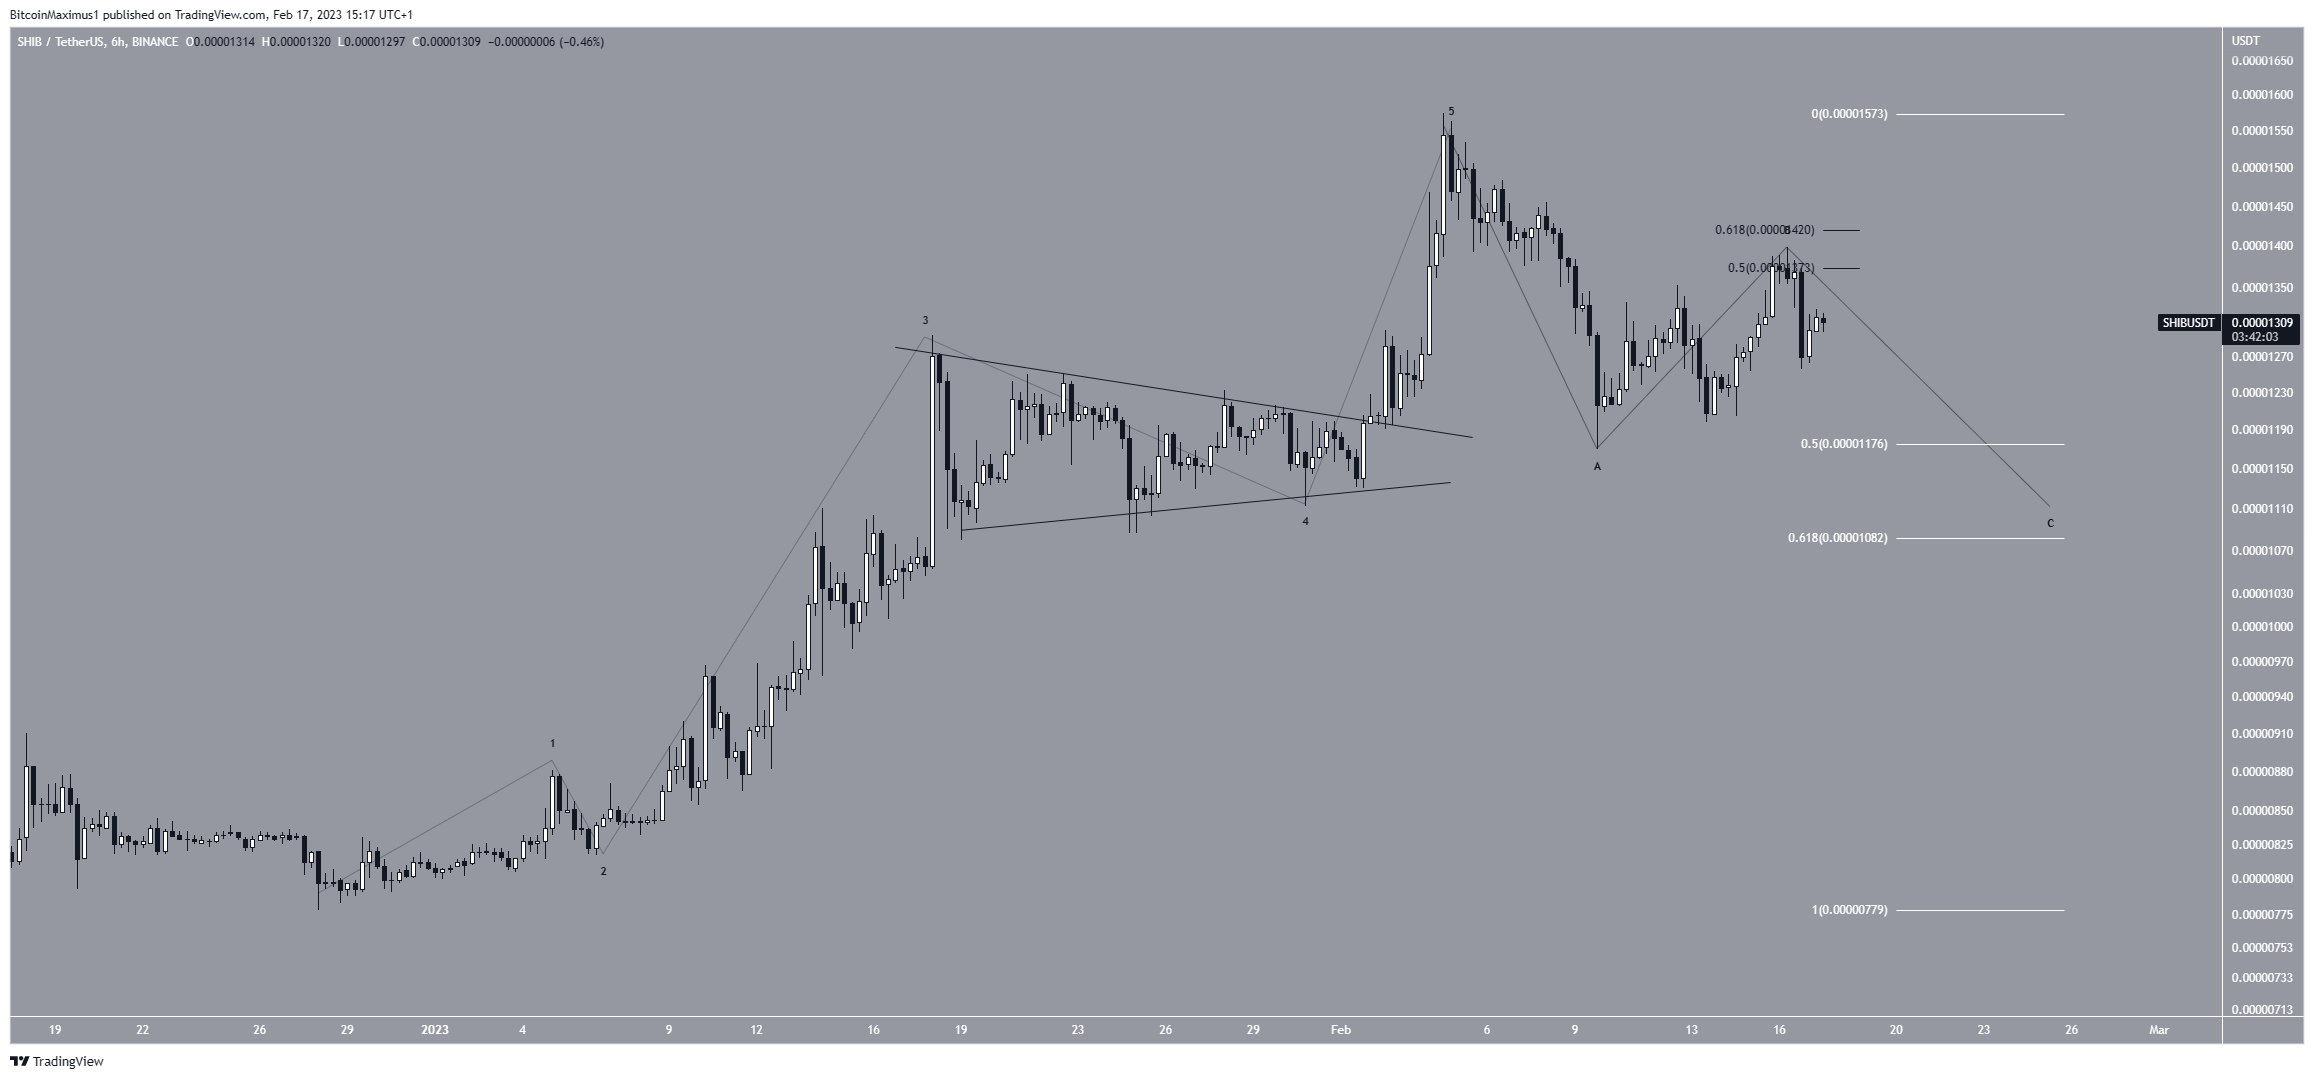
The short-term six-hour time frame technical analysis suggests that the price fall. The Shiba Inu token price completed a five-wave upward movement that led to the $0.0000157 high. The triangle forming wave four and the subsequent sharp decrease distinguishes this wave count.
Following the high, the SHIB price dropped to $0.0000117 before bouncing. The low formed a long lower wick, confirming the 0.5 Fib retracement level as support (white). This is an important support level because it corresponds to the previously defined horizontal support area. So, it was likely the bottom of the corrective A wave.
If the count is correct, the SHIB token price is now trapped in the C wave of an A-B-C corrective structure that could end at $0.0000108, the 0.618 Fib retracement support level. After the correction, the Shiba Inu price could rise to its August 2022 high of $0.0000180.
This bullish Shiba Inu price forecast would be rendered invalid if the price fell below the yearly lows of $0.0000077. In that case, the price of Shiba could fall to $0.0000050.
However, a drop below it would jeopardize the upward movement because of the strong support area at $0.0000102.
Shiba Inu (SHIB) Channel Contains Correction
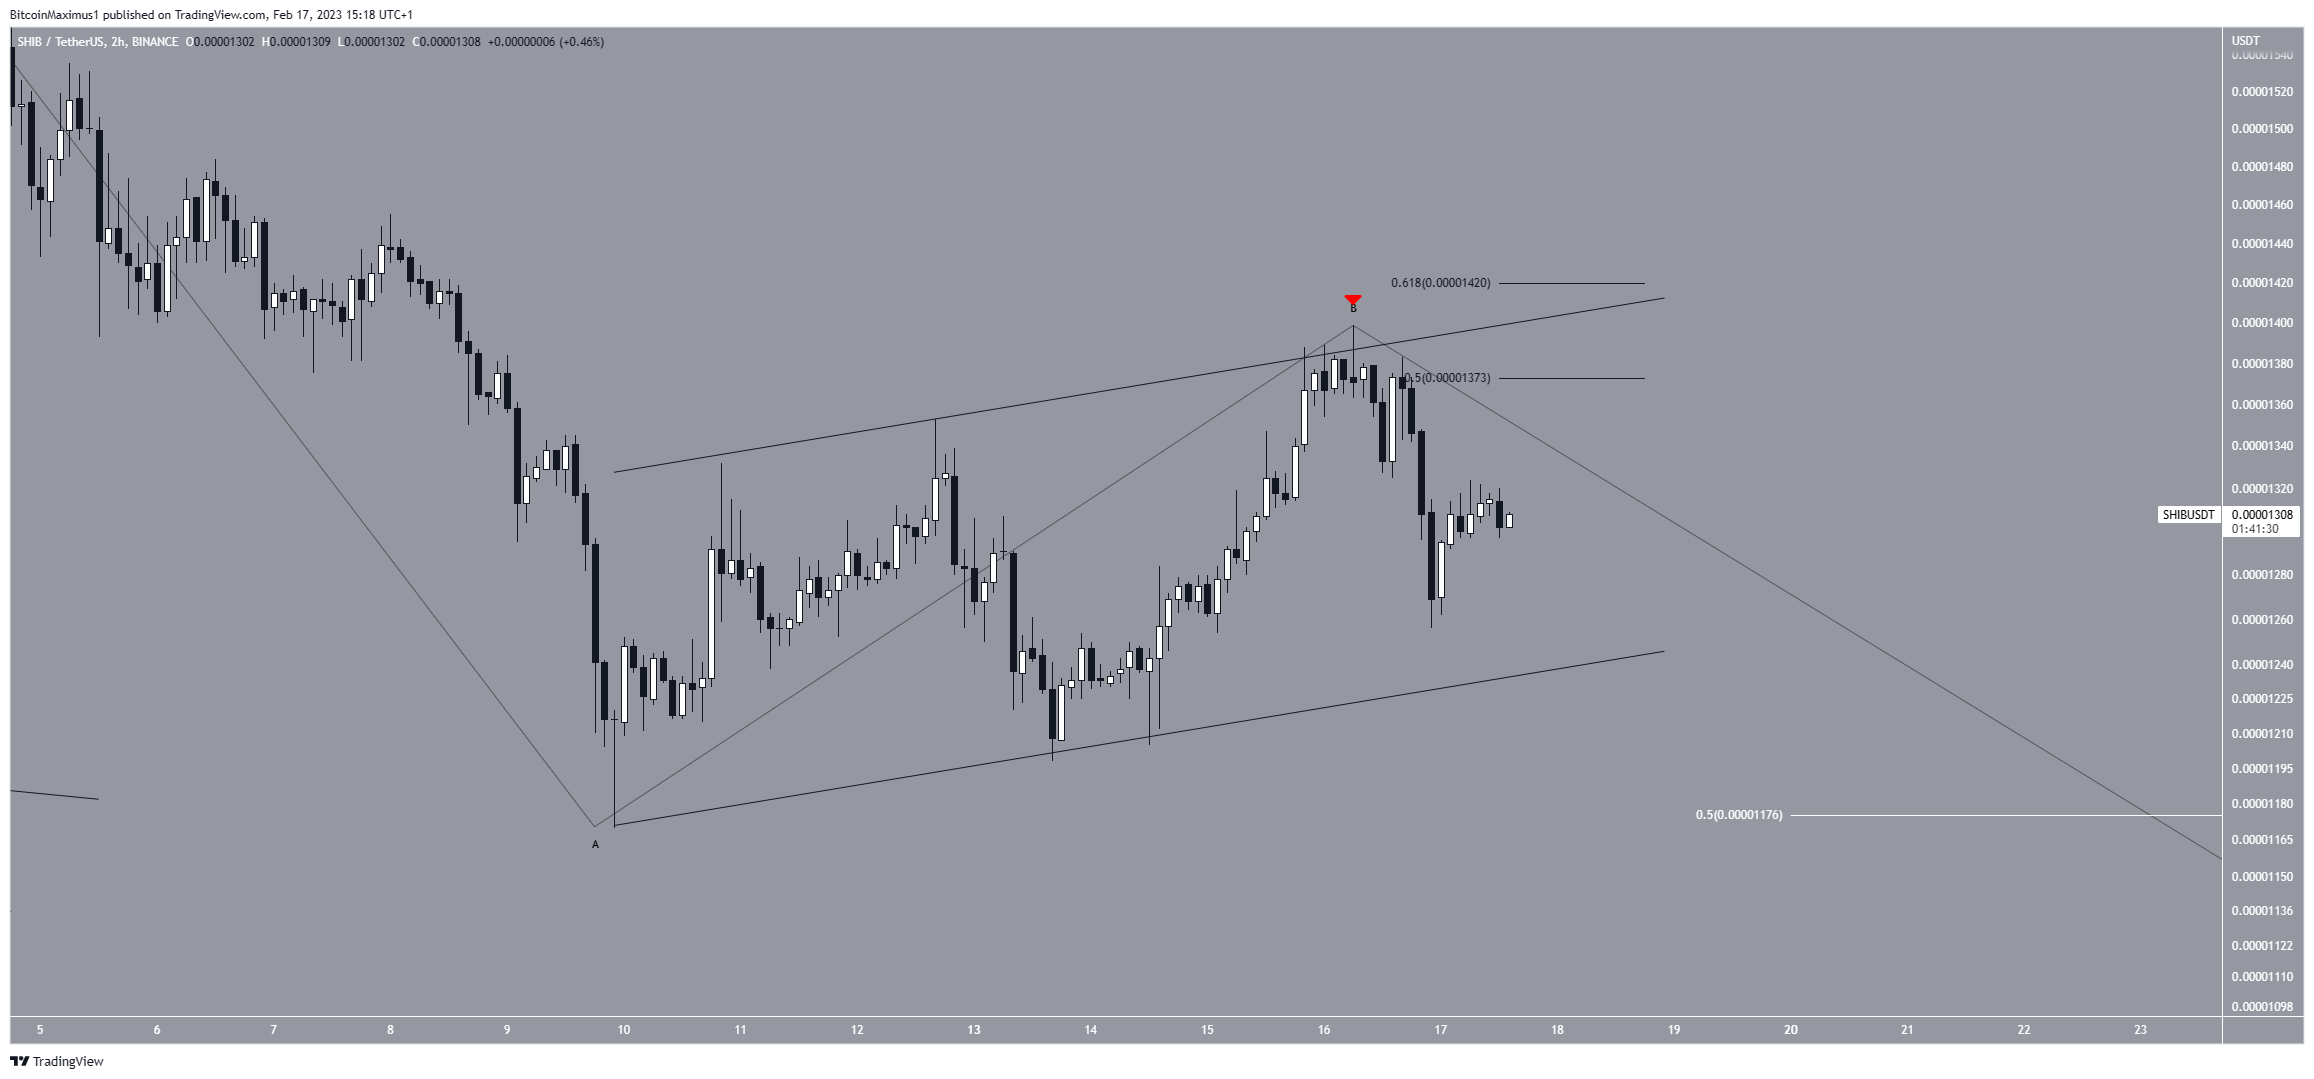
The even shorter-term two-hour chart aligns with this possibility. An ascending parallel channel contains the Shiba Inu coin price movement. Such channels usually contain corrective movements. Therefore, it is likely that the channel contains the B wave.
A breakdown from it would confirm that the C wave has begun and will likely lead to a low of $0.0000108. On the other hand, a breakout from the channel would put the bearish count at risk, while an increase above $0.0000157 would invalidate it and could lead to highs of $0.0000180.
To summarize, the most likely Shiba Inu price forecast is another drop to complete the correction. A move above the yearly high of $0.0000157 would indicate that the correction is complete, potentially leading to highs above $0.0000180.
For BeInCrypto’s latest crypto market analysis, click here.
Trusted
Disclaimer
In line with the Trust Project guidelines, this price analysis article is for informational purposes only and should not be considered financial or investment advice. BeInCrypto is committed to accurate, unbiased reporting, but market conditions are subject to change without notice. Always conduct your own research and consult with a professional before making any financial decisions. Please note that our Terms and Conditions, Privacy Policy, and Disclaimers have been updated.
