


Shiba Inu (SHIB) has not been the beneficiary of the recent memecoin hype that took place in May. The second largest memecoin by market capitalization has been in a downtrend since reaching a local peak of $0.00001575 in February 2023. Can the bullish pattern push the SHIB Price up?
However, currently, Shiba Inu has reached a long-term support area that could initiate a bounce and a potential trend reversal. For this to happen, a rare triple-bottom pattern on the weekly chart and a bullish divergence on the daily RSI must play out.
Shiba Inu Triple Bottom Pattern
The Shiba Inu price reached an all-time high (ATH) of $0.00008854 in November 2021. Since then, it has been decreasing and reached a bottom at $0.00000714 in June 2022.
Over the past year, SHIB has already reached this support area (green) three times. The second time was in December 2022, and the third is happening now. Currently, memecoin is 91% below its ATH and is again approaching the macro bottom from a year ago.
However, a re-visit of the long-term support area is a bullish signal that could potentially trigger a resumption of the uptrend. If support initiates a bounce, a triple-bottom pattern (blue arrows) could play out. It is even more rare as it appears on the weekly chart.
In that case, the nearest target would be $0.00000963, corresponding to the 0.236 Fib retracement level and the horizontal support/resistance line (red). Next, the bulls would like to regain $0.00001080 at the 0.382 Fib retracement.
The principle behind Fibonacci retracement levels suggests that after a significant price movement in one direction, the price retreats or partially returns to the previous level. It then continues to move in the original direction.
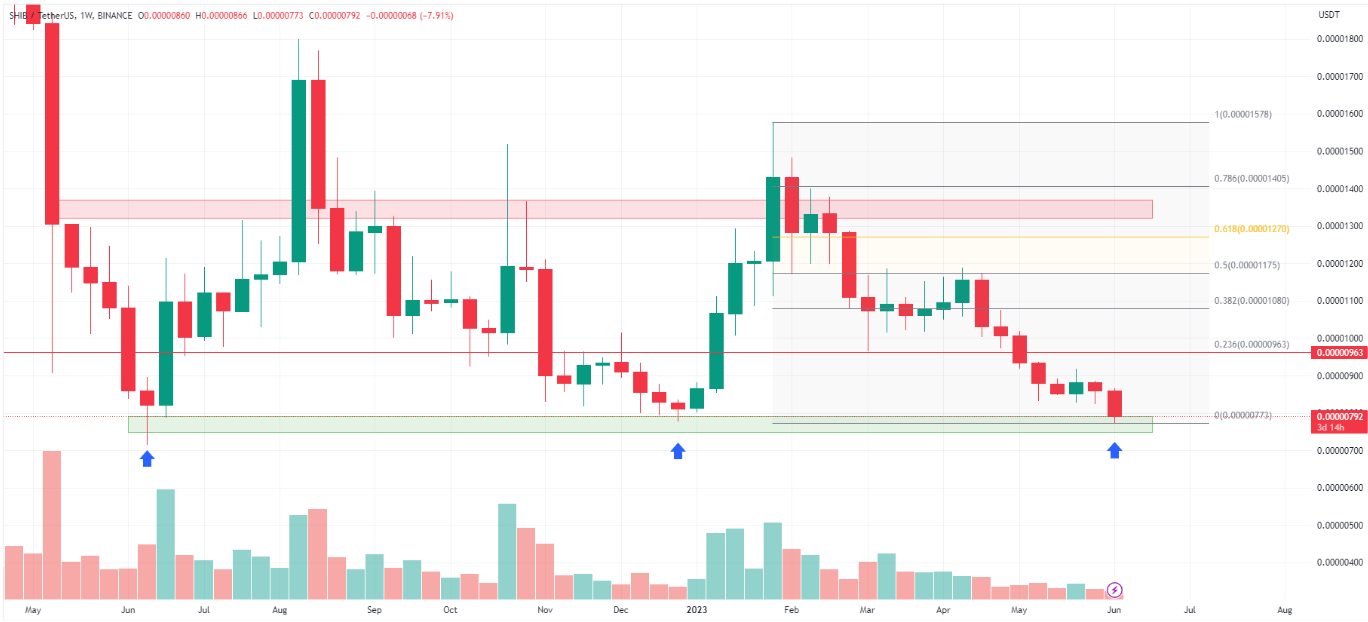
However, if the Shiba Inu price loses this long-term support, it will drop to new cycle lows. Then support can be provided by the closing level of the July 2021 weekly candle at $0.00000630.
More From BeInCrypto: 9 Best AI Crypto Trading Bots to Maximize Your Profits
Bullish divergence on the daily RSI
Analysis of the daily time frame for the Shiba Inu price shows a clear downward trend. It has been ongoing since the local peak at $0.00001575 in early February 2023. Later, the SHIB price generated 3 consecutive lower highs (LH) and 3 lower lows (LL).
The decline of the Shiba Inu price was accompanied by a drop in the Relative Strength Index (RSI). It is currently below the 50 level, confirming the downward trend.
Using the RSI as a momentum indicator, traders can determine whether the market is overbought or oversold. In addition, they decide whether to accumulate or sell assets.
If the RSI reading exceeds 50 and the trend is upward, the bulls have the advantage. The opposite is true when the reading is below 50.
However, between the last two lows, a bullish divergence has appeared on the RSI. This means that despite the SHIB price dropping, the corresponding RSI began to rise (blue lines).
Moreover, the indicator has already managed to generate two instances of this bullish divergence, suggesting that a strong price bounce may be coming.
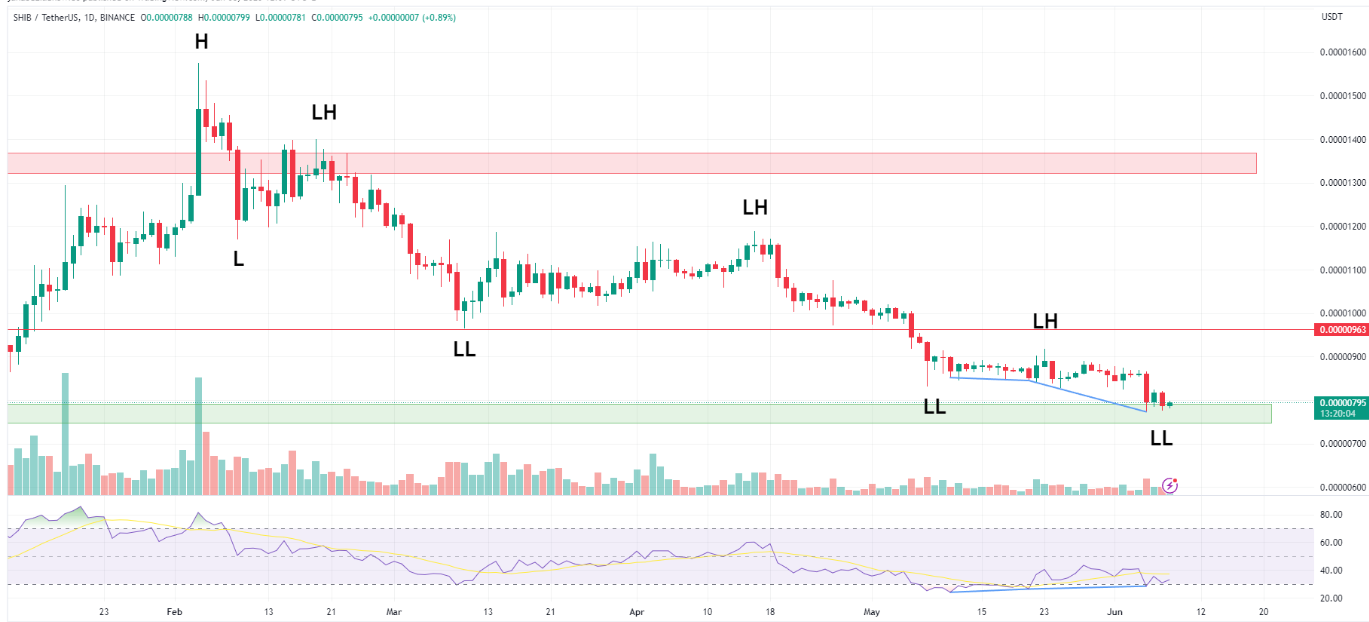
If indeed this Shiba Inu bullish pattern proves accurate, the Shiba Inu price could at least increase to the aforementioned resistance at $0.00000963.
On the one hand, this would be a bearish re-test of the previous breakdown area. On the other hand, the SHIB price would generate the first higher low in 5 months, potentially initiating an uptrend.
Read More: 6 Best Copy Trading Platforms in 2023
For BeInCrypto’s latest crypto market analysis, click here.


