


The Shiba Inu (SHIB) price broke down from a short-term continuation pattern on December 17.
Is the breakdown a sign of things to come, or will the SHIB price recover quickly? Let’s find out!
Shiba Inu Retests Diagonal Resistance
The weekly price action shows that SHIB has been on an upward trajectory since hitting a low of $0.0000054 in June. In November, this upward momentum led to a breakout from a descending resistance trend line that had constrained the price for 480 days. Afterward, SHIB moved above a horizontal resistance area.
However, despite the breakout, SHIB has not experienced a significant surge. Rather, it fell sharply today, validating the descending resistance trend line (green icon).
Nevertheless, more than 12 million SHIB tokens were burned in the past 24 hours. This is an increase of more than 300% relative to the previous day.
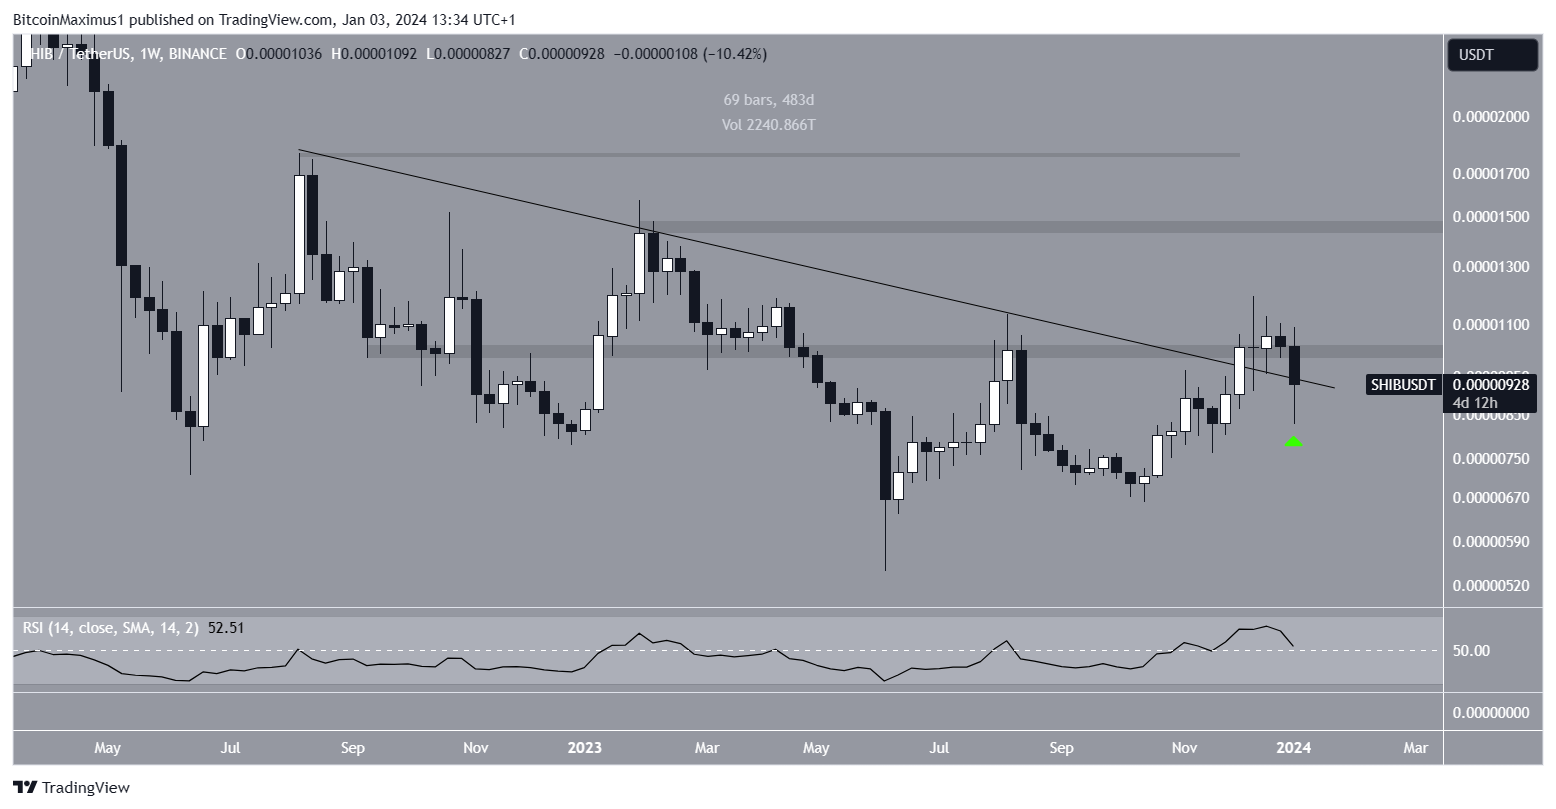
Traders in the market commonly utilize the Relative Strength Index (RSI) to gauge momentum, identify overbought or oversold conditions, and make decisions on asset accumulation or selling.
Readings above 50, especially in an upward trend, signal an advantage for bulls, while readings below 50 indicate the opposite. The RSI moved above 50 concurrently with the price breakout, confirming the legitimacy of the upward movement.
Read More: 11 Best Shiba Inu (SHIB) Wallets in 2023
SHIB Price Prediction: When Will Upward Movement Continue?
While the weekly time frame is neutral, the daily one shows a bearish trend. This is because of the price action and RSI readings.
The price action shows that the SHIB price has traded inside an ascending parallel channel since June 2023. Such channels usually contain corrective movements. Additionally, the SHIB price broke down from a symmetrical triangle pattern today. This is a bearish sign that could mean the upward trend is over.
SHIB is at risk of falling below the minor support at $0.0000095.
The RSI is also bearish since it just fell below 50 and is falling. If the decrease continues, SHIB can fall by another 20% and reach the channel’s support trend line at $0.0000075.
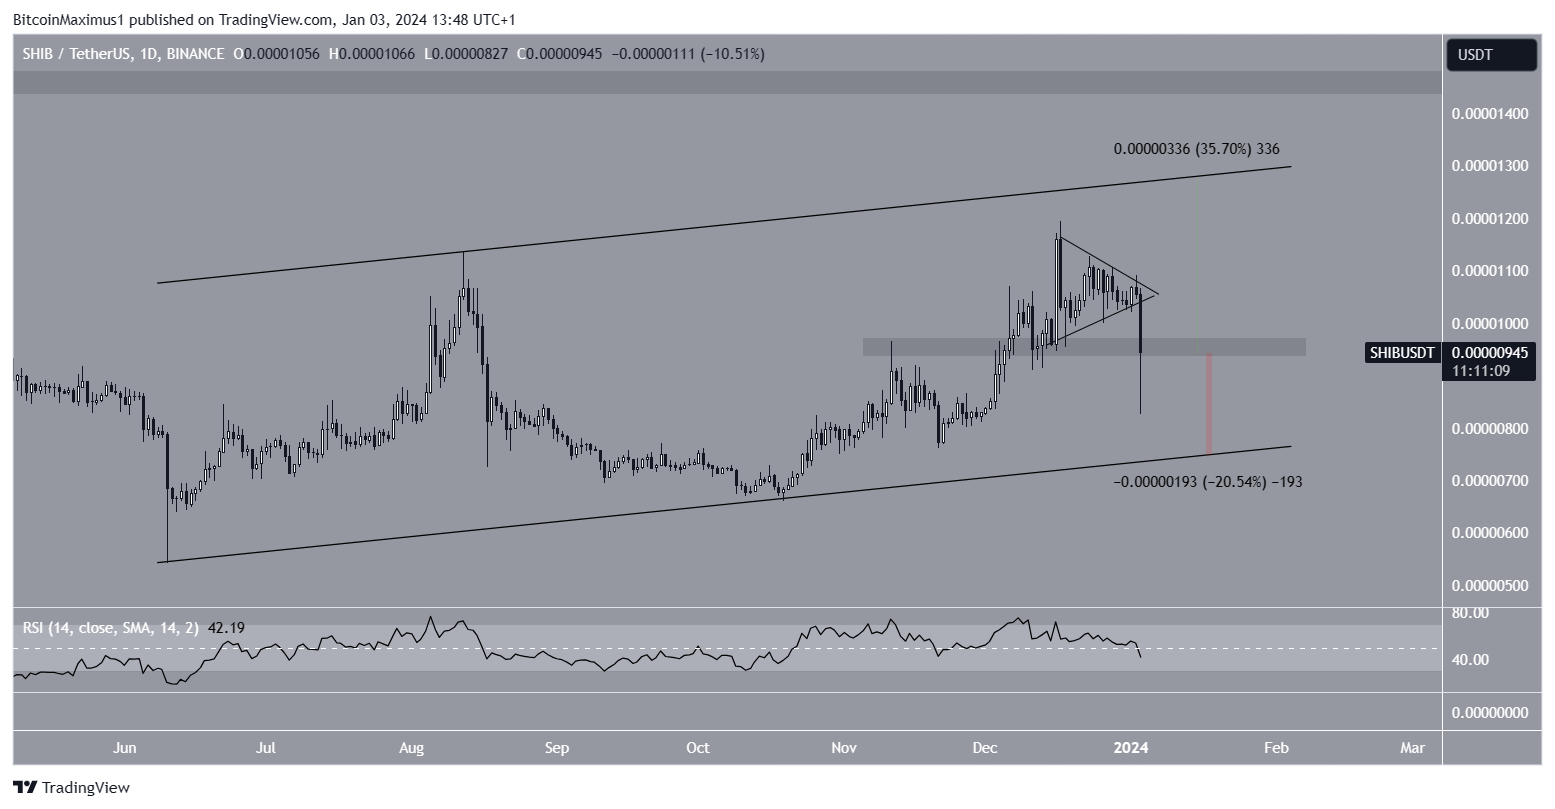
Despite this bearish SHIB price prediction, reclaiming the $0.0000095 support area can trigger a 35% increase to the channel’s resistance trend line at $0.000013.
For BeInCrypto’s latest crypto market analysis, click here.


