


The Shiba Inu (SHIB) price failed to break out from an ascending parallel channel on December 17 and has fallen since.
The weekly and daily time frame readings do not align with each other. There has also been a noticeable decline in tokens burned in the past 24 hours.
Shiba Inu Clears Diagonal Resistance
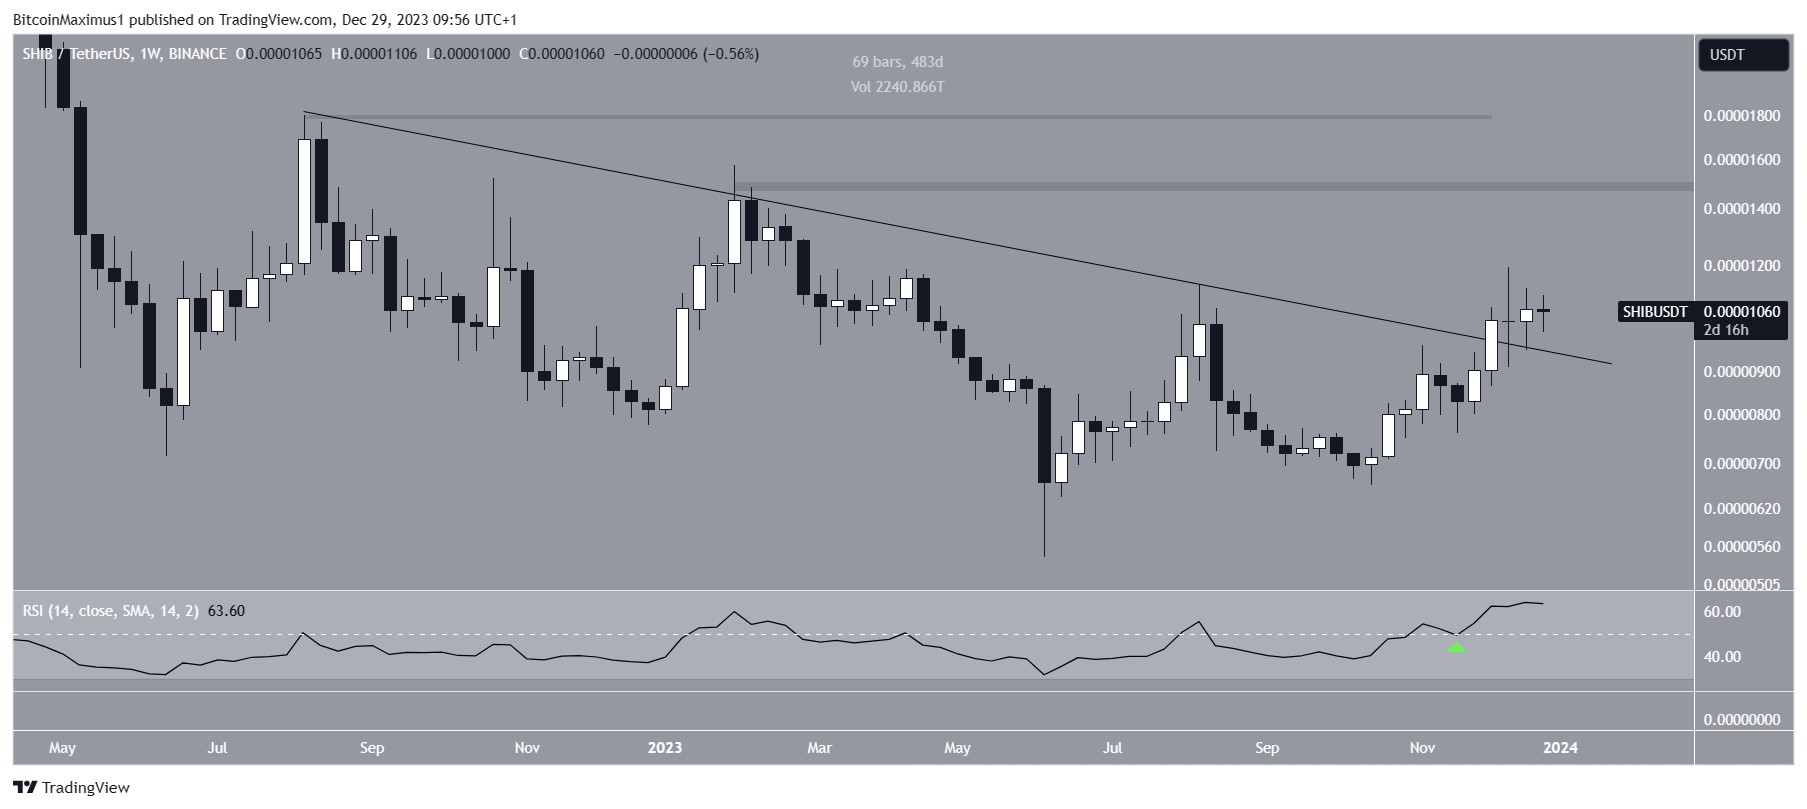
A look at the weekly time frame price action shows that the SHIB price has been moving upwards since falling to a low of $0.0000054 in June.
In November, the increase caused the SHIB price to break out from a descending resistance trend line that had been in place for 480 days.
Despite the breakout, the SHIB price has not surged. Rather, it trades very close to the descending resistance trend line.
It is also worth noting that only 500,000 tokens were burned in the past 24 hours, a significant decline from the day before.
Market traders use the RSI as a momentum indicator to identify overbought or oversold conditions and to decide whether to accumulate or sell an asset.
Readings above 50 and an upward trend indicate that bulls still have an advantage, whereas readings below 50 suggest the opposite.
The RSI moved above 50 (green icon) while the price broke out, legitimizing the upward movement.
Read More: 11 Best Shiba Inu (SHIB) Wallets in 2023
SHIB Price Prediction: How Long Will the Price Correct?
The daily timeframe suggests a potential correction in SHIB price, contrasting with the weekly outlook. This is attributed to observed price action and RSI indicator.
On December 17, SHIB faced rejection at the resistance trend line of an ascending parallel channel (red icon). Subsequently, on December 23, it formed a lower high, indicating a bearish signal.
A noteworthy factor is the bearish divergence in the daily RSI during the rejection period. A bearish divergence occurs when momentum decreases while prices increase, reinforcing the likelihood of a correction.
If the SHIB decline continues, the nearest support is anticipated to be around $0.0000095, representing a 10% decrease from the current price.
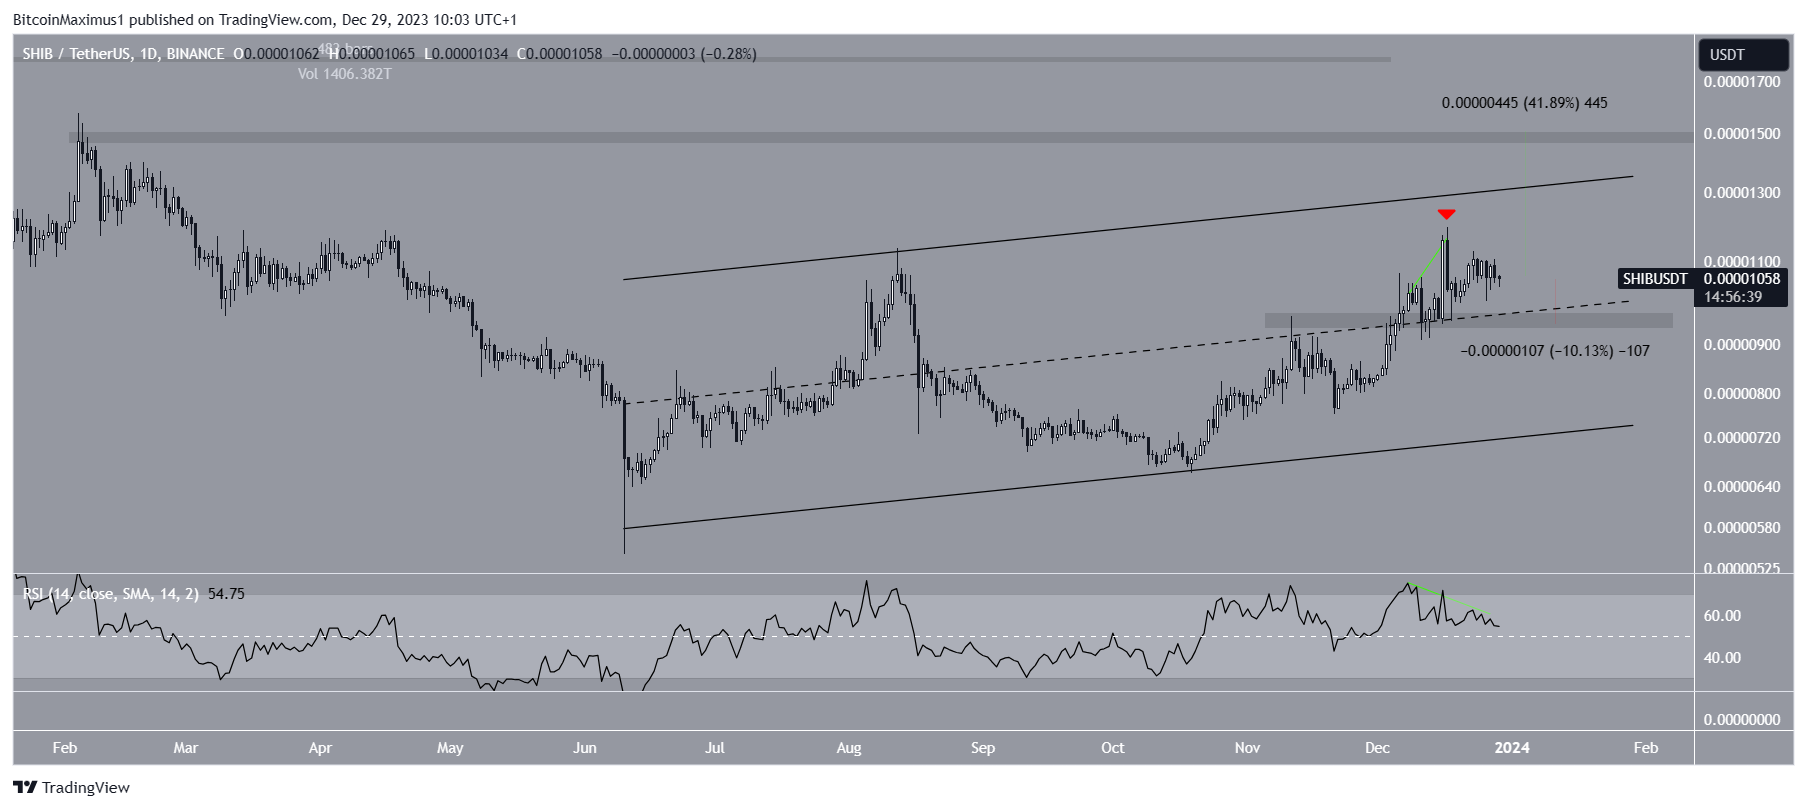
It’s crucial to note that the bearish outlook can be invalidated if SHIB breaks out from the channel. Such a breakout could propel the price by 42%, targeting the next resistance at $0.0000150.
For BeInCrypto’s latest crypto market analysis, click here.


