
The Shiba Inu (SHIB) price has decreased since December 17, when it failed to break out from an ascending parallel channel.
While the SHIB price trades above a long-term resistance area, short-term readings show weakness despite a 7.5 million token burn in the last 24 hours.
Shiba Inu Closes Above Resistance
The technical analysis of the weekly time frame shows that the SHIB price has increased steadily since June, when it was trading at a low of $0.0000054. The upward movement accelerated after the price created a higher low in October.
After three unsuccessful attempts (red icons), SHIB broke out from a 475-day descending resistance trend line in December. Then, it moved and closed above an important horizontal resistance area.
It is also worth mentioning that more than 7,500,000 SHIB tokens have been burned in the past 24 hours alone. Also, the total value locked (TVL) in Shibarium surpassed $1 million.
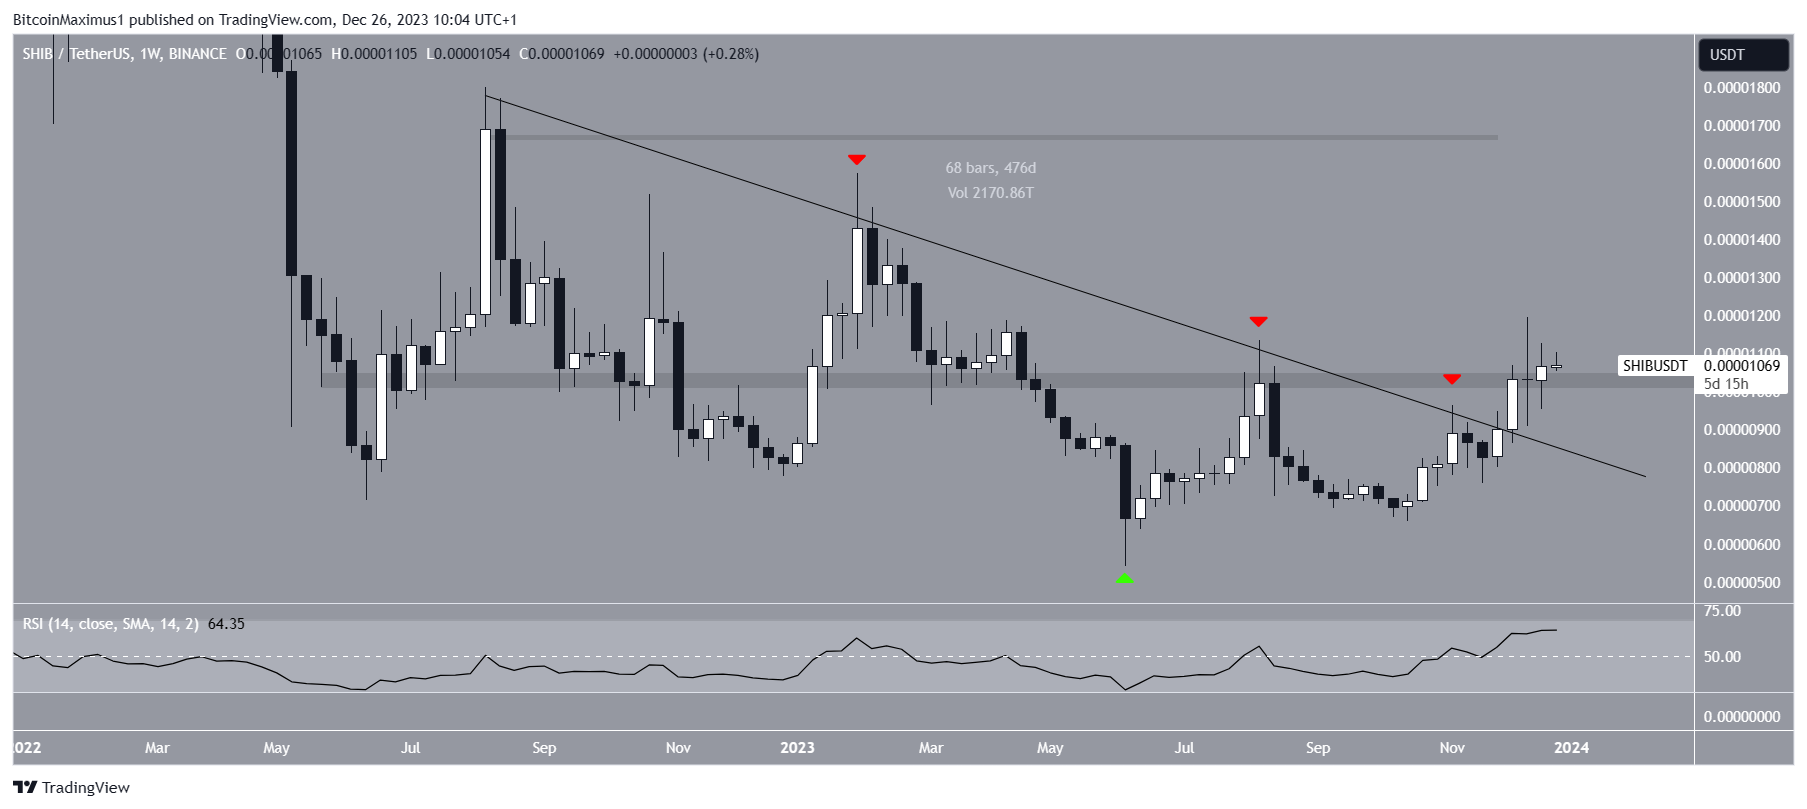
When evaluating market conditions, traders use the RSI as a momentum indicator to determine whether a market is overbought or oversold and whether to accumulate or sell an asset.
If the RSI reading is above 50 and the trend is upward, bulls still have an advantage, but if the reading is below 50, the opposite is true.
The RSI is above 50 and moving upward, both signs of a bullish trend.
Read More: 11 Best Shiba Inu (SHIB) Wallets in 2023
SHIB Price Prediction: Can Price Regain Footing?
Unlike the weekly time frame, the daily one suggests that the SHIB price will correct. This is because of the price action and RSI readings.
The price action shows that SHIB was rejected by an ascending parallel channel’s resistance trend line (red icon) on December 17. Then, it created a lower high on December 23.
Additionally, the daily RSI generated a bearish divergence at the time of the rejection. A bearish divergence occurs when a momentum decrease accompanies a price increase.
This supports the ongoing rejection and indicates that the SHIB price is correcting. If the decrease continues, the closest support area will be 12% below the current price at $0.0000095.
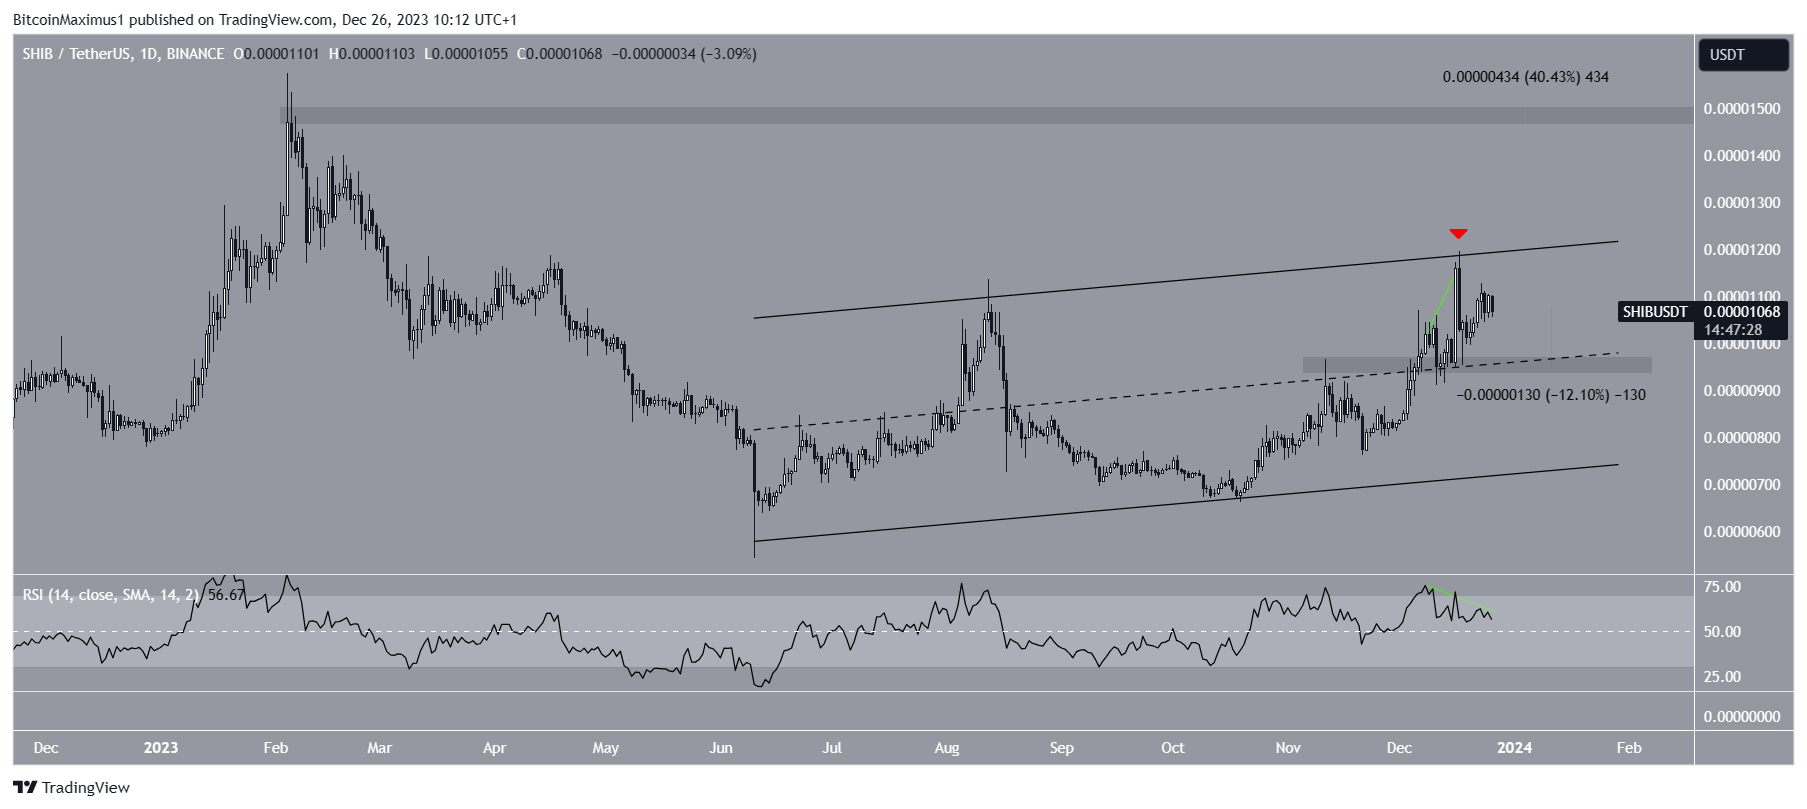
Despite this bearish short-term SHIB price prediction, breaking out from the channel will invalidate the correction. The SHIB price can increase by 40% to the next resistance at $0.0000150 if this happens.
For BeInCrypto’s latest crypto market analysis, click here.
Disclaimer
In line with the Trust Project guidelines, this price analysis article is for informational purposes only and should not be considered financial or investment advice. BeInCrypto is committed to accurate, unbiased reporting, but market conditions are subject to change without notice. Always conduct your own research and consult with a professional before making any financial decisions. Please note that our Terms and Conditions, Privacy Policy, and Disclaimers have been updated.
