

The Polygon (MATIC) price is trading at a crucial level. The reaction to it could determine if the future long-term trend is bullish or bearish.
The Polygon network is a Layer 2 scaling solution for the Ethereum blockchain. Its native token is MATIC. The MATIC price has increased since creating a bullish hammer candlestick on March 10.
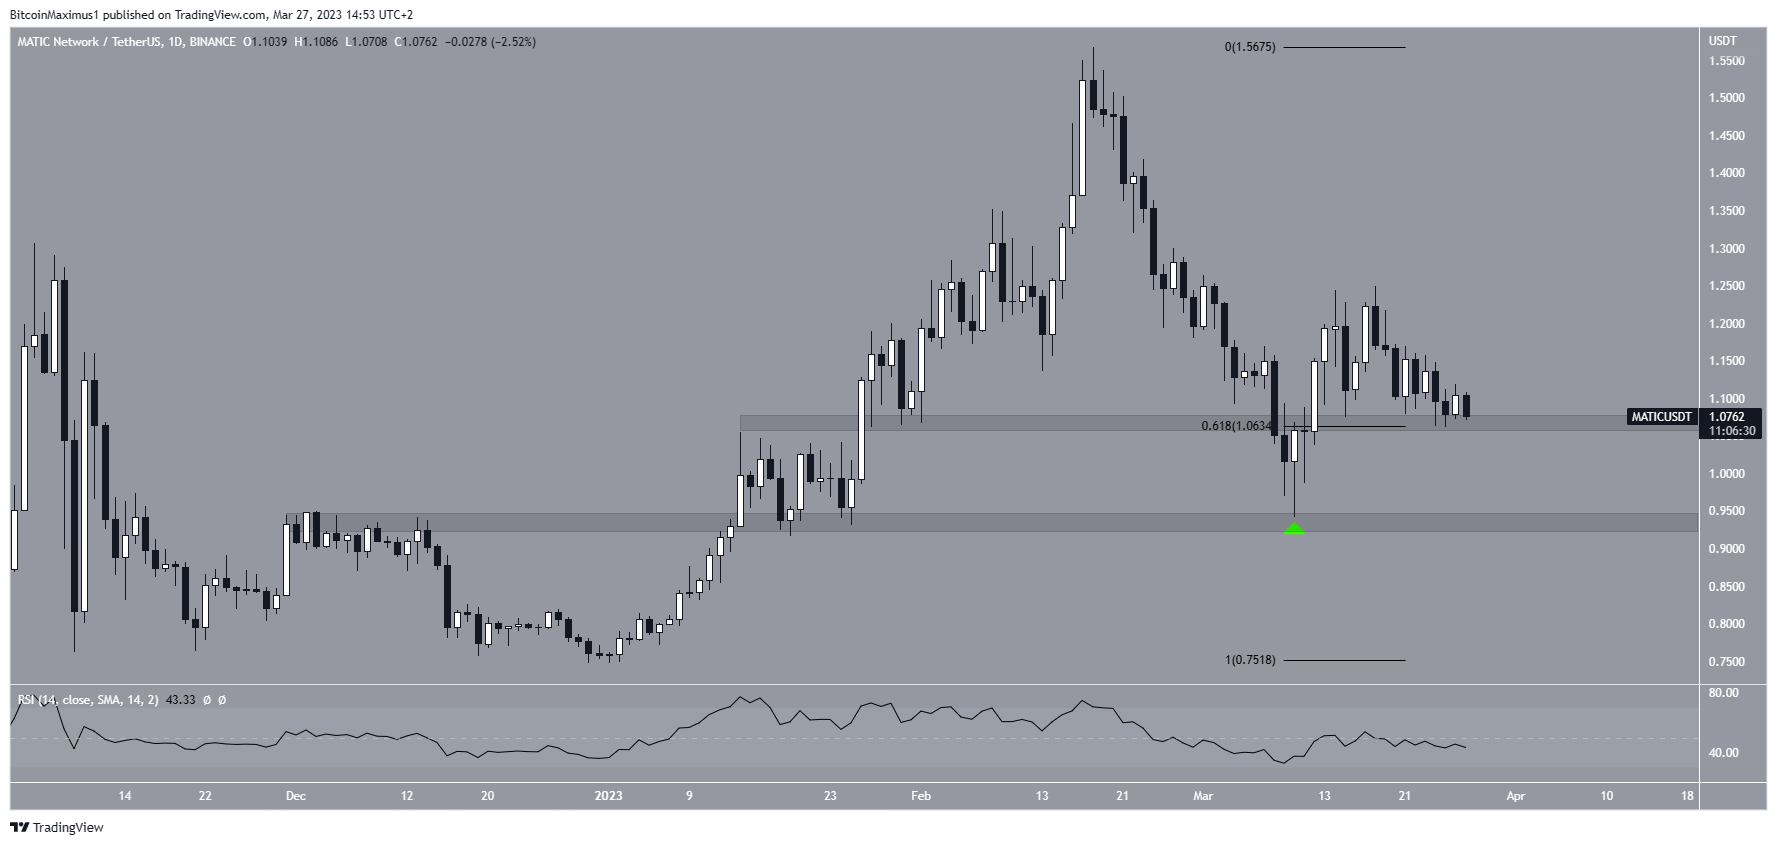
The increase led to a reclaim of the 0.618 Fib retracement support level of $1.07 and a high of $1.25 on March 18. While the price has fallen to the $1.07 support area again, the decrease may be just a retest of the area after the breakout.
The daily RSI is at 50, providing a neutral trend. Therefore, whether the price bounces in the area, creating a higher low or breaks down could determine the future trend’s direction. A breakdown would likely catalyze a fall to $0.93, while the creation of a higher low would mean that the rally is likely to continue toward the $1.57 yearly high.
Is Polygon (MATIC) Price Relief Rally Over?
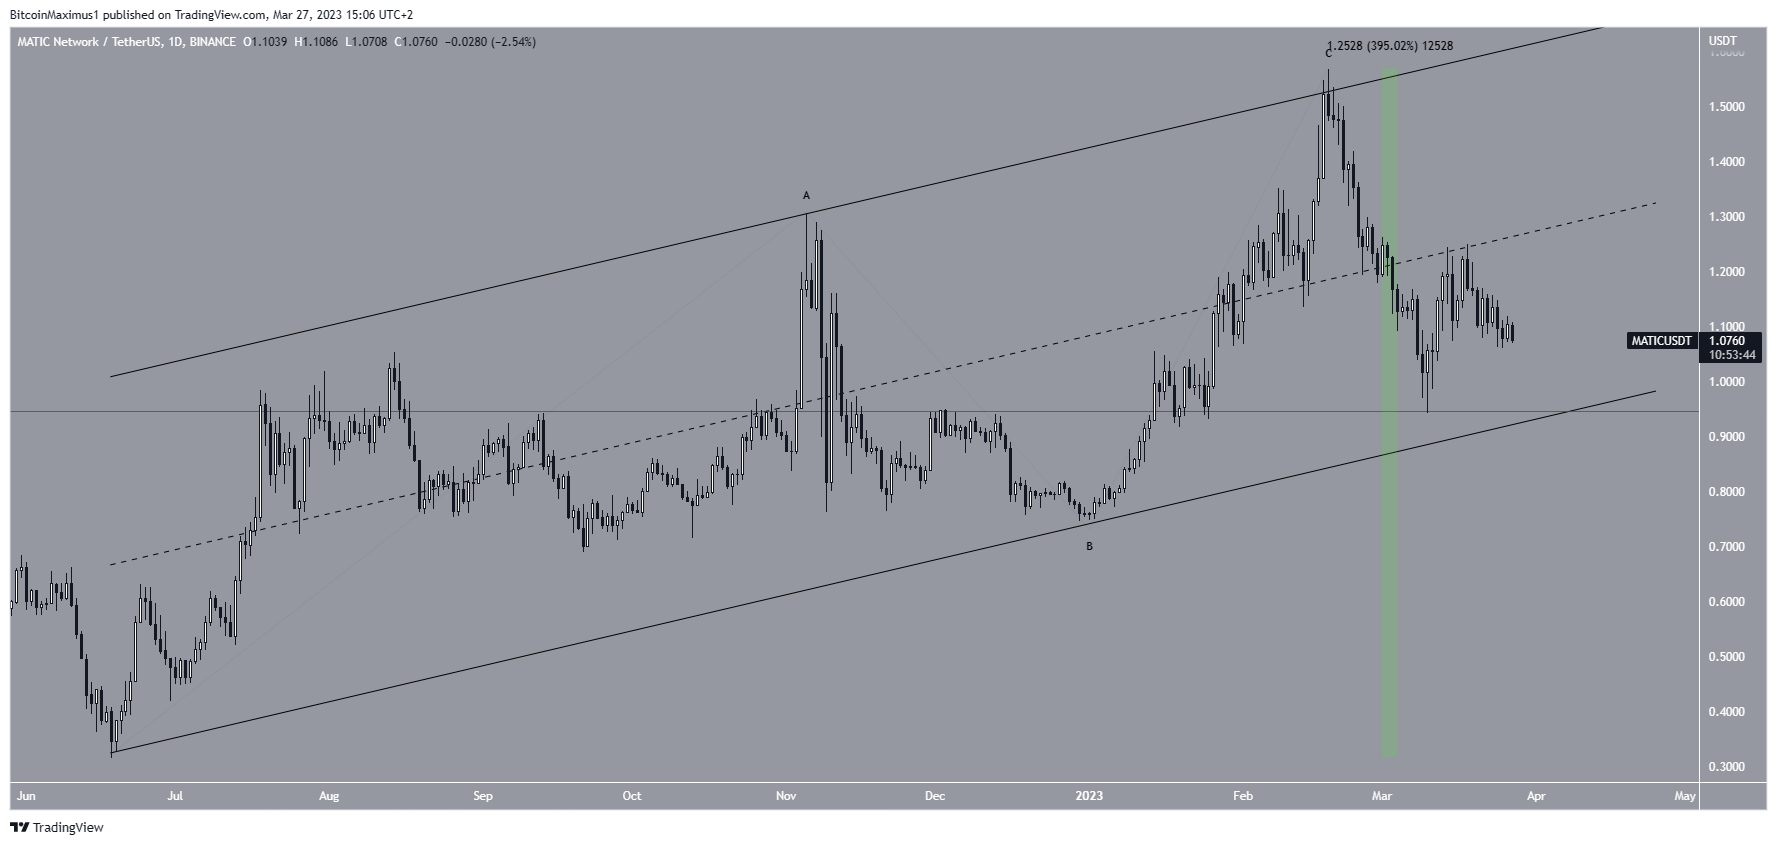
The technical analysis from the daily time frame shows that the entire 394% MATIC token price increase since June 2022 was contained inside an ascending parallel channel. Since channels usually contain corrective structure, the entire increase may have been an A-B-C corrective structure (black).
Moreover, the channel’s support line coincides with the March 10 low (red line). Therefore, a breakdown from the channel would definitively invalidate the bullish structure.
In that case, the price would be expected to fall to its 2022 low of $0.31.
On the other hand, creating a higher low as outlined above and moving above the channel’s midline would invalidate this bearish forecast. In that case, an increase toward the channel’s resistance line at $1.70 could occur.
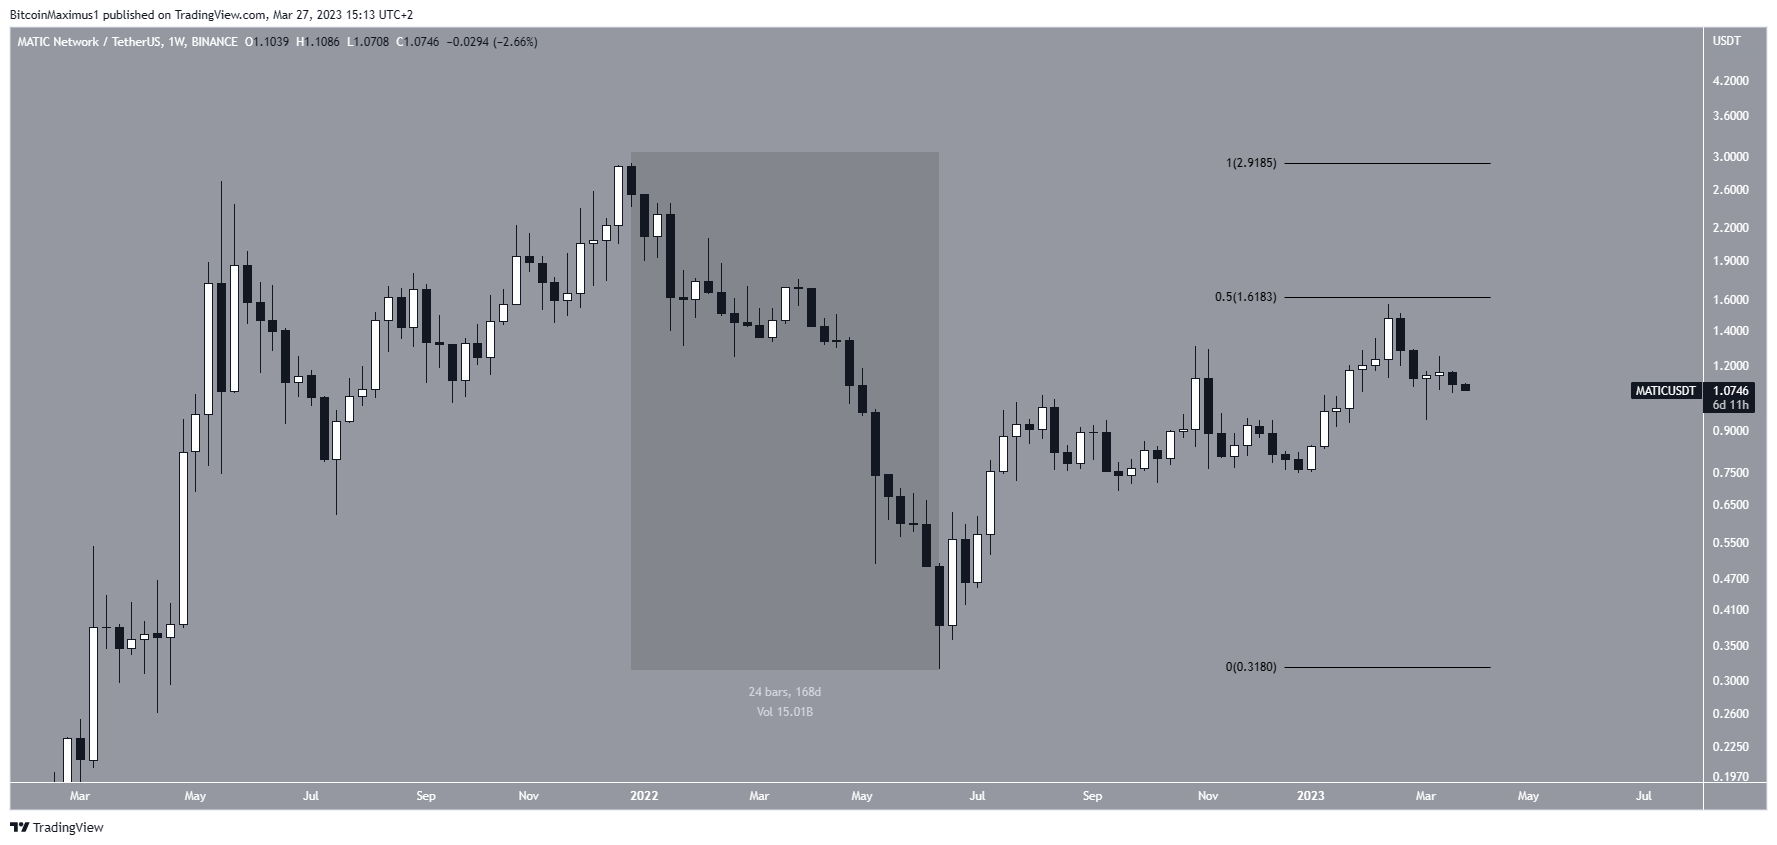
The possibility that the increase was part of a relief rally makes sense when looking at the weekly time frame. In that case, the increase occurred as a correction relative to the previous downward movement (highlighted) that began after the MATIC price’s all-time high. The rally validated the long-term 0.5 Fib retracement support level, and a new downward movement will follow soon.
To conclude, whether the Polygon price creates a higher low or breaks down below its March 10 low will determine the future trend’s direction. A breakdown could lead to lows near $0.30, while a higher low could cause an increase toward at least $1.61.
For BeInCrypto’s latest crypto market analysis, click here.
Disclaimer
In line with the Trust Project guidelines, this price analysis article is for informational purposes only and should not be considered financial or investment advice. BeInCrypto is committed to accurate, unbiased reporting, but market conditions are subject to change without notice. Always conduct your own research and consult with a professional before making any financial decisions. Please note that our Terms and Conditions, Privacy Policy, and Disclaimers have been updated.
