


The Polygon (MATIC) price moved above $1 today. It is breaking out from a 730-day descending resistance trend line, which has been in place since the all-time high.
Despite the breakout, MATIC is still below its yearly high of $1.57. Can it reach a new one before the end of the year?
Polygon Finally Breaks Out
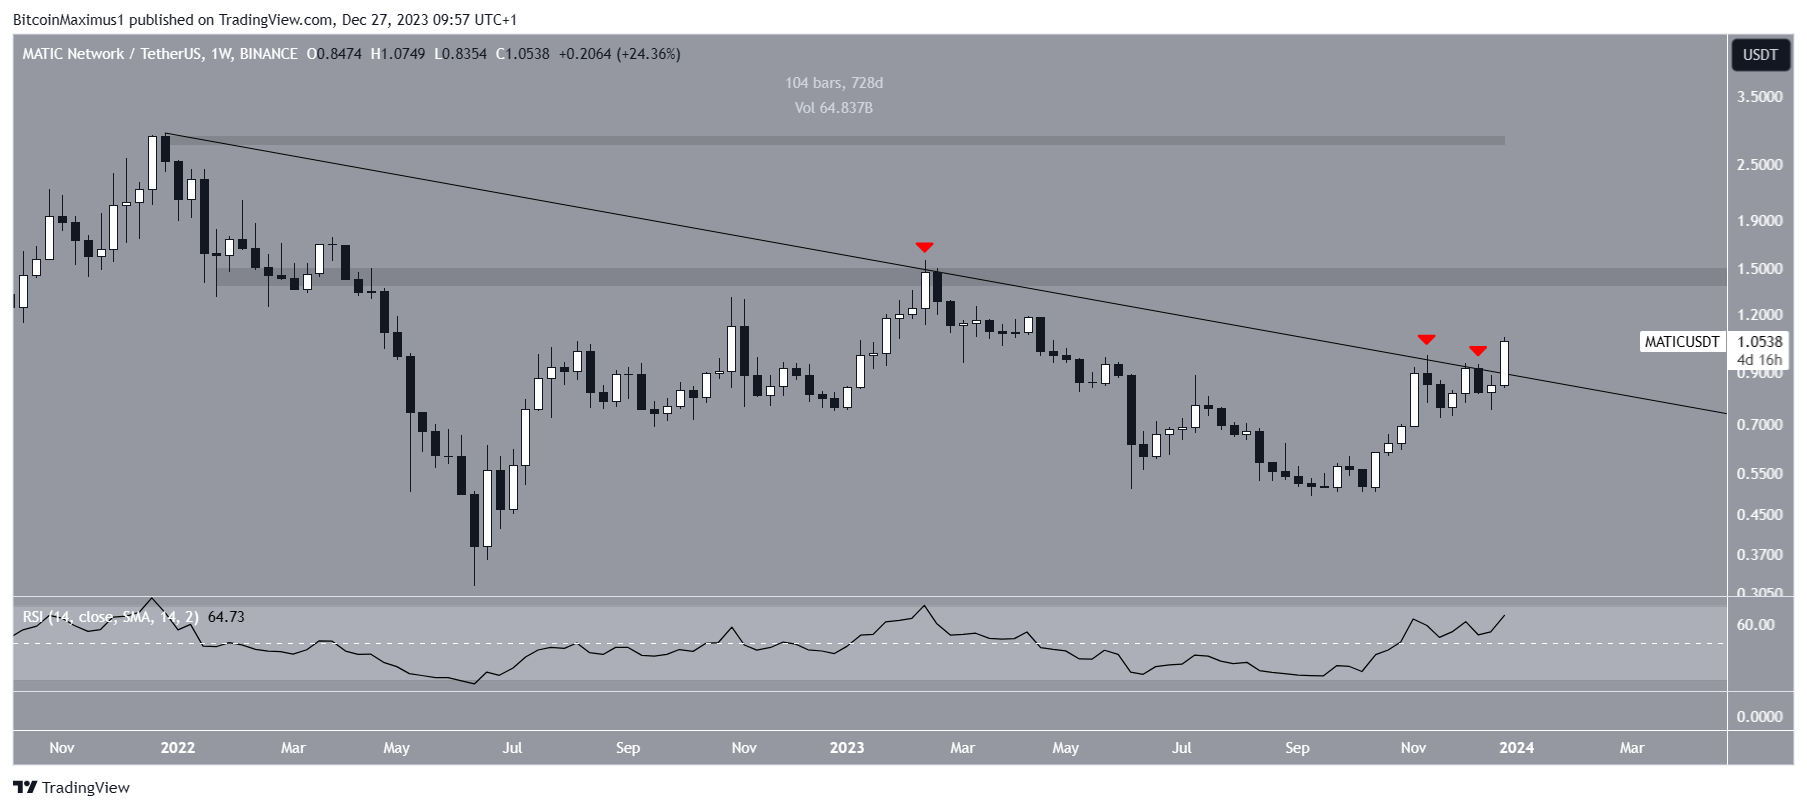
The MATIC price had fallen under a long-term descending resistance trend line since the all-time high of $2.90 in December 2021. The decrease led to a low of $0.32 in June.
After beginning an upward movement, MATIC attempted to break out in February 2023 (red icon) but was unsuccessful. Two more unsuccessful breakout attempts followed in November and December before the price finally broke out this week.
Today’s high of $1.07 is the highest since April. It is worth mentioning that MATIC has not reached a weekly close above the resistance trend line yet.
Market traders use the RSI as a momentum indicator to identify overbought or oversold conditions and to decide whether to accumulate or sell an asset.
Readings above 50 and an upward trend indicate that bulls still have an advantage, whereas readings below 50 suggest the opposite.
The weekly RSI is increasing and above 50, both signs of a bullish trend.
Read More: What is Polygon (MATIC)?
What Do Analysts Think?
Cryptocurrency traders and analysts on X have a bullish outlook on the future MATIC price trend.
Pentosh1 suggests the upward movement will continue since the price has bounced at a long-term support area. He tweeted:
You can’t not like this setup. Have no idea how long it will take to play out, just that it likely will probabilistically speaking Historical support confluence, bull flagging for more. Yet to run but starting to find it’s flippers
The Cryptomist also gives a bullish outlook on the future trend. She tweeted a potential triangle breakout that leads to a price of $1.30.
Finally, Open4Profit tweeted a breakout from a bullish cup and handle pattern, suggesting that this will lead to new highs.
Read More: How to Buy Polygon (MATIC)?
MATIC Price Prediction: Will End-of-Year Rally Continue?
The technical analysis from the daily time frame gives a bullish outlook because of the wave count and RSI readings.
Elliott Wave theory involves the analysis of recurring long-term price patterns and investor psychology to determine the direction of a trend.
The most likely wave count suggests that MATIC is in the fifth and final wave of an upward movement (black). The first target for the top of this wave if at $1.20, 13% above the current price. The target is found by giving wave five 0.618 times the length of waves one and three combined.
The second target is $1.50, 40% above the current price. It is found by giving wave five the entire length of waves one and three combined.
This count is supported by the daily RSI, which has generated a hidden bullish divergence (green), a sign of trend continuation.
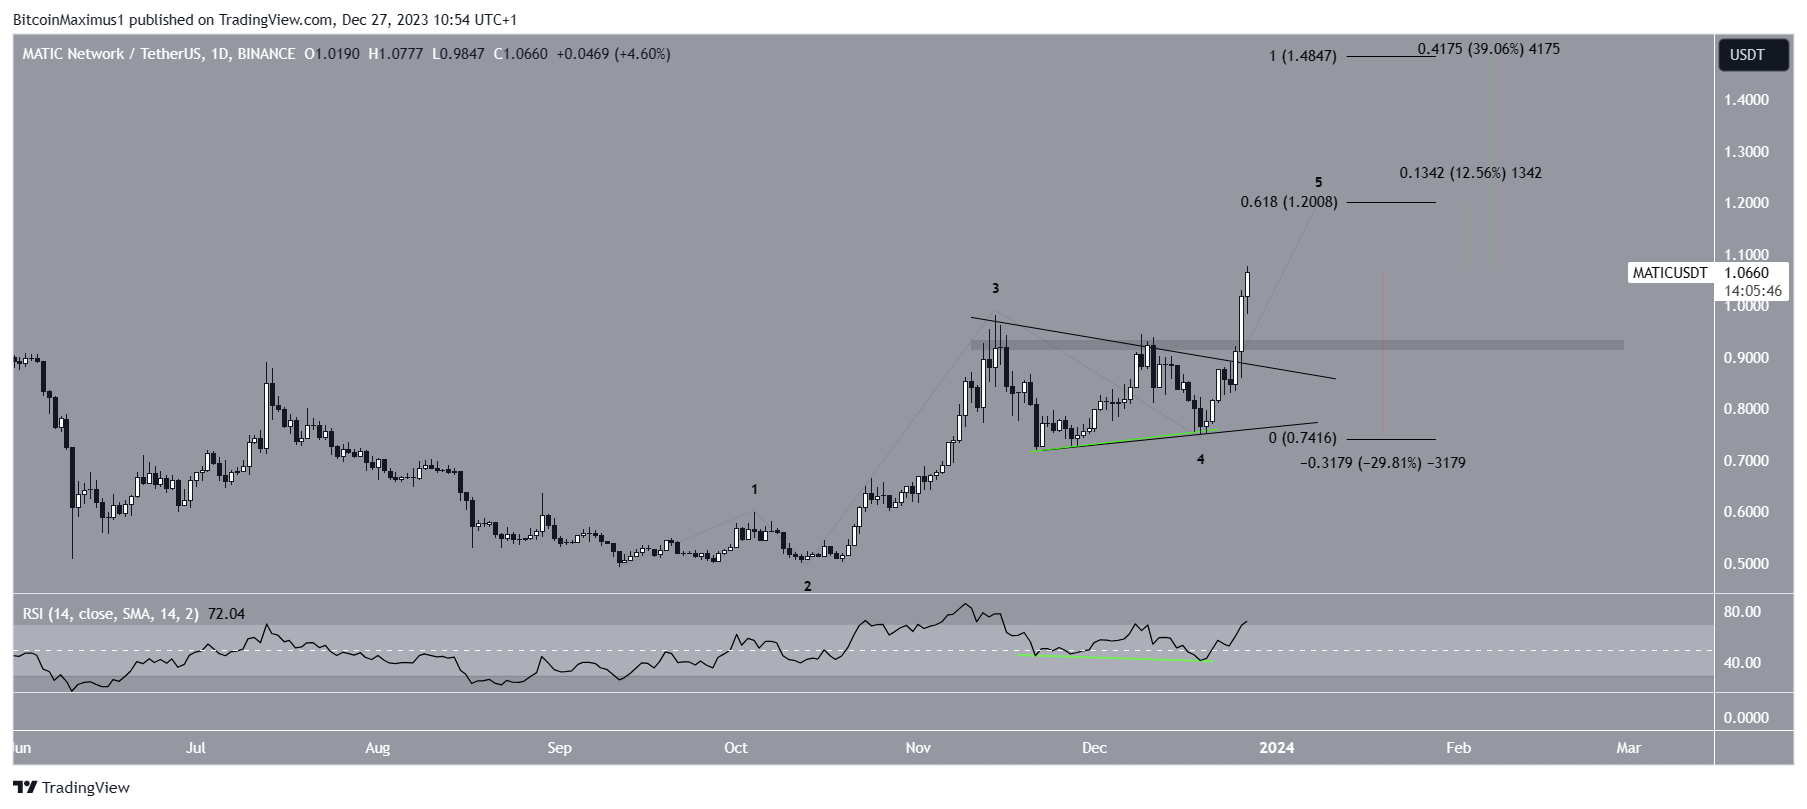
Despite this bullish MATIC price prediction, closing below the $0.95 horizontal support area will mean the top is in. Then, MATIC can fall 30% to the closest support at $0.75.
For BeInCrypto’s latest crypto market analysis, click here.
Is Polygon MATIC Just Starting to Spread its Wings? – YouTube


