


The Litecoin (LTC) price finally cleared the $100 horizontal resistance area and reached a new yearly high of $115 on July 3. This was the highest price in more than a year.
While the short-term movement suggests that a retracement could occur, long-term readings support the continuing upward movement to new highs.
Litecoin Price Falls to Retest Breakout Level
The technical analysis on a weekly time frame for LTC gives a predominantly positive outlook. There are several factors supporting this view.
To begin with, LTC has been trading within an ascending triangle pattern since May 2022, which is generally considered bullish. Therefore, the pattern usually leads to breakouts. Additionally, LTC has repeatedly attempted to surpass the $100 resistance level.
Read More: Best Crypto Sign-Up Bonuses in 2023
The LTC price began upward after bouncing at the support line on June 15 (green icon). It broke out from the $100 area last week and reached a new yearly high of $115.
While the price has fallen slightly since it is possible that it is just returning to validate the $100 area as support before continuing its increase.
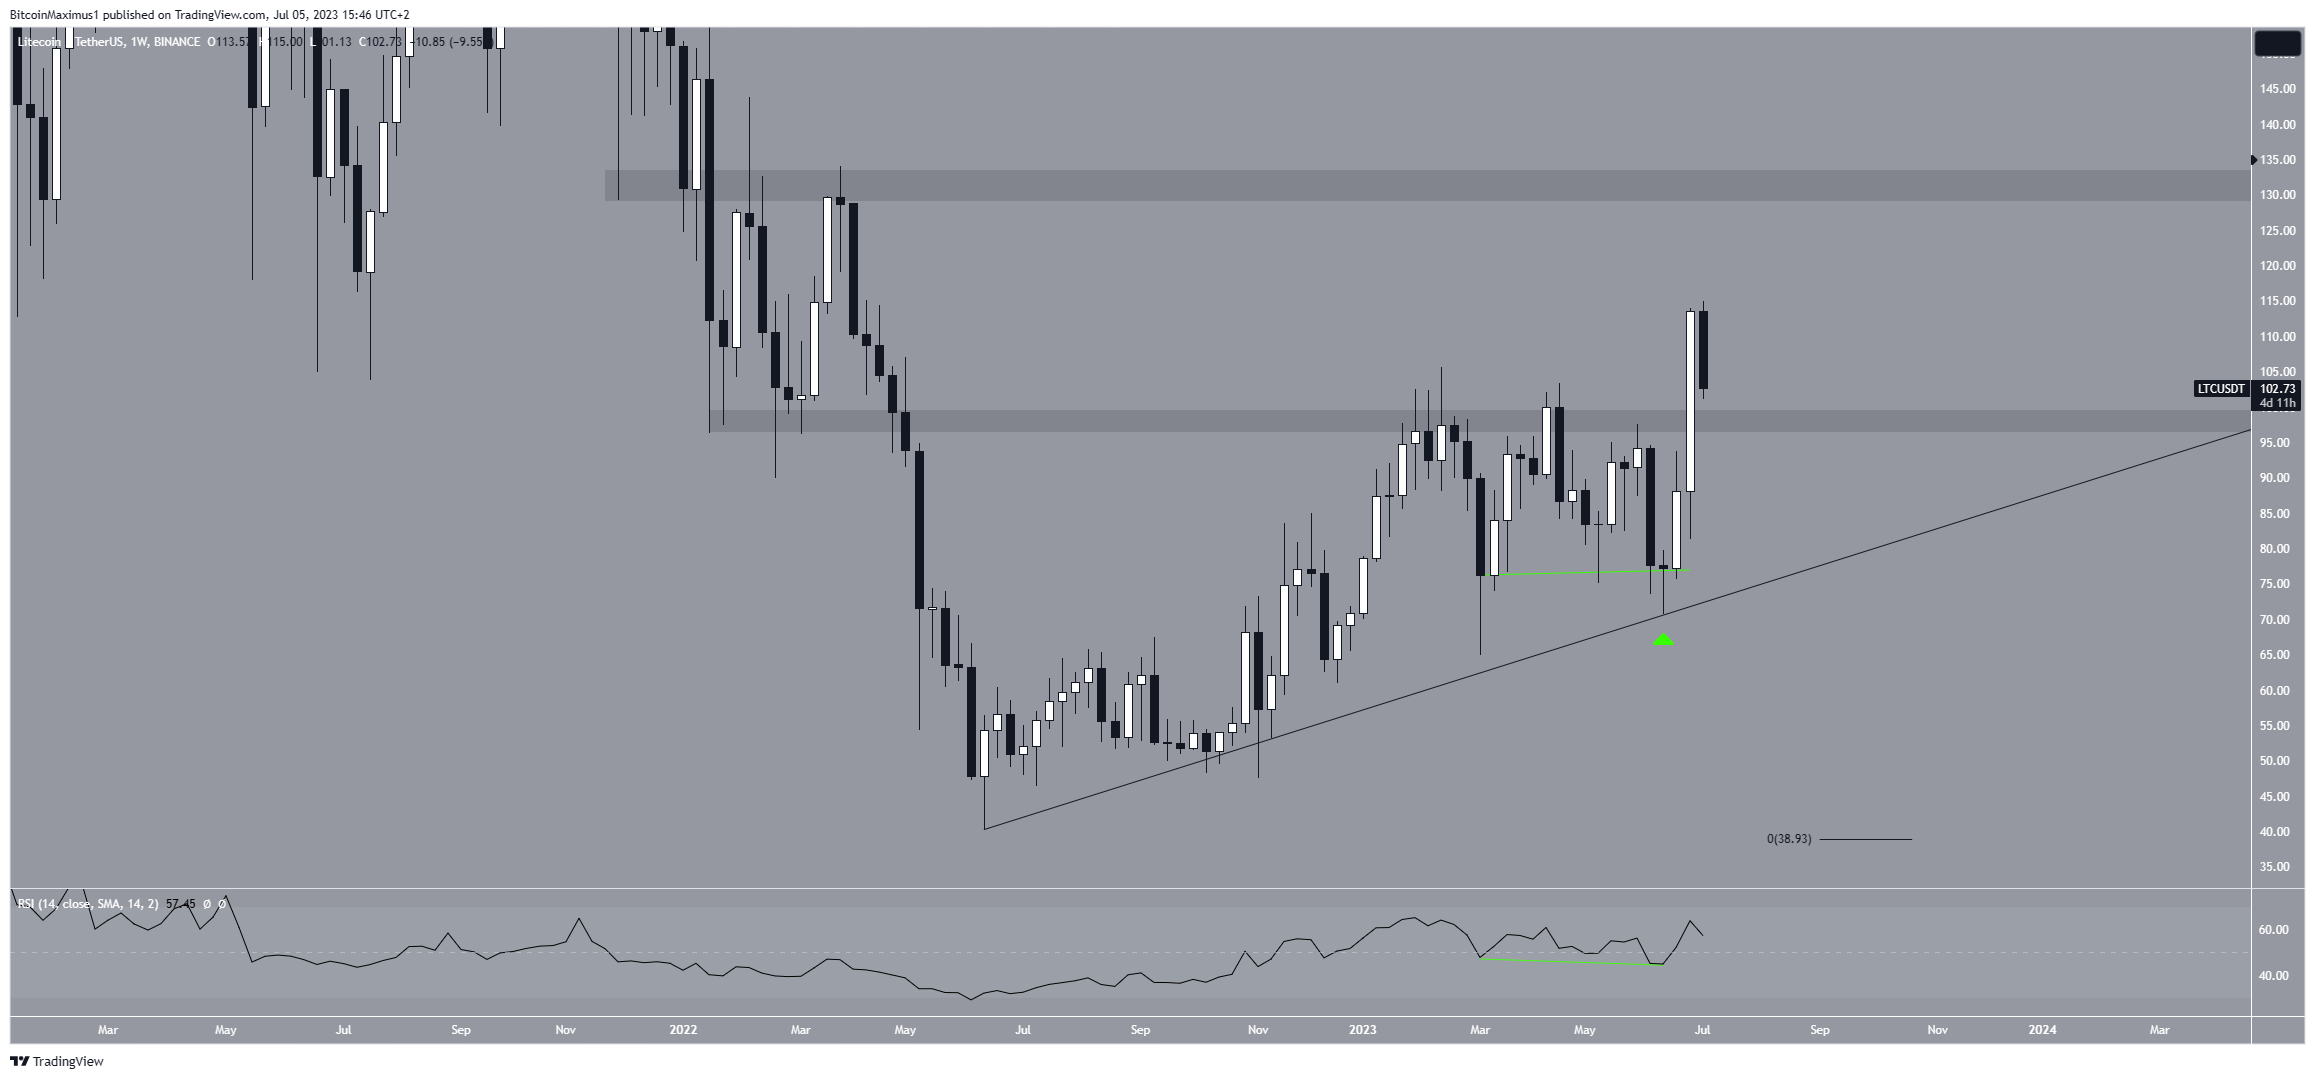
Furthermore, the weekly Relative Strength Index (RSI) shows a bullish inclination. Traders utilize the RSI as a momentum indicator to determine whether a market is overbought or oversold, helping them decide whether to buy or sell an asset.
If the RSI reading is above 50 and the trend is upward, it provides an advantage to the bulls. Conversely, if the reading falls below 50, the opposite holds true. The RSI is above 50 and rising, indicating a favorable situation.
Moreover, it has generated a hidden bullish divergence (green line), which is a bullish continuation pattern. This pattern occurs when a decrease in momentum accompanies an increase in price, often resulting in the continuation of the existing bullish trend.
LTC Price Prediction: Wave Count Supports Ongoing Rally
The daily time frame also provides a bullish outlook. This analysis comes from the wave count. Utilizing the Elliott Wave theory, technical analysts examine long-term price patterns and investor psychology that recur to determine the direction of a trend.
The most likely wave count suggests that the LTC price is in wave three (black) of a five-wave increase. Wave three usually has the largest magnitude of the five waves. So, the shape of the breakout fits perfectly with the possibility that the LTC price is in wave three.
Moreover, the corrective movement in what is likely wave two (highlighted) fits flawlessly with the count. Sub-wave A and C had a 1:1 ratio (red) in this move.
The most likely target for the top of wave three is at $135, giving waves 1:3 a 1:1.61 ratio. It would also take the LTC price to the $135 long-term resistance area, making it likely that the price will reach a local top there.
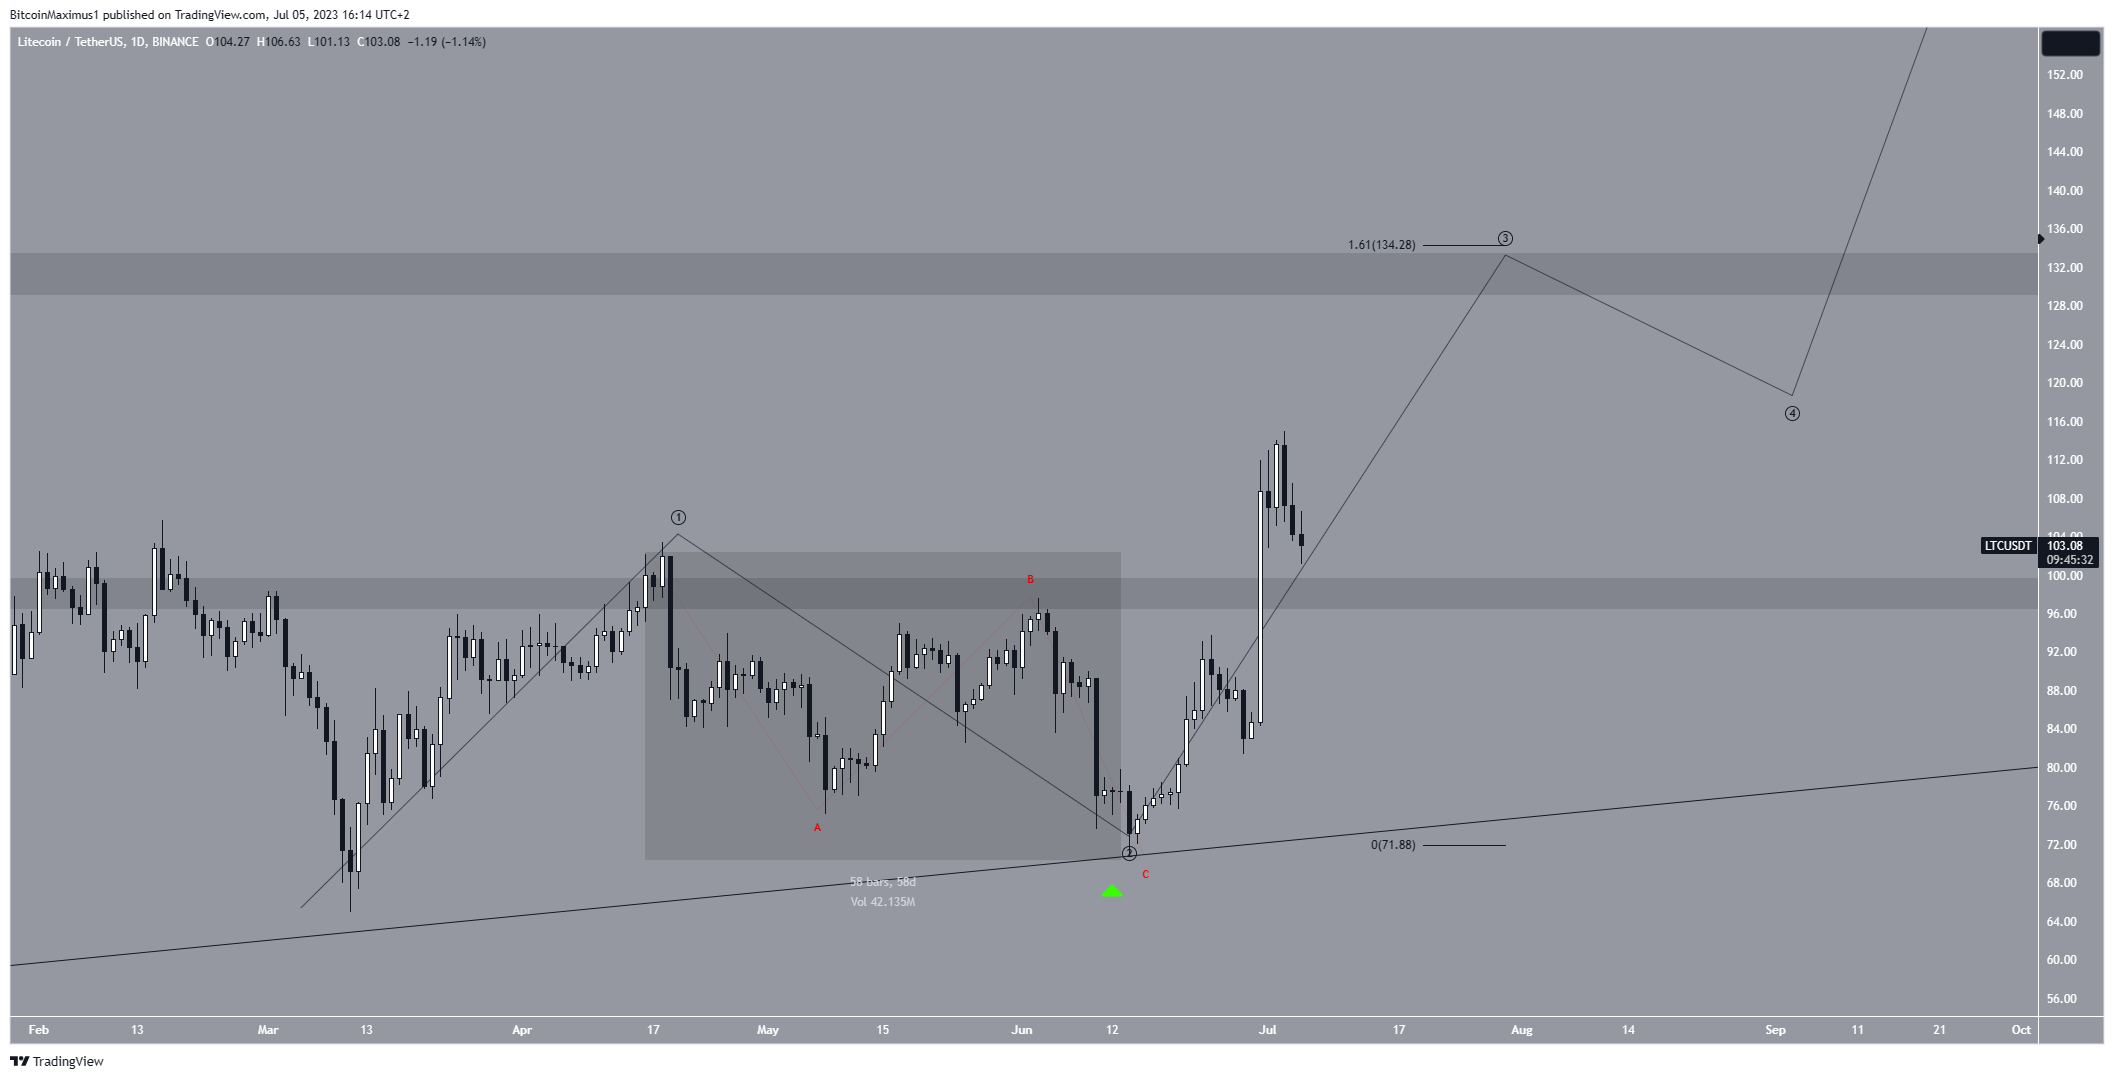
Despite this bullish LTC price prediction, a close below the $100 horizontal area will mean that the breakout was invalid.
In that case, the price can fall to the ascending support line at $80 will be the most likely scenario.
More From BeInCrypto: 9 Best AI Crypto Trading Bots to Maximize Your Profits
For BeInCrypto’s latest crypto market analysis, click here


