


Litecoin (LTC) price saw a dramatic 40% increase, quickly followed by an equal correction over a week, raising questions about future trends. A decline in active addresses and transactions suggests cooling interest, while bearish signals from the Exponential Moving Average (EMA) crosslines indicate a potential downtrend.
These developments point to a critical phase for LTC, as it might enter a price adjustment period before stabilizing. Investors are watching closely to see if LTC can overcome these bearish trends or if it will face further corrections.
Litecoin Active Addresses Is Heavily Decreasing
Active addresses are a great metric for addressing users’ interest in a given network. For Litecoin, the number of daily active addresses was consistently above 1 million during January 2024. Interestingly, all that activity didn’t reflect in price growth since LTC prices became pretty stable during that period.
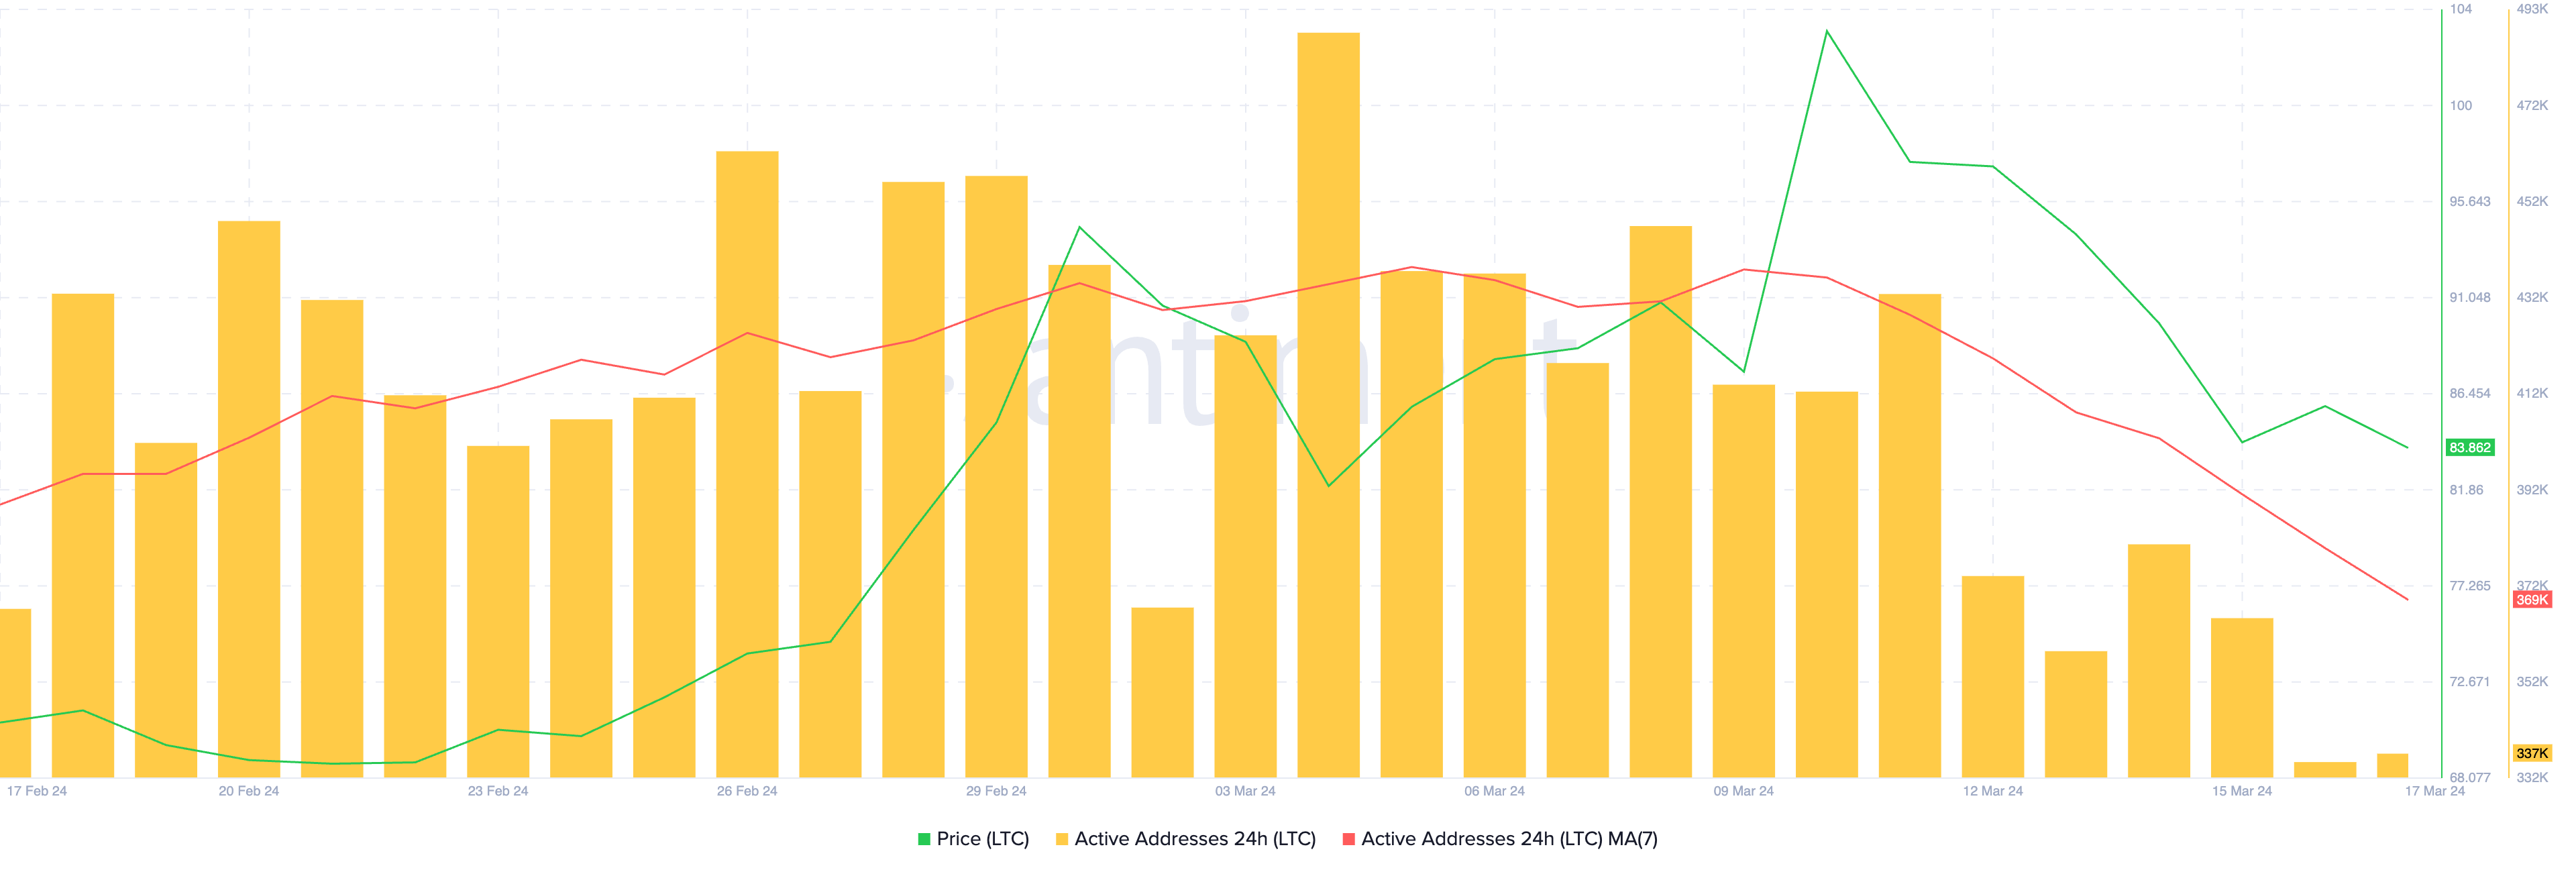
However, LTC had a huge spike in price in the following months, going from $72 on February 5 to $104 on March 10. Interestingly, the number of active addresses started to fall heavily since that price peak on March 10.
Since that, it has decreased from 413,000 to 335,000 in one week. The chart shows how the 7-day Moving Average looks right now, drawing a clear downtrend. This downtrend could indicate that users are losing their confidence in Litecoin and moving on to other opportunities, which could negatively impact its price.
Read More: 7 Best Litecoin (LTC) Wallets for 2024
The Number of Transactions Is Also Declining
Another great on-chain indicator is the number of transactions. For Litecoin, we have a similar story to that of active addresses. Between December 2023 and January 2024, Litecoin consistently reached more than 400,000 daily transactions.
At some point, it was reaching more than 1 million transactions daily. As we saw with active addresses, its price remained stable during that period despite the strong network activity.
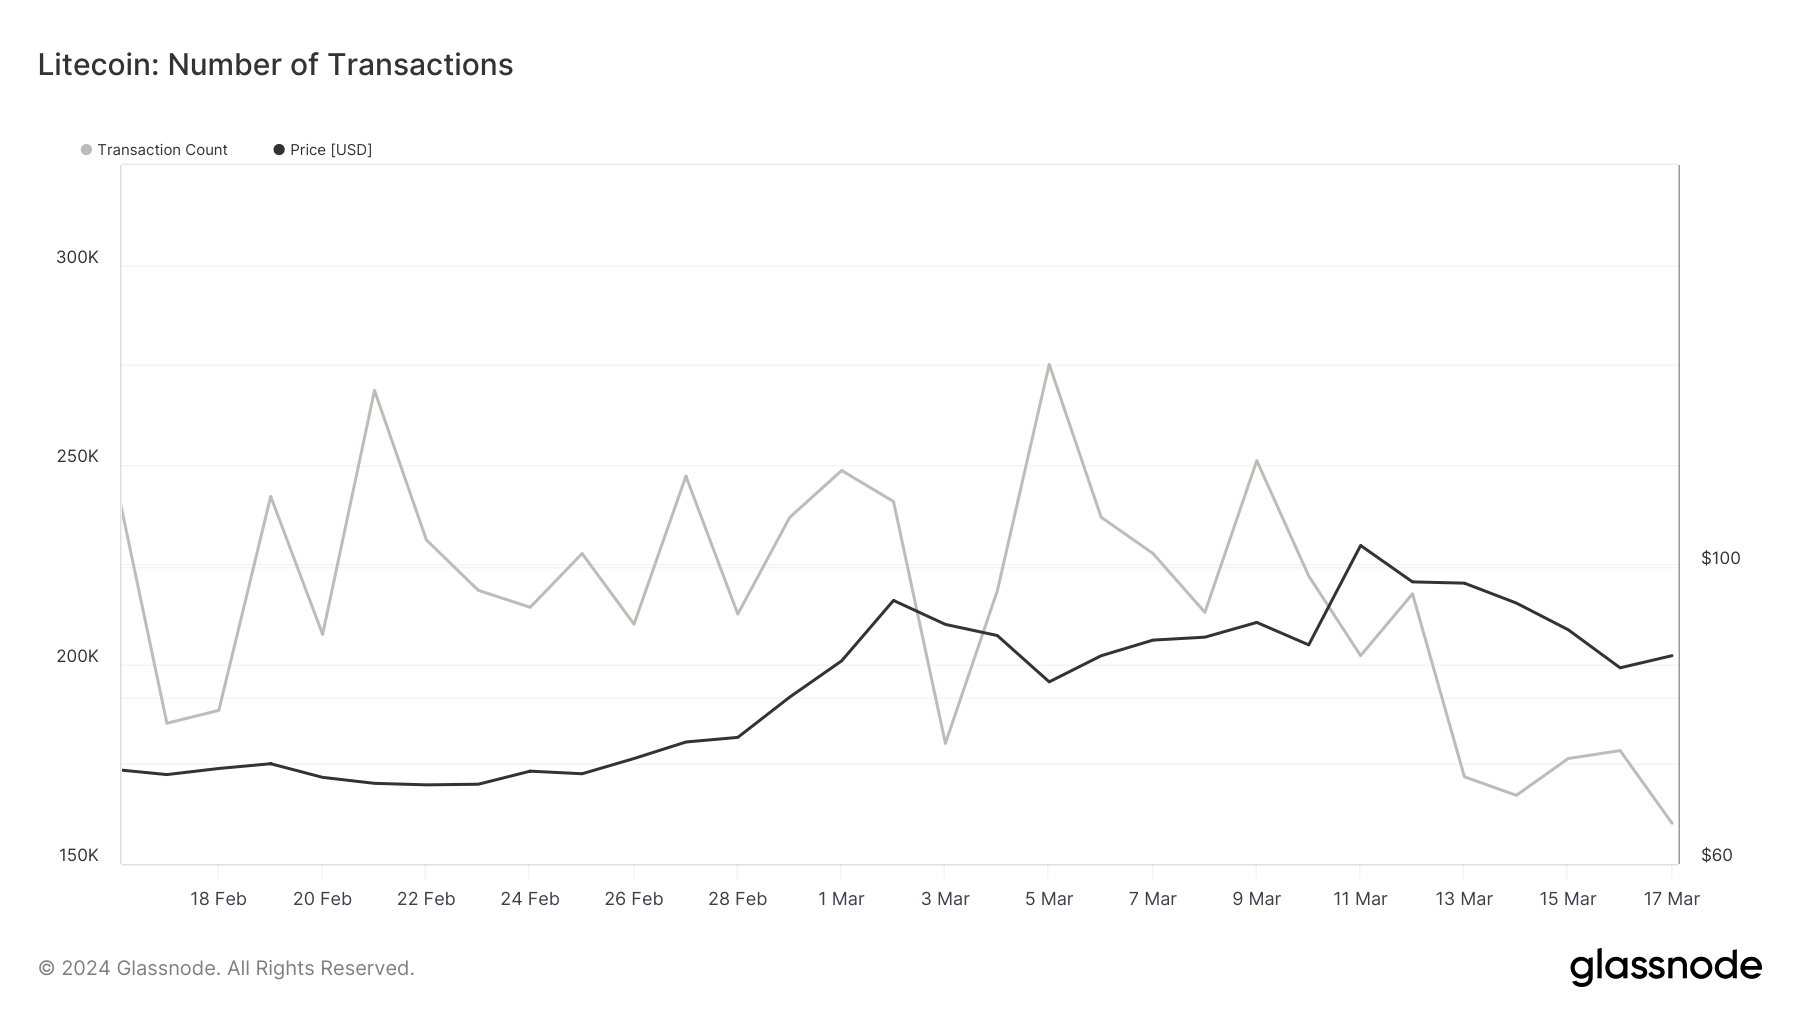
At the end of January, things started to change. Since January 25, Litecoin hasn’t registered a single day with more than 400,000 transactions. In fact, it barely achieved 300,000 in February 2024. That number continued declining in March, at less than 175,000 daily transactions. Despite that, we saw a recent price surge, and at the same time, the number of transactions was falling.
This could indicate that the recent price surge was more related to the macro crypto market and was driven by LTC’s correlation with other big players, like BTC and ETH, rather than by fundamentals.
LTC Price Prediction: Death Cross Suggests New Corrections
LTC’s 4-hour price chart currently suggests support at $83. If that one isn’t strong enough, LTC could have a new correction until $72, a 12% decrease.
LTC’s Exponential Moving Average (EMA) lines also support the bearish trend. EMAs are used to measure a trend direction over specific time frames, smoothing out price data by assigning greater weight to more recent prices. This makes EMAs more responsive to recent price changes compared to Simple Moving Averages (SMAs), which equally calculate the average price over a specific period across all data points.
The EMA 20, 50, 100, and 200 represent averages over 20 days, 50 days, 100 days, and 200 days, respectively, providing insights into short-term, medium-term, and long-term market trends.
As we can see in the chart below, the LTC price chart recently drew a “Deah Cross. This occurs when a shorter-term EMA crosses below a longer-term EMA.
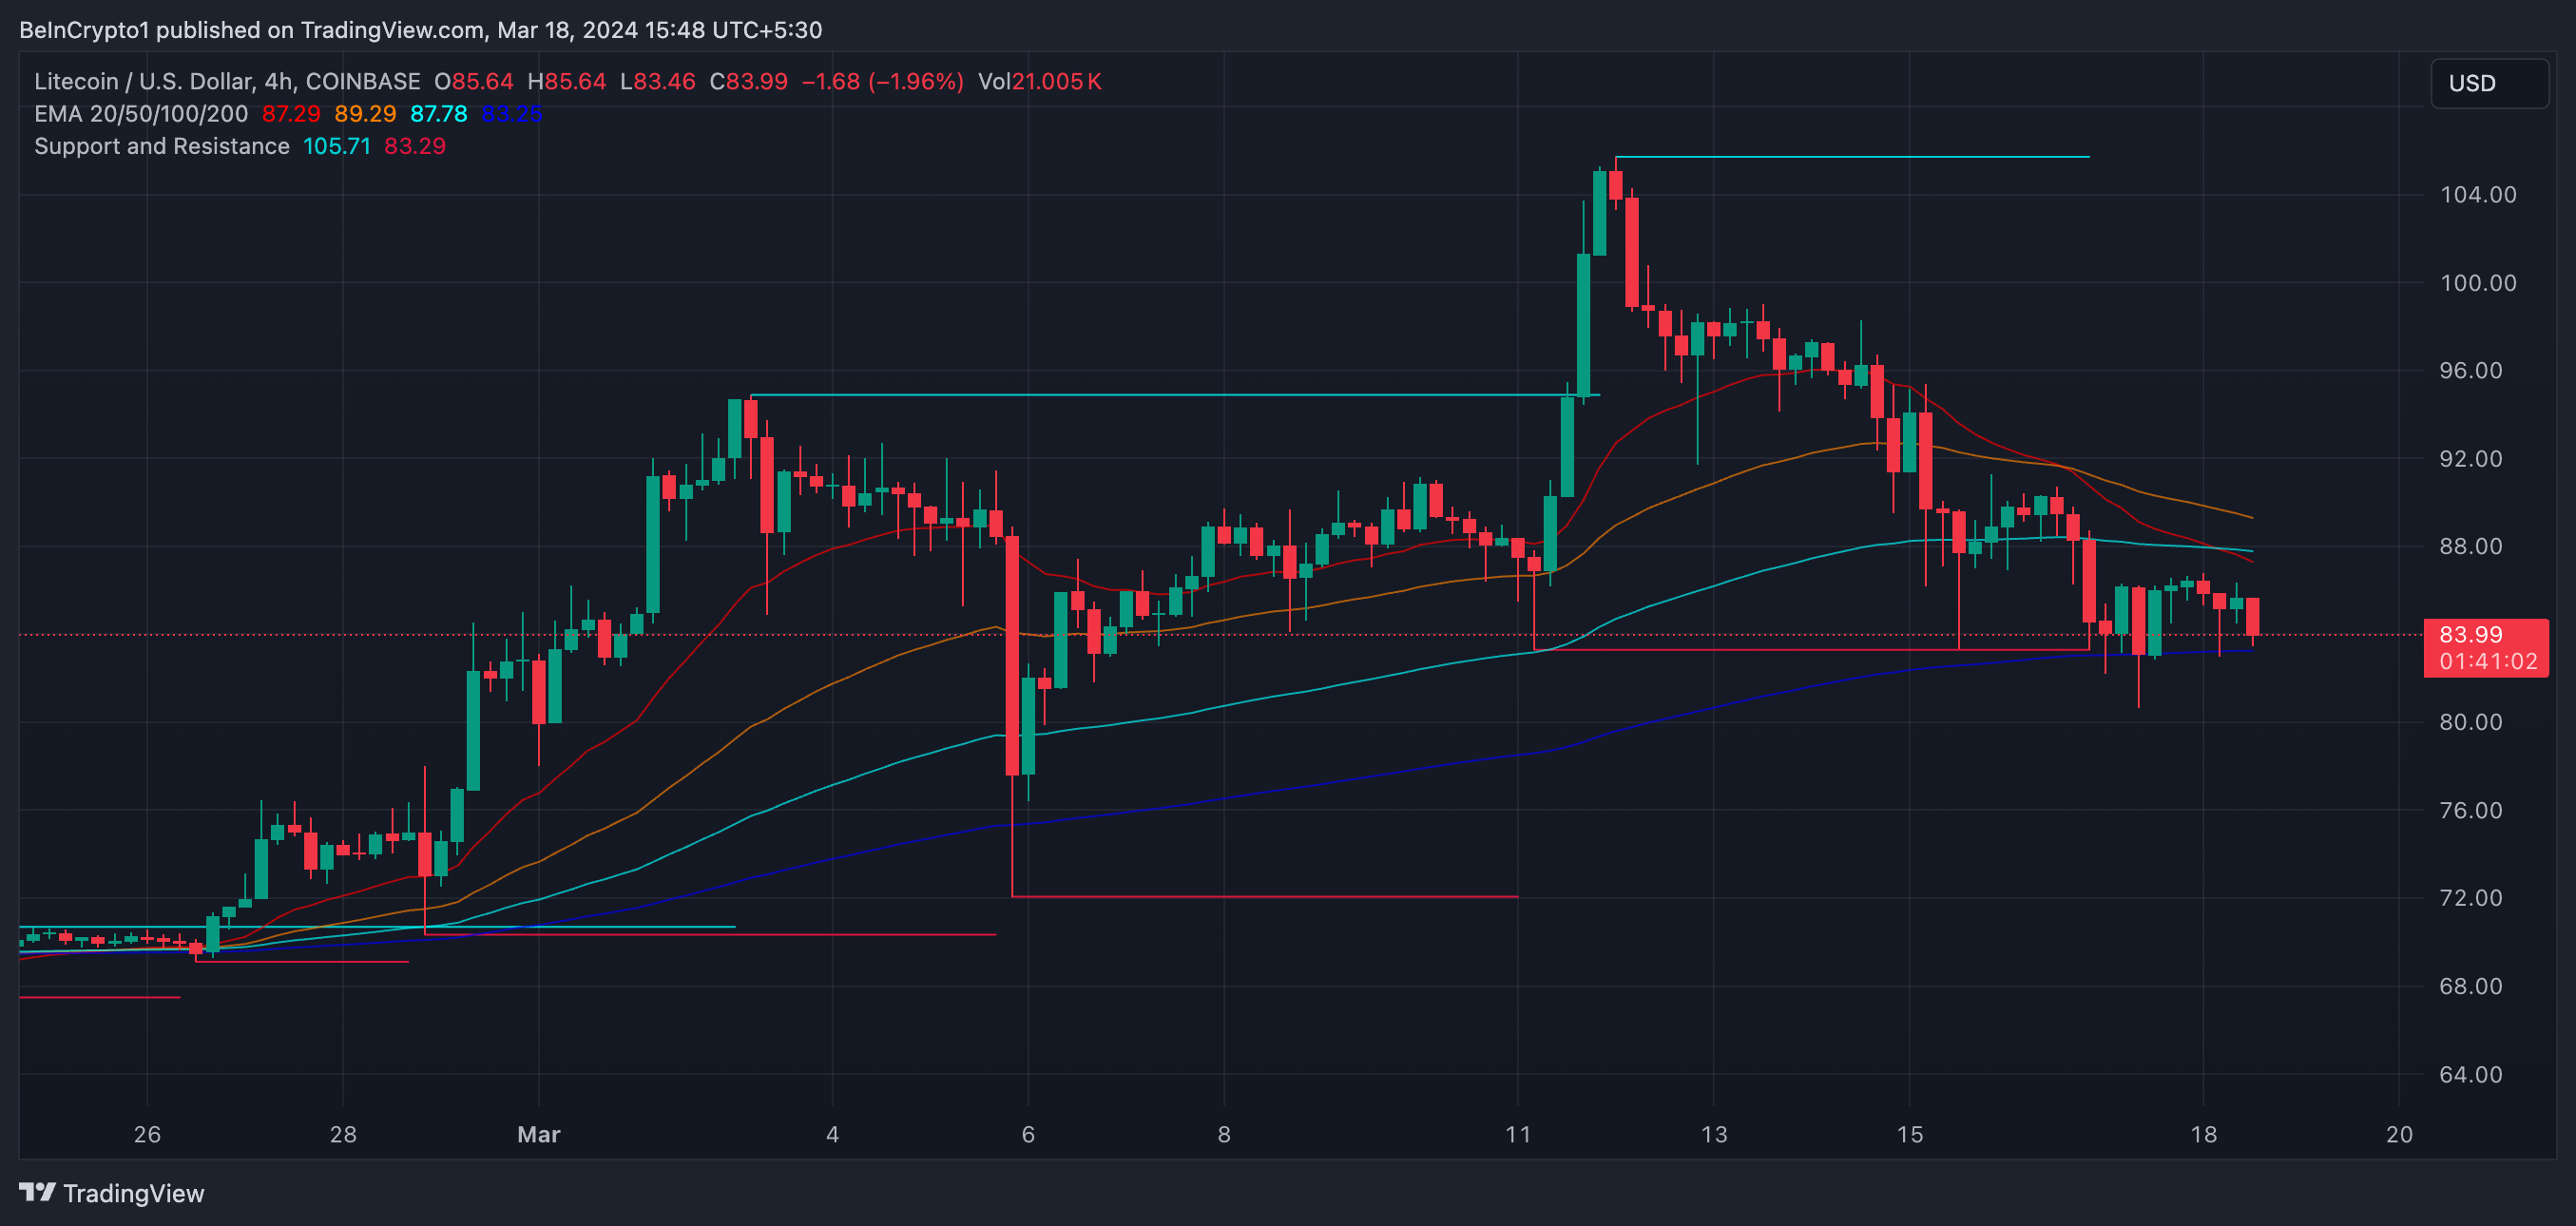
When short-term EMA lines (like the EMA 20) begin to touch the price and move lower than the long-term EMAs (like the EMA 100 or 200), it suggests a shift in market sentiment from bullish to bearish. This pattern means that recent prices are falling compared to historical prices, signaling that sellers are gaining control and a downward trend may be imminent.
However, if LTC can revert that trend despite its decreasing number of active addresses and transactions, it could test the $95 resistance and, breaking that one, rise to $105.


